How to guides
Data Hub
The Data Hub provides comprehensive data integration and management capabilities for seamlessly integrating and unifying enterprise data. It centralizes data management for enhanced operational efficiency, enables effortless upload and organization of documents at scale, and unlocks insights with robust business intelligence reporting tools.
Overview
The Data Hub serves as the central platform for all data-related operations in Vue.ai, offering three main components:
- Connection Manager: Connect to any data source or destination with support for 250+ data sources and 200+ destinations
- Document Manager: Intelligent document processing with AI-powered extraction and classification capabilities
- Dataset Manager: Comprehensive dataset management with profiling, versioning, and relationship modeling
Connection Manager
The Connection Manager is the I/O of the Vue Platform. It enables connecting to any data source or destination to process data using a simple user interface, supporting data in all formats, sizes, and from any data system. Connector Manager supports data in all formats, sizes, and from any data system. Data is brought into the system in the form of datasets.
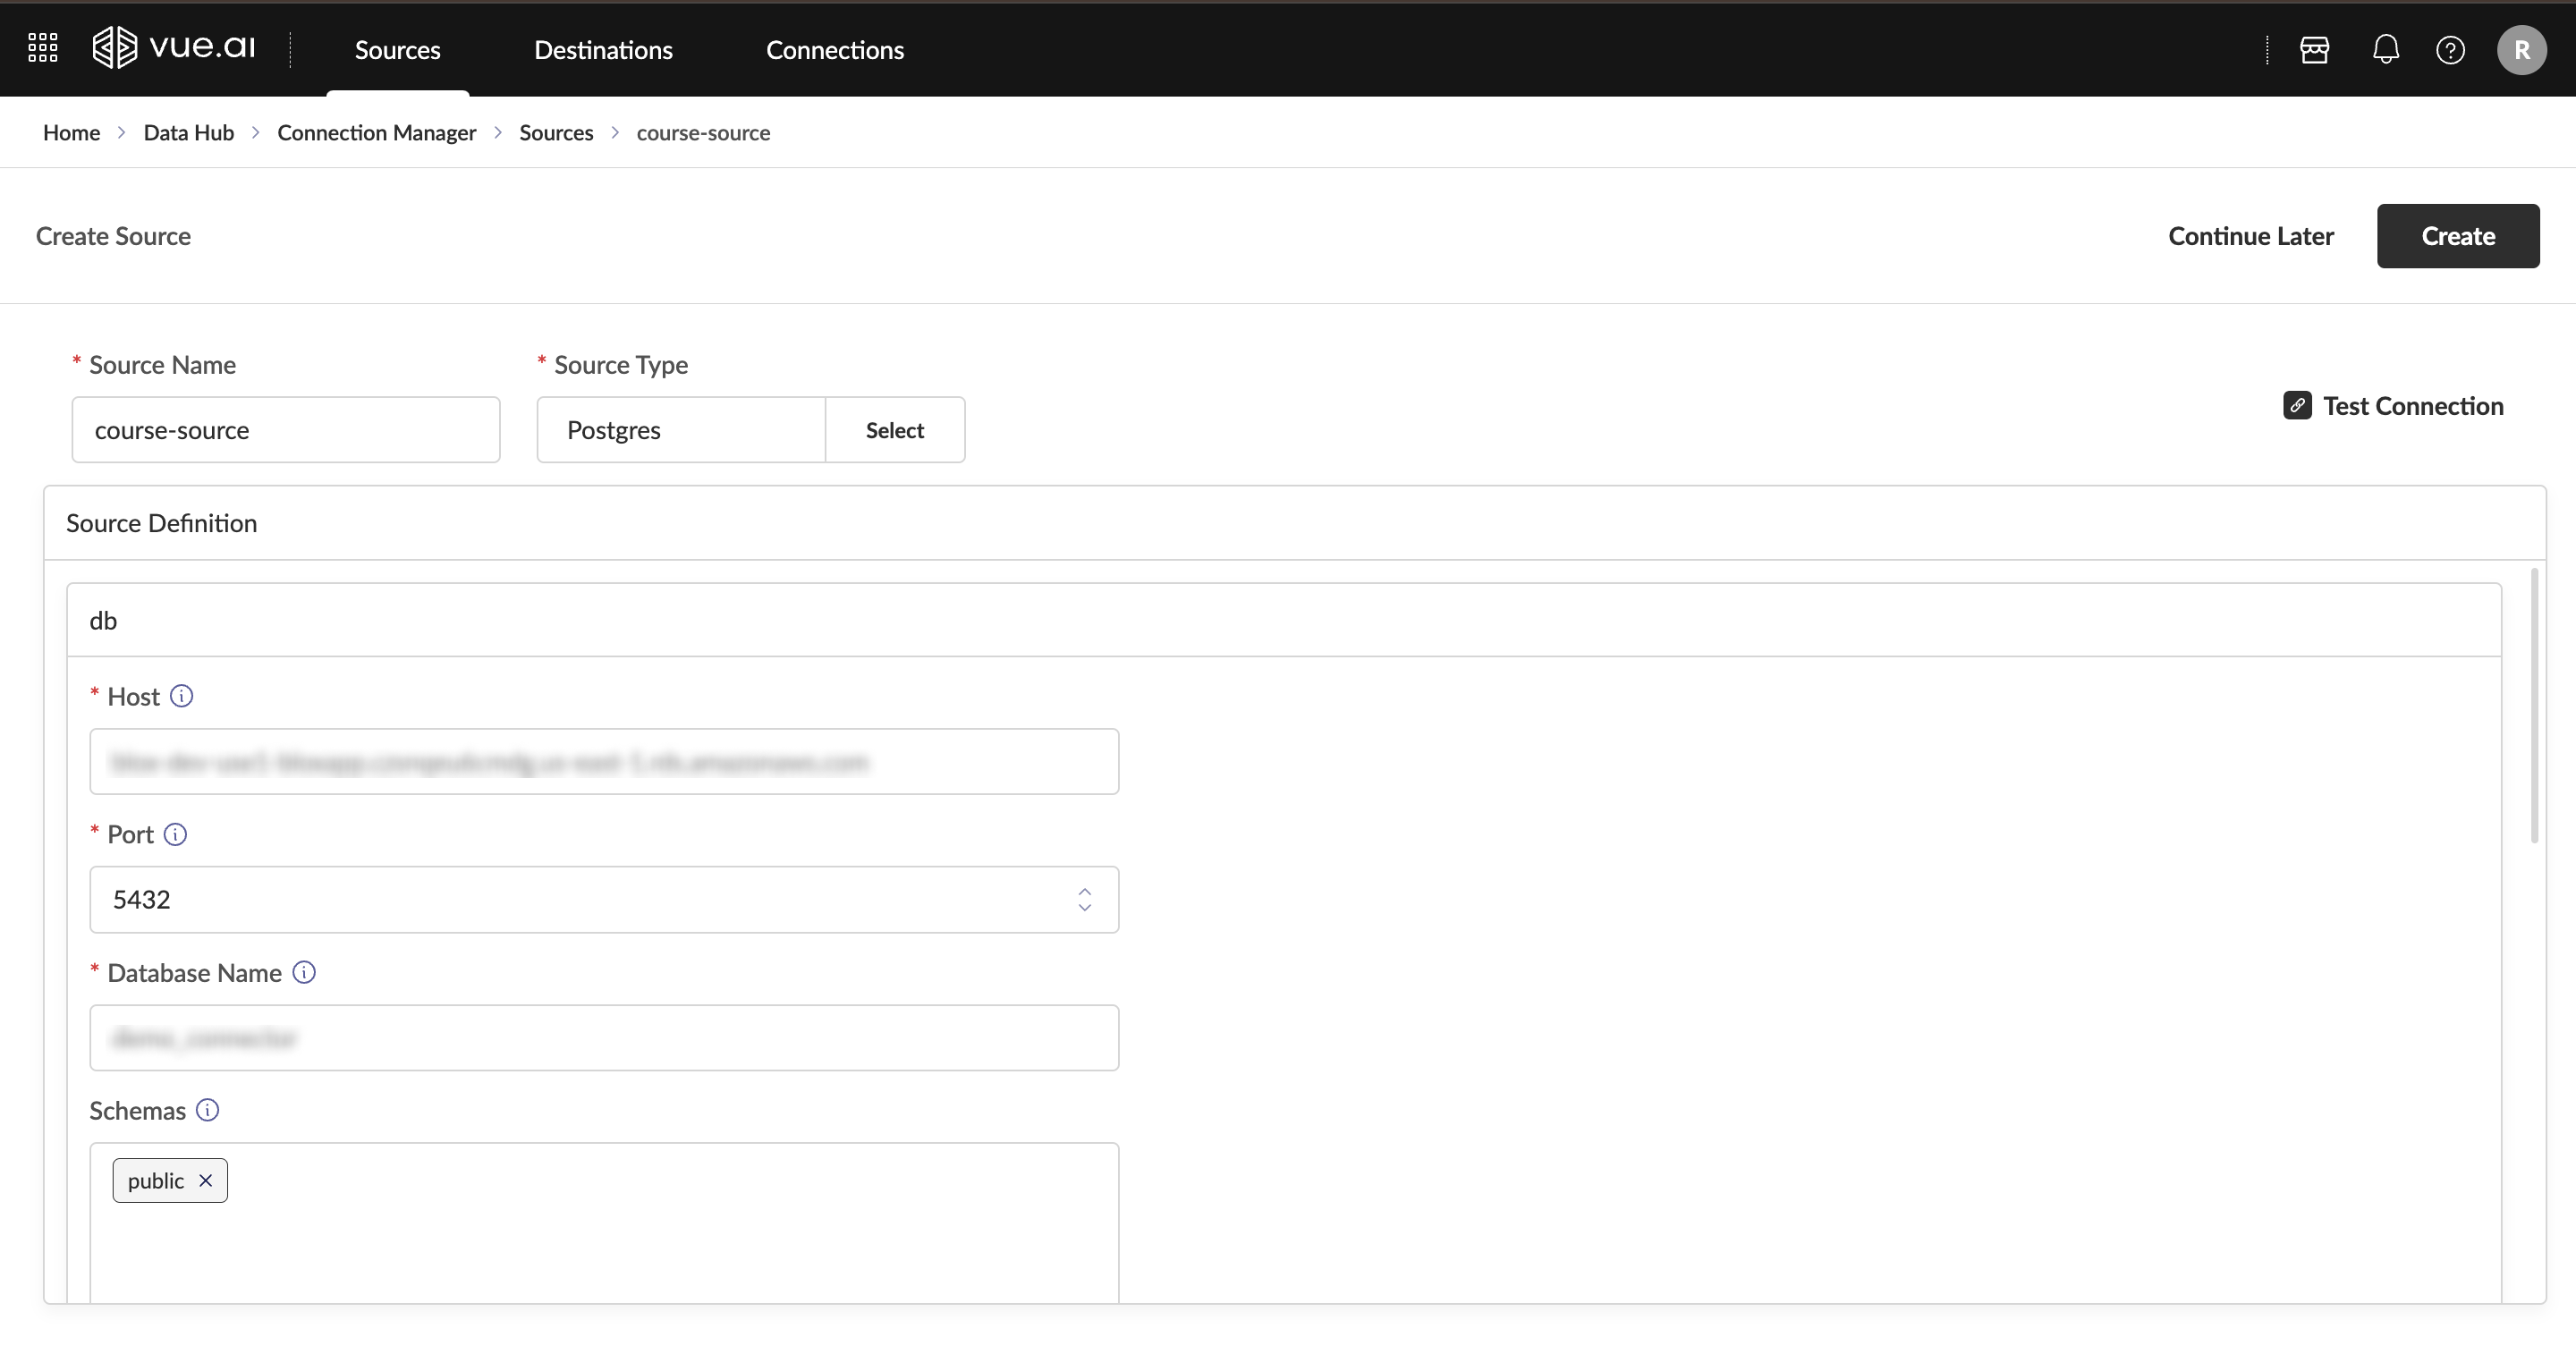
With Sources, users can:
- Establish Connection to Any Data Source: Read data from over 250 supported data sources out of the box
- Custom Sources: Build custom sources via the Connector Development Kit (CDK), a low-code interface
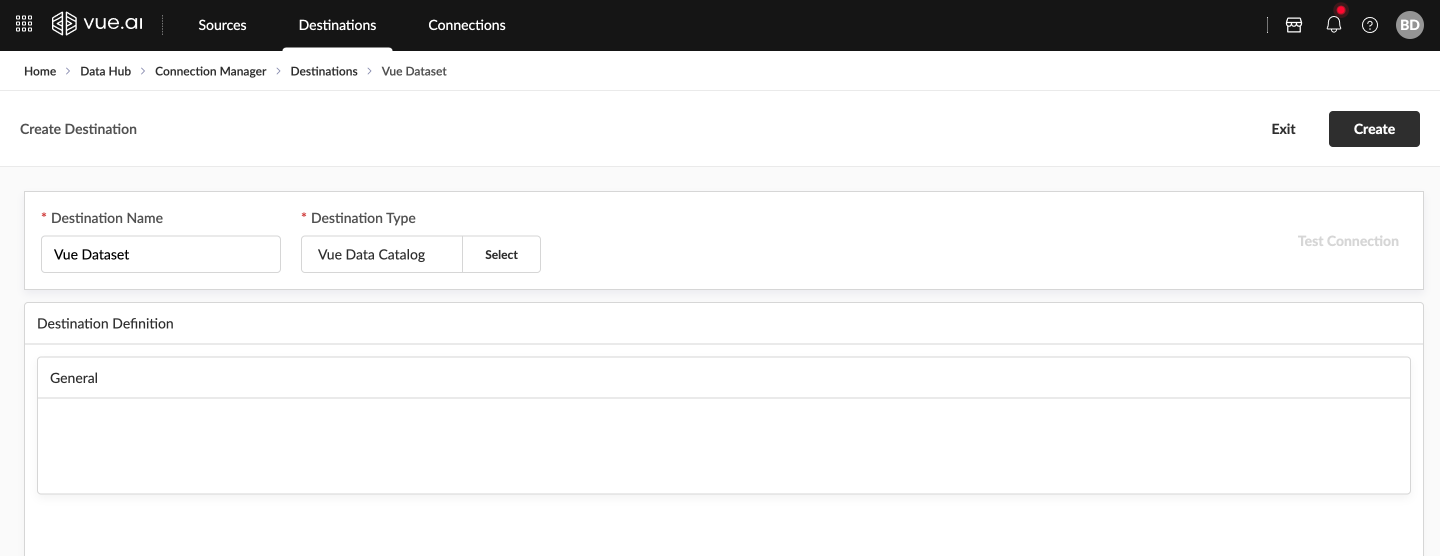
With Destinations, users can:
- Establish Connection to Any Data Destination: Write data to over 200 supported data destinations out of the box
- Custom Destinations: Build custom destinations via the Connector Development Kit (CDK), a low-code interface
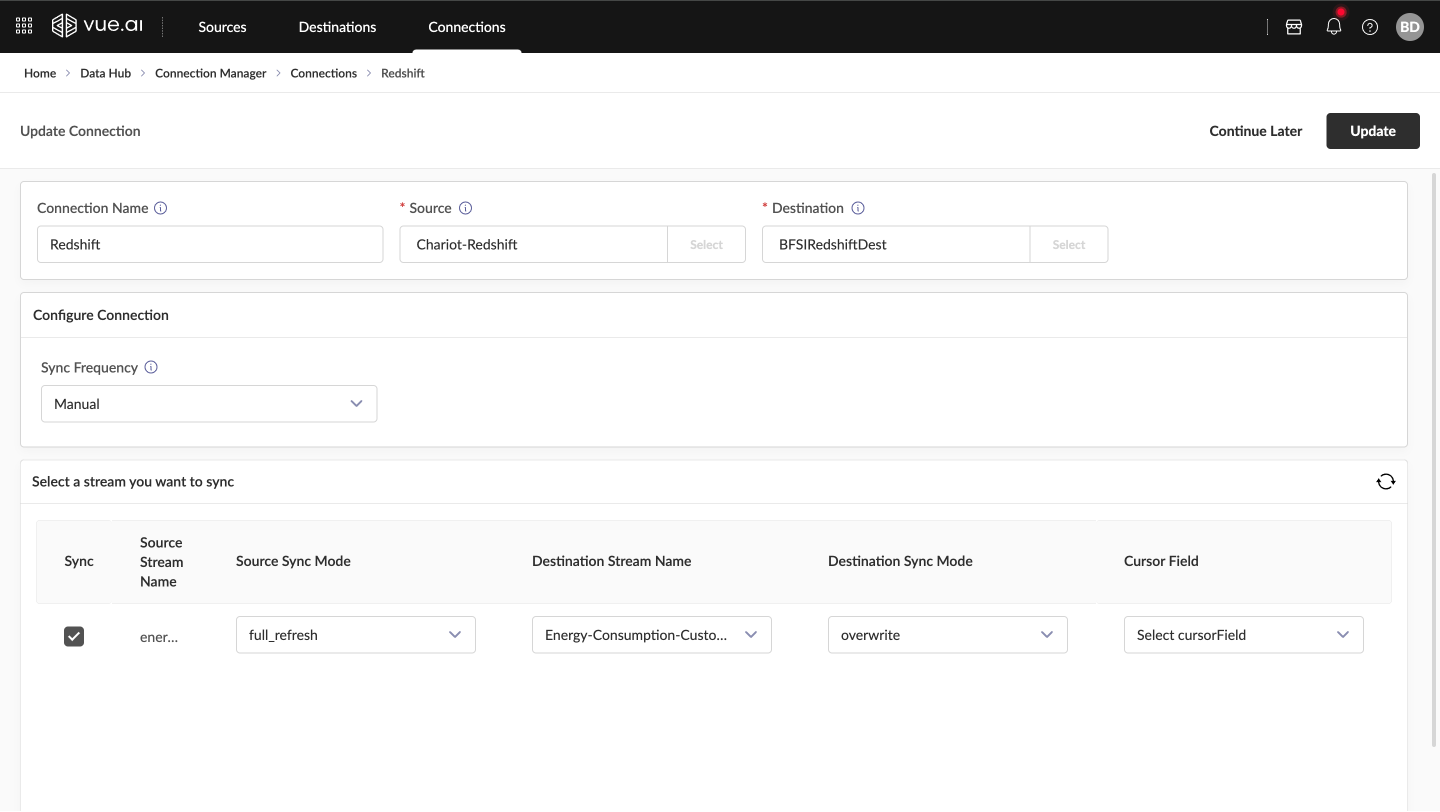
With Connections, users can:
- Establish Link Between Source & Destination: Create connections between any source and destination
- Configure Sync Frequency: Set how often data should be synchronized
- Define the Stream Configuration: Specify the stream and its configuration for syncing
Data Ingestion Using Connectors
This comprehensive guide assists in understanding the configuration of data sources and destinations and the establishment of connections for seamless data flow in Vue.ai's Connection Manager.
Getting Started
Prerequisites Before beginning, ensure that:
- Basic data concepts like schemas, appending, and de-duplication are understood
- Connector Concepts: sources, destinations, and CRON expressions are understood
- Administrator access to the Vue.ai platform is available
- Credentials for the data sources and destinations to be configured are available
Familiarity with basic data concepts like schemas, appending, and de-duplication is required.
Configuring a Source
Navigation Navigate to Data Hub → Connection Manager → Sources
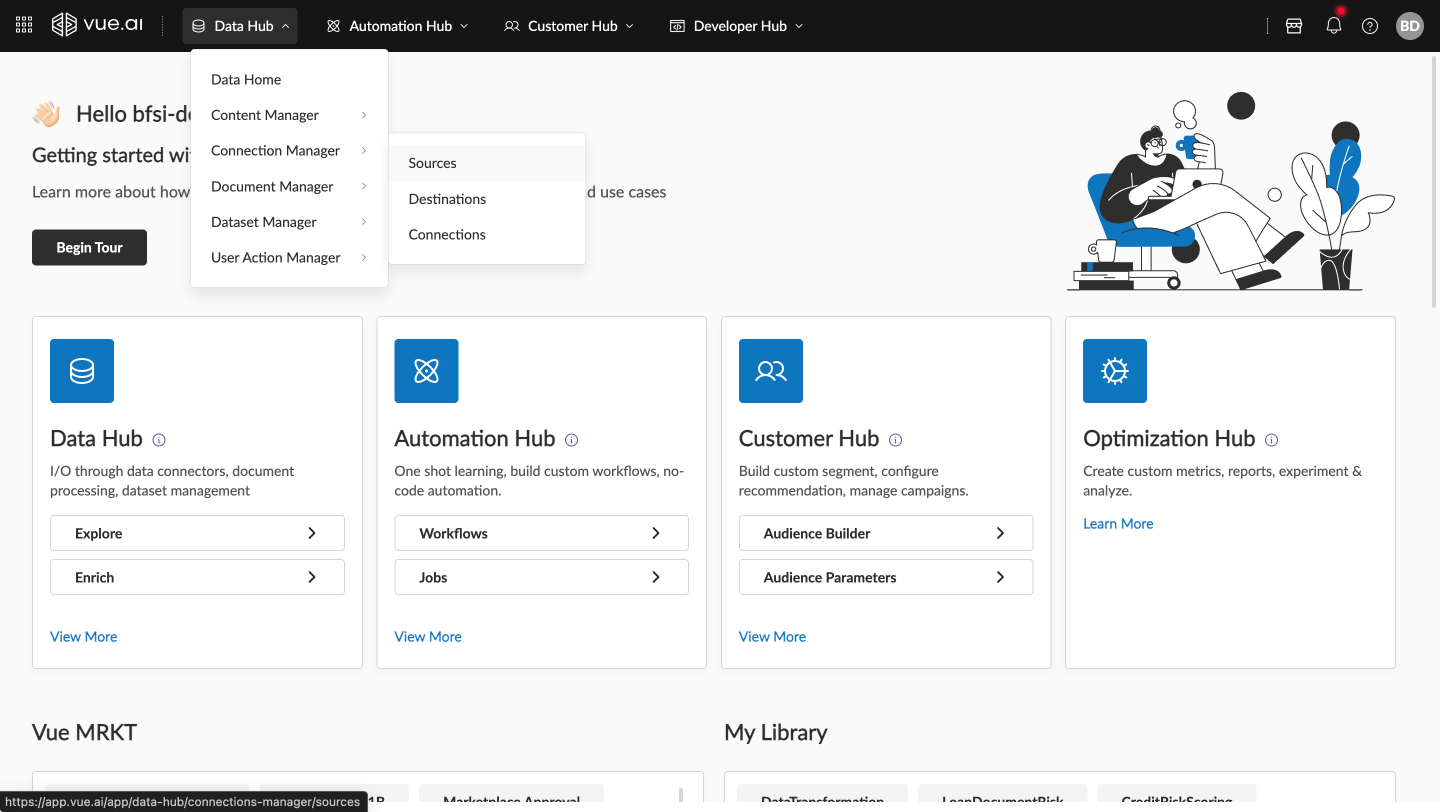
Create Source On the Source Listing page, click Create New
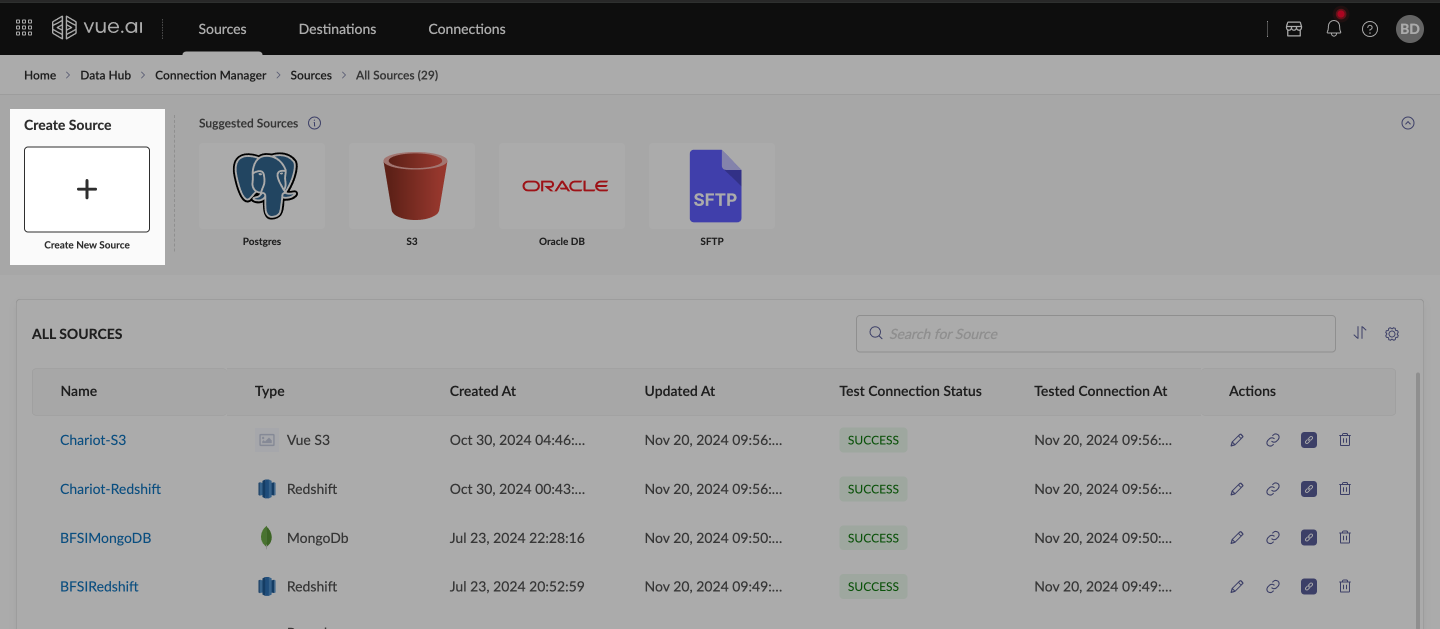
- Enter a unique name for the source
- Select a source type (e.g., PostgreSQL, Google Analytics)
- Provide necessary credentials in the configuration form
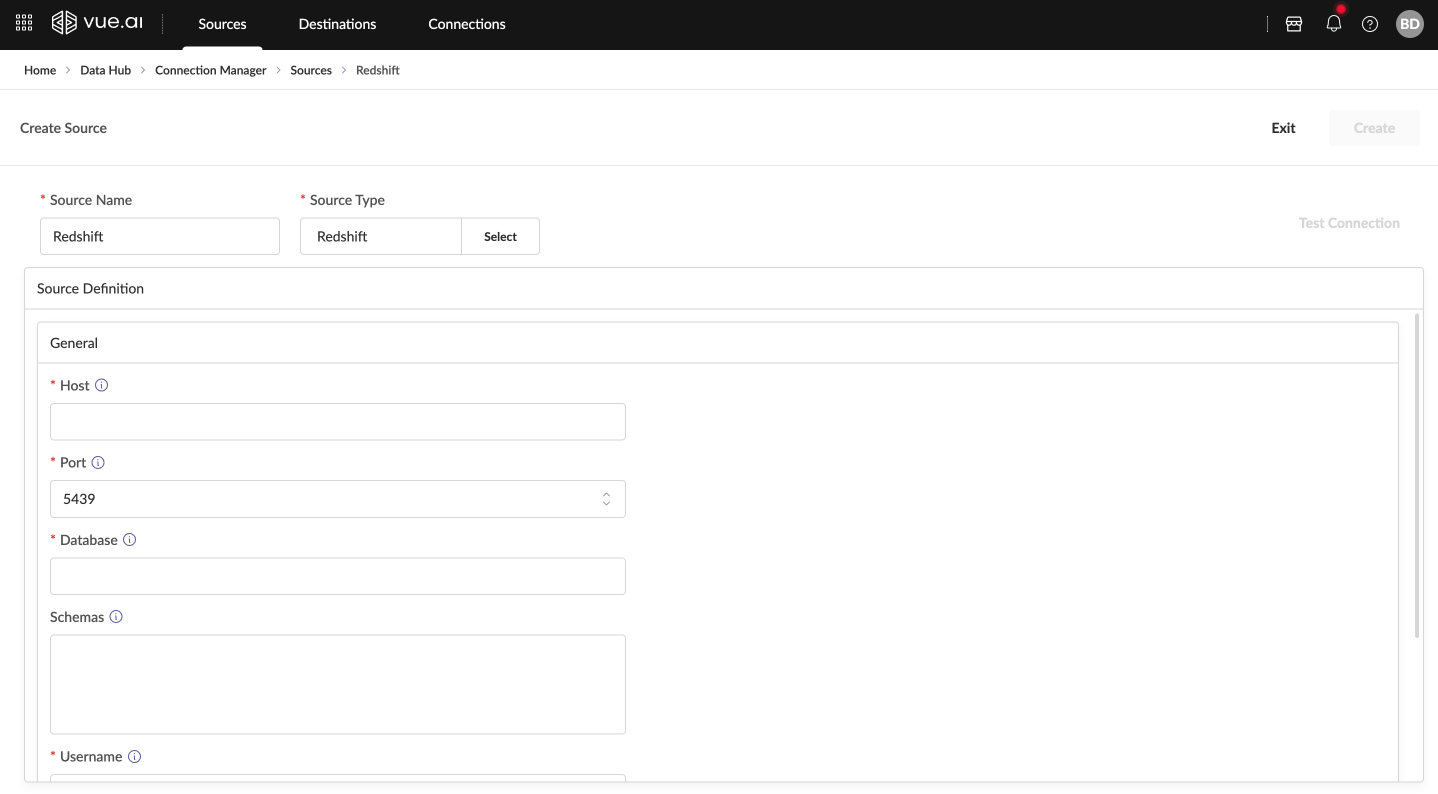
Test Connection Verify the source connection by selecting Test Connection
Configuring a Destination
Navigation Go to Data Hub → Connection Manager → Destination
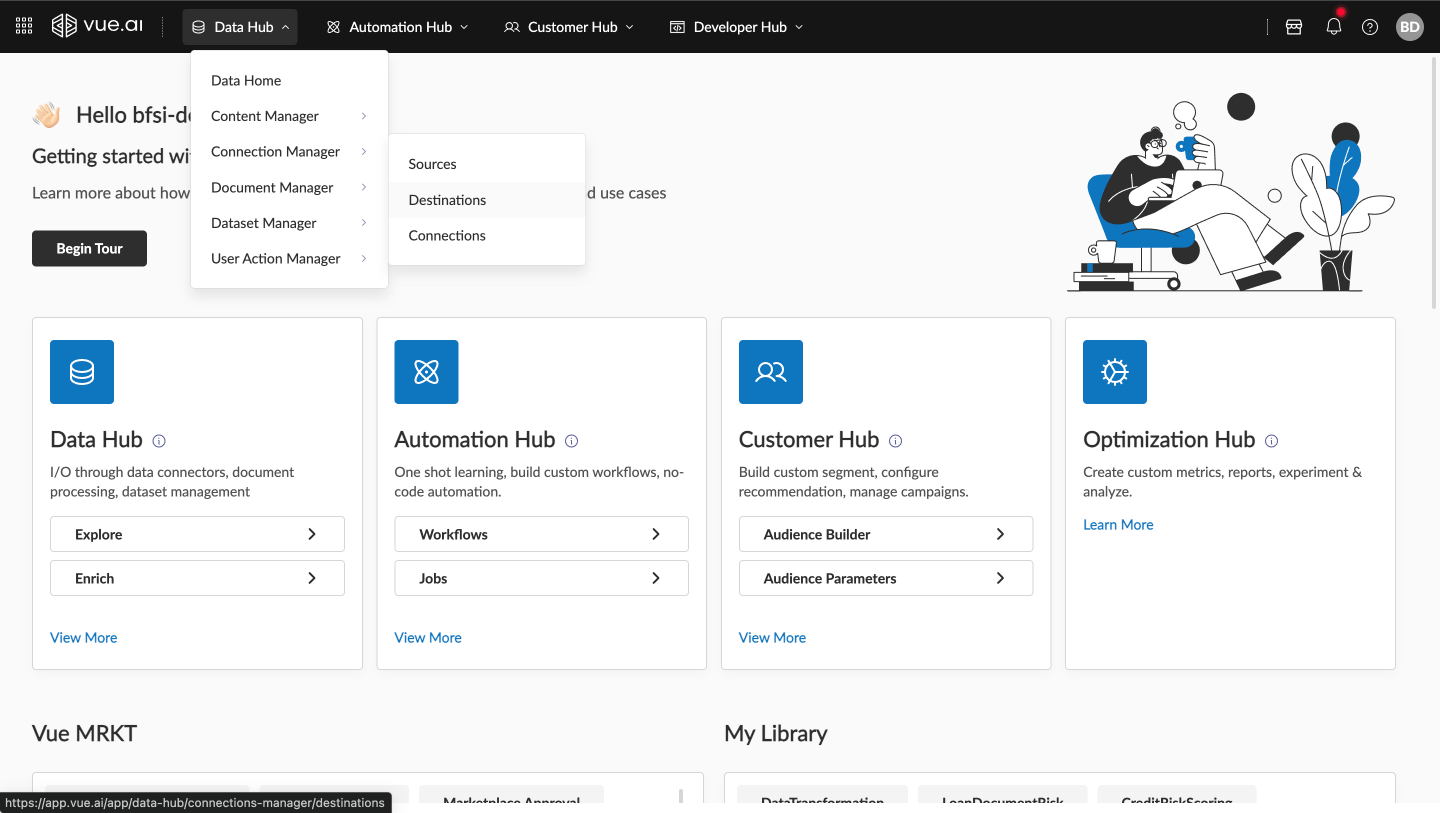
Create Destination Click Create New on the Destination Listing page
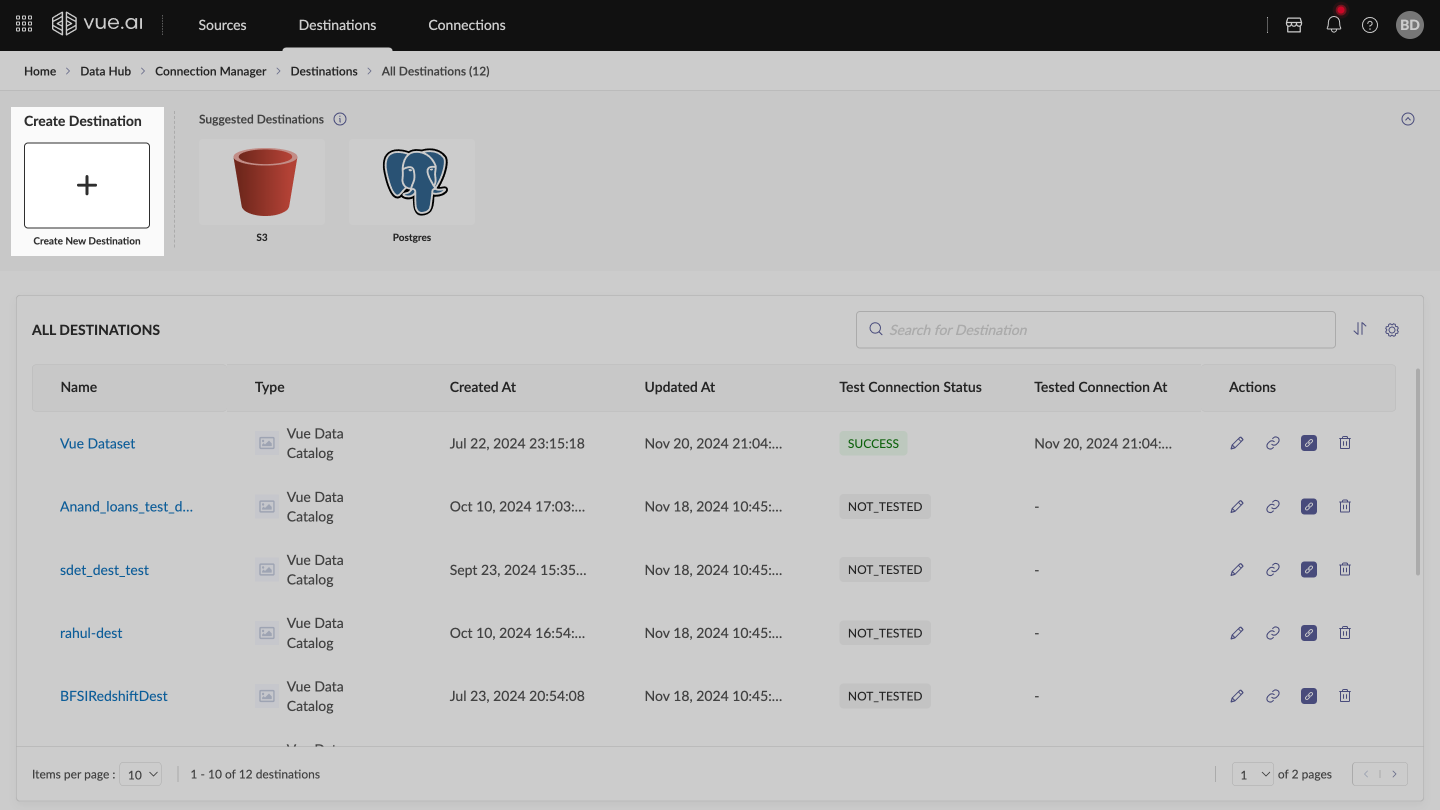
- Enter a unique name
- Select the destination type (e.g., Vue Dataset)

Test Connection Verify the destination configuration
Establishing a Connection
Navigation Go to Data Hub → Connection Manager → Connections
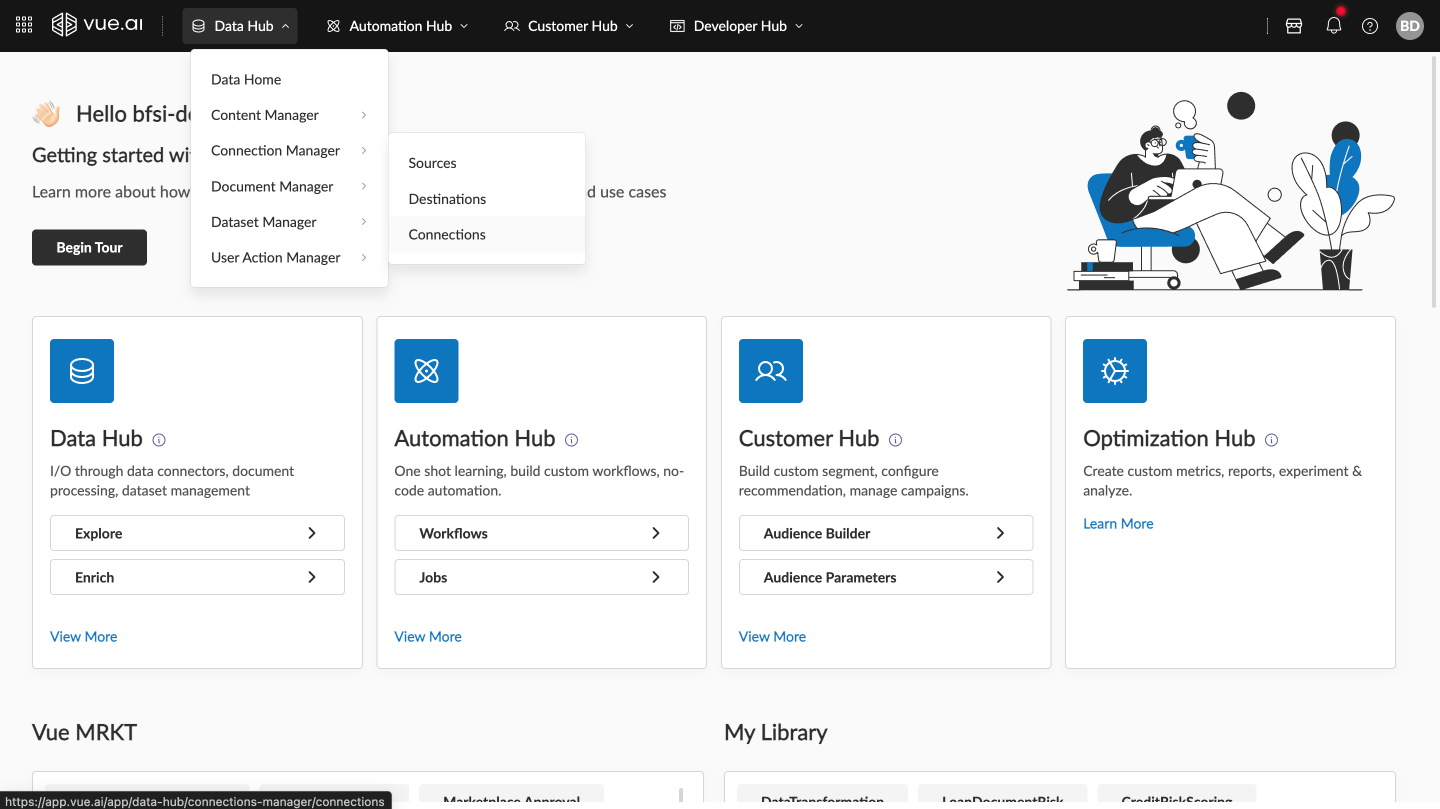
Create Connection Select Create New on the Connection Listing page
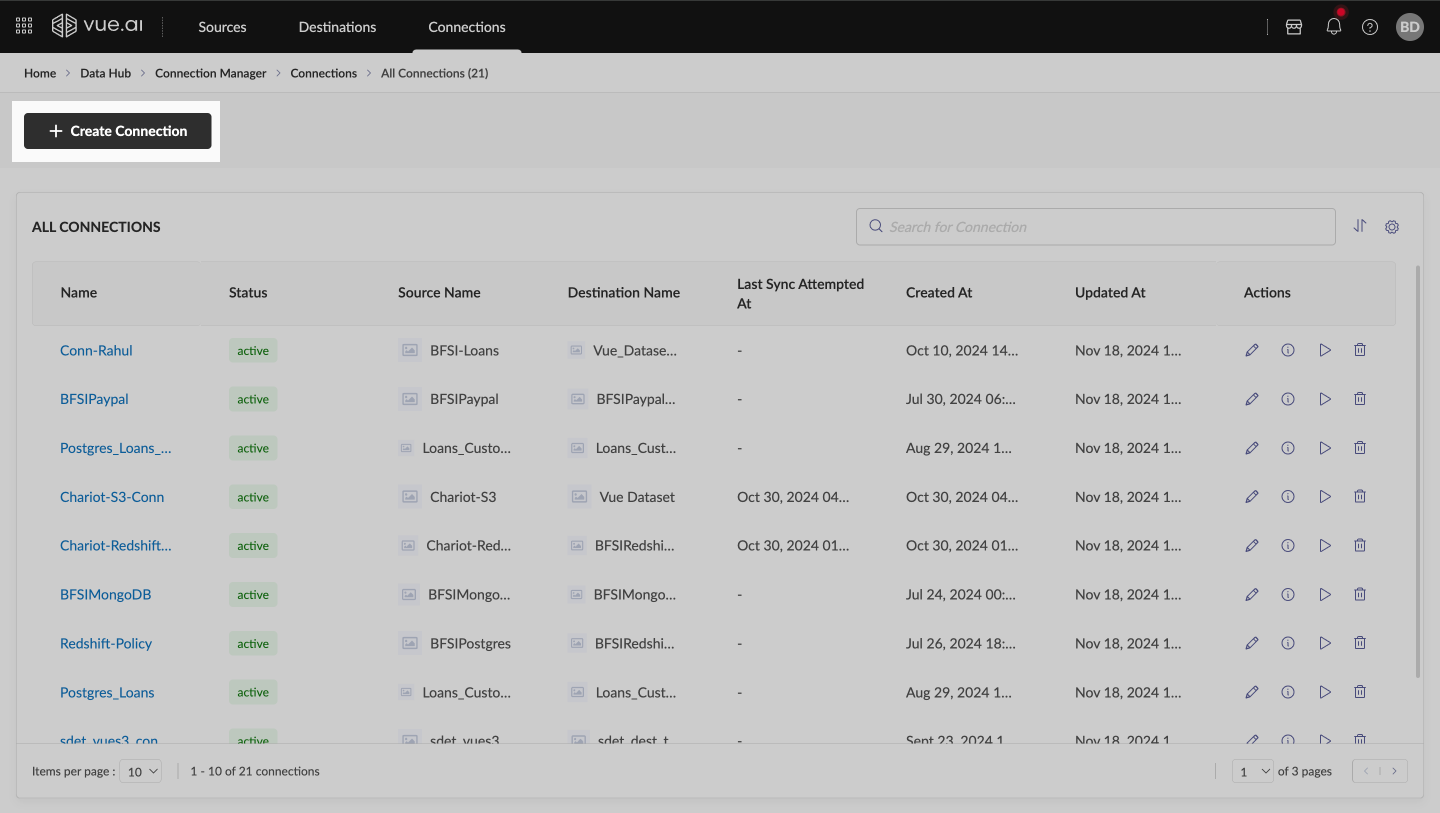
- Enter a connection name
- Choose the source and destination
Configure Settings
- Data Sync Frequency: Choose Manual or Scheduled (configure CRON expressions if needed)
- Select streams or schemas for data transfer
- Specify sync options: Full Refresh or Incremental

Run Connection Select Create Connection and execute it
Sources Configuration
HubSpot Data Source Configuration
This guide provides step-by-step instructions on configuring HubSpot as a data source, covering prerequisites, authentication methods, and configuration steps for seamless integration.
Prerequisites Before beginning the integration, ensure the following are available:
- HubSpot Developer Account
- Access to HubSpot API Keys or OAuth Credentials
Ensure access to a HubSpot Developer Account and HubSpot API Keys or OAuth Credentials before starting.
Authentication Methods
HubSpot supports two authentication methods for data source configuration:
- OAuth
- Private App Authentication
OAuth Authentication
Credentials Needed:
- Client ID
- Client Secret
- Refresh Token
To obtain OAuth Credentials:
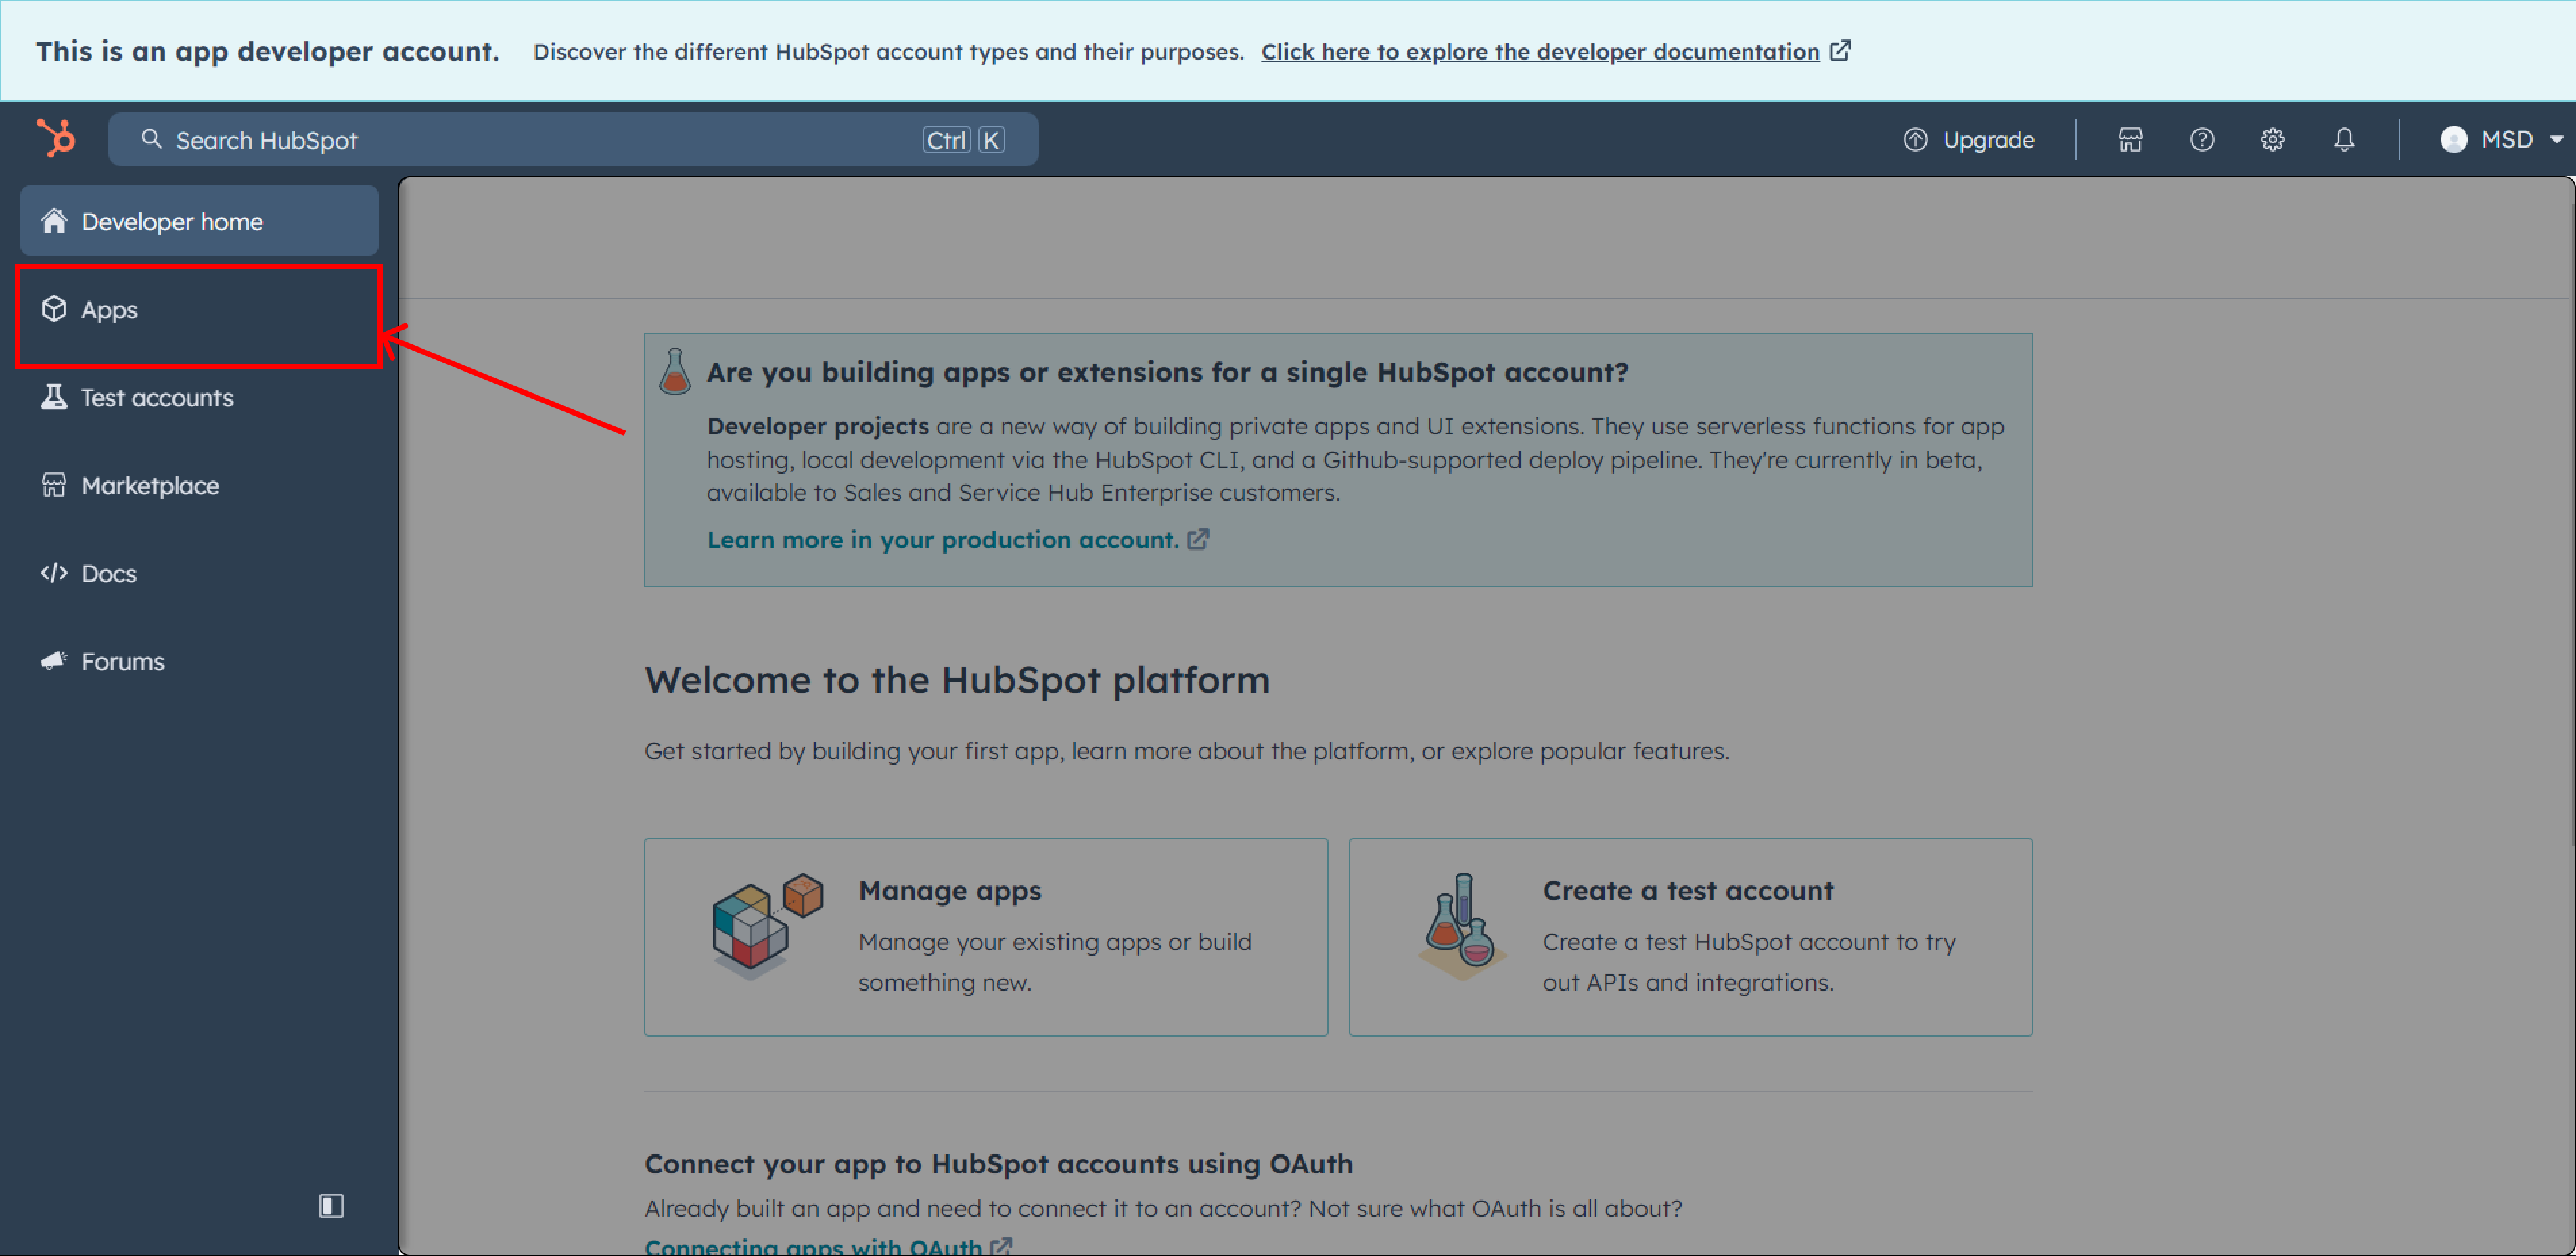
Access the HubSpot Developer Account Navigate to Apps within the account
Identify an App with Required Scopes Create or identify an app with the required scopes:
ticketse-commercemedia_bridge.readcrm.objects.goals.readtimelinecrm.objects.marketing_events.writecrm.objects.custom.readcrm.objects.feedback_submissions.readcrm.objects.custom.writecrm.objects.marketing_events.readcrm.pipelines.orders.readcrm.schemas.custom.read
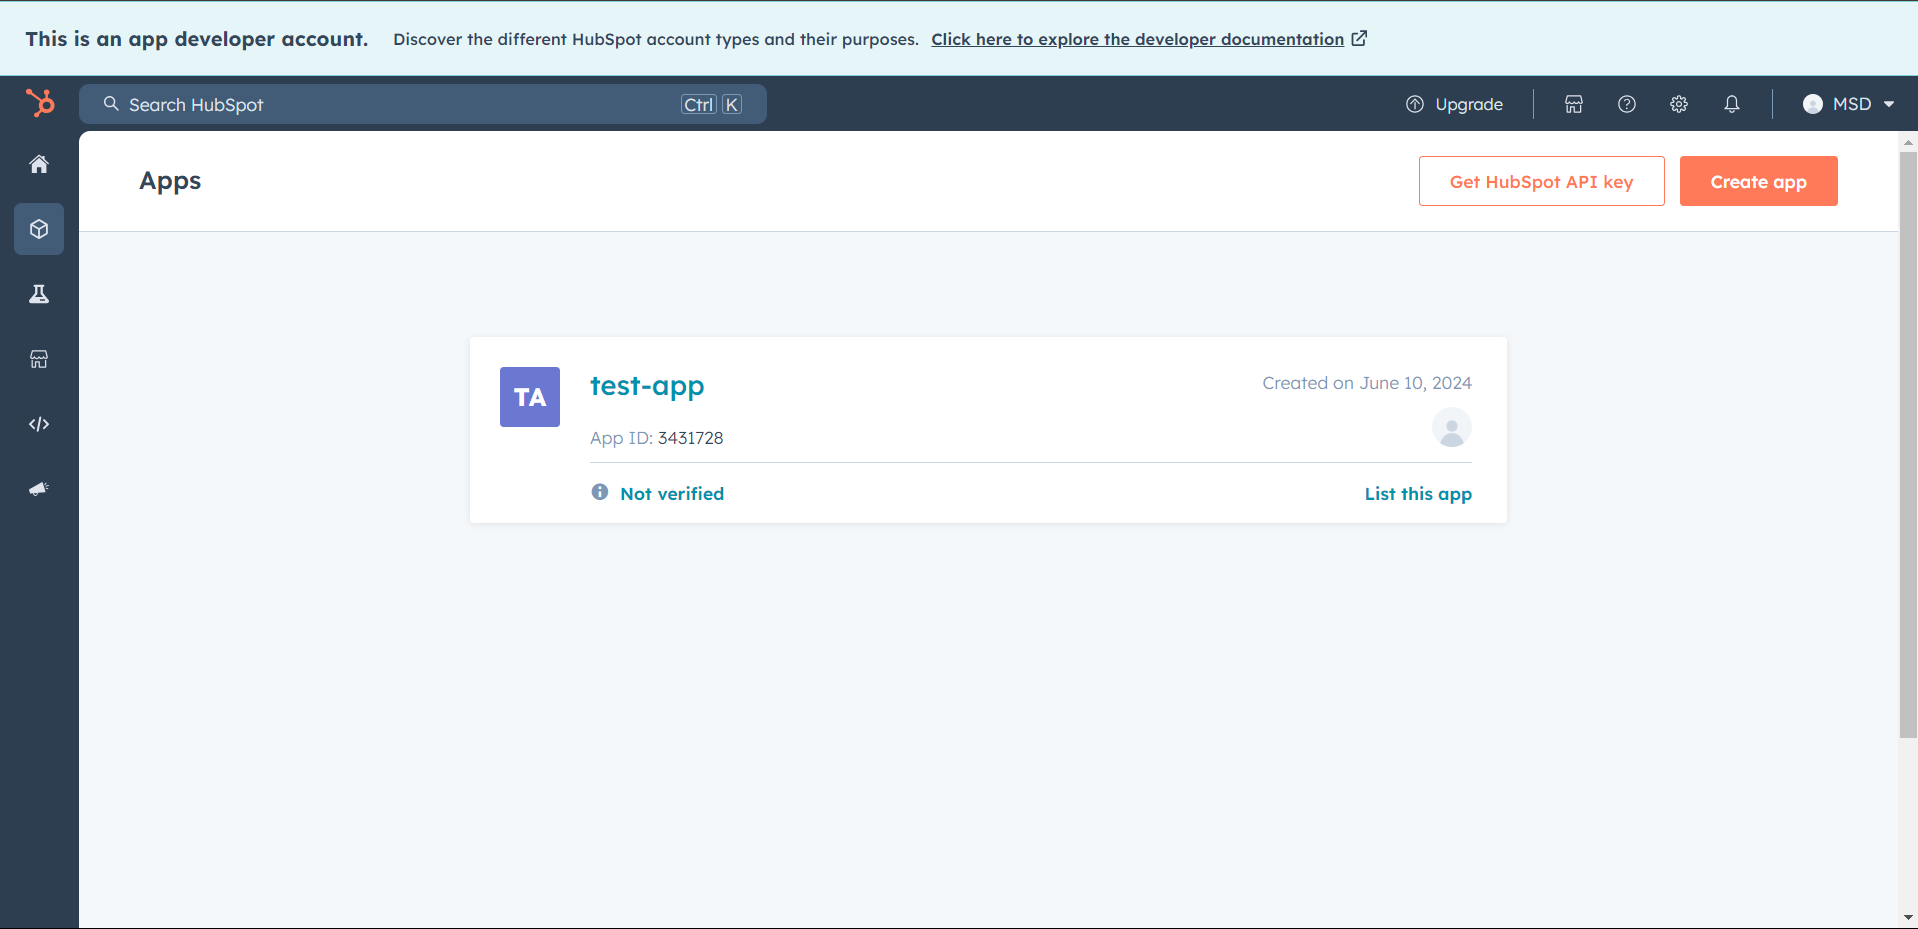
In the app screen, navigate to the Auth Section to locate the Client ID and Client Secret
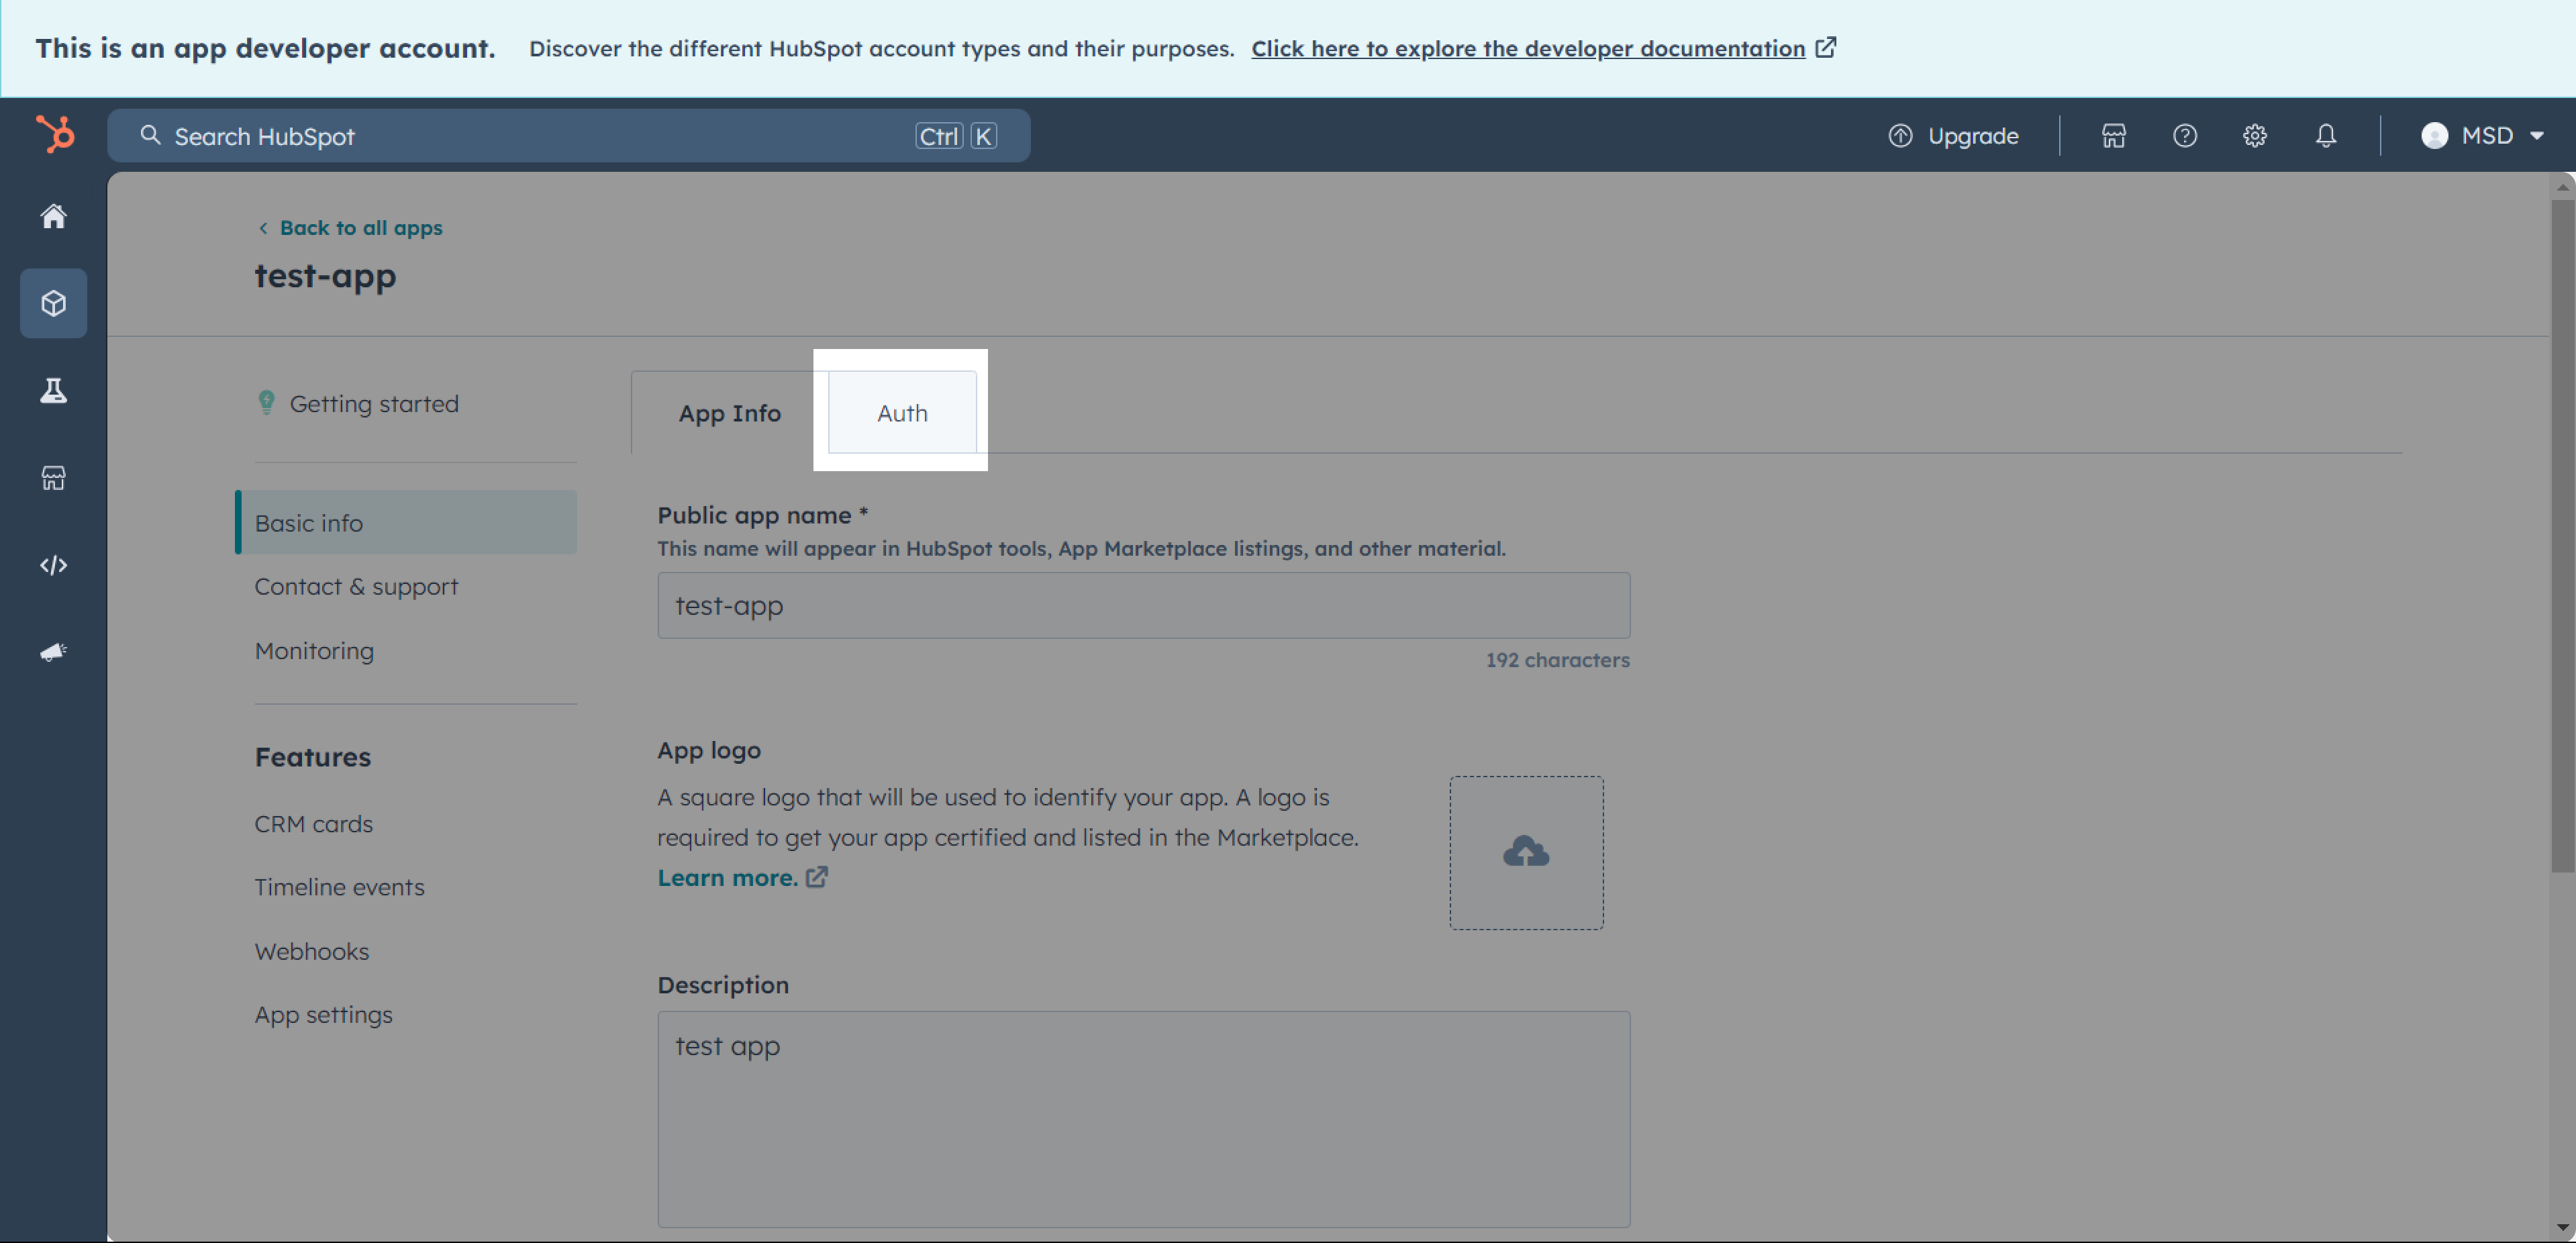
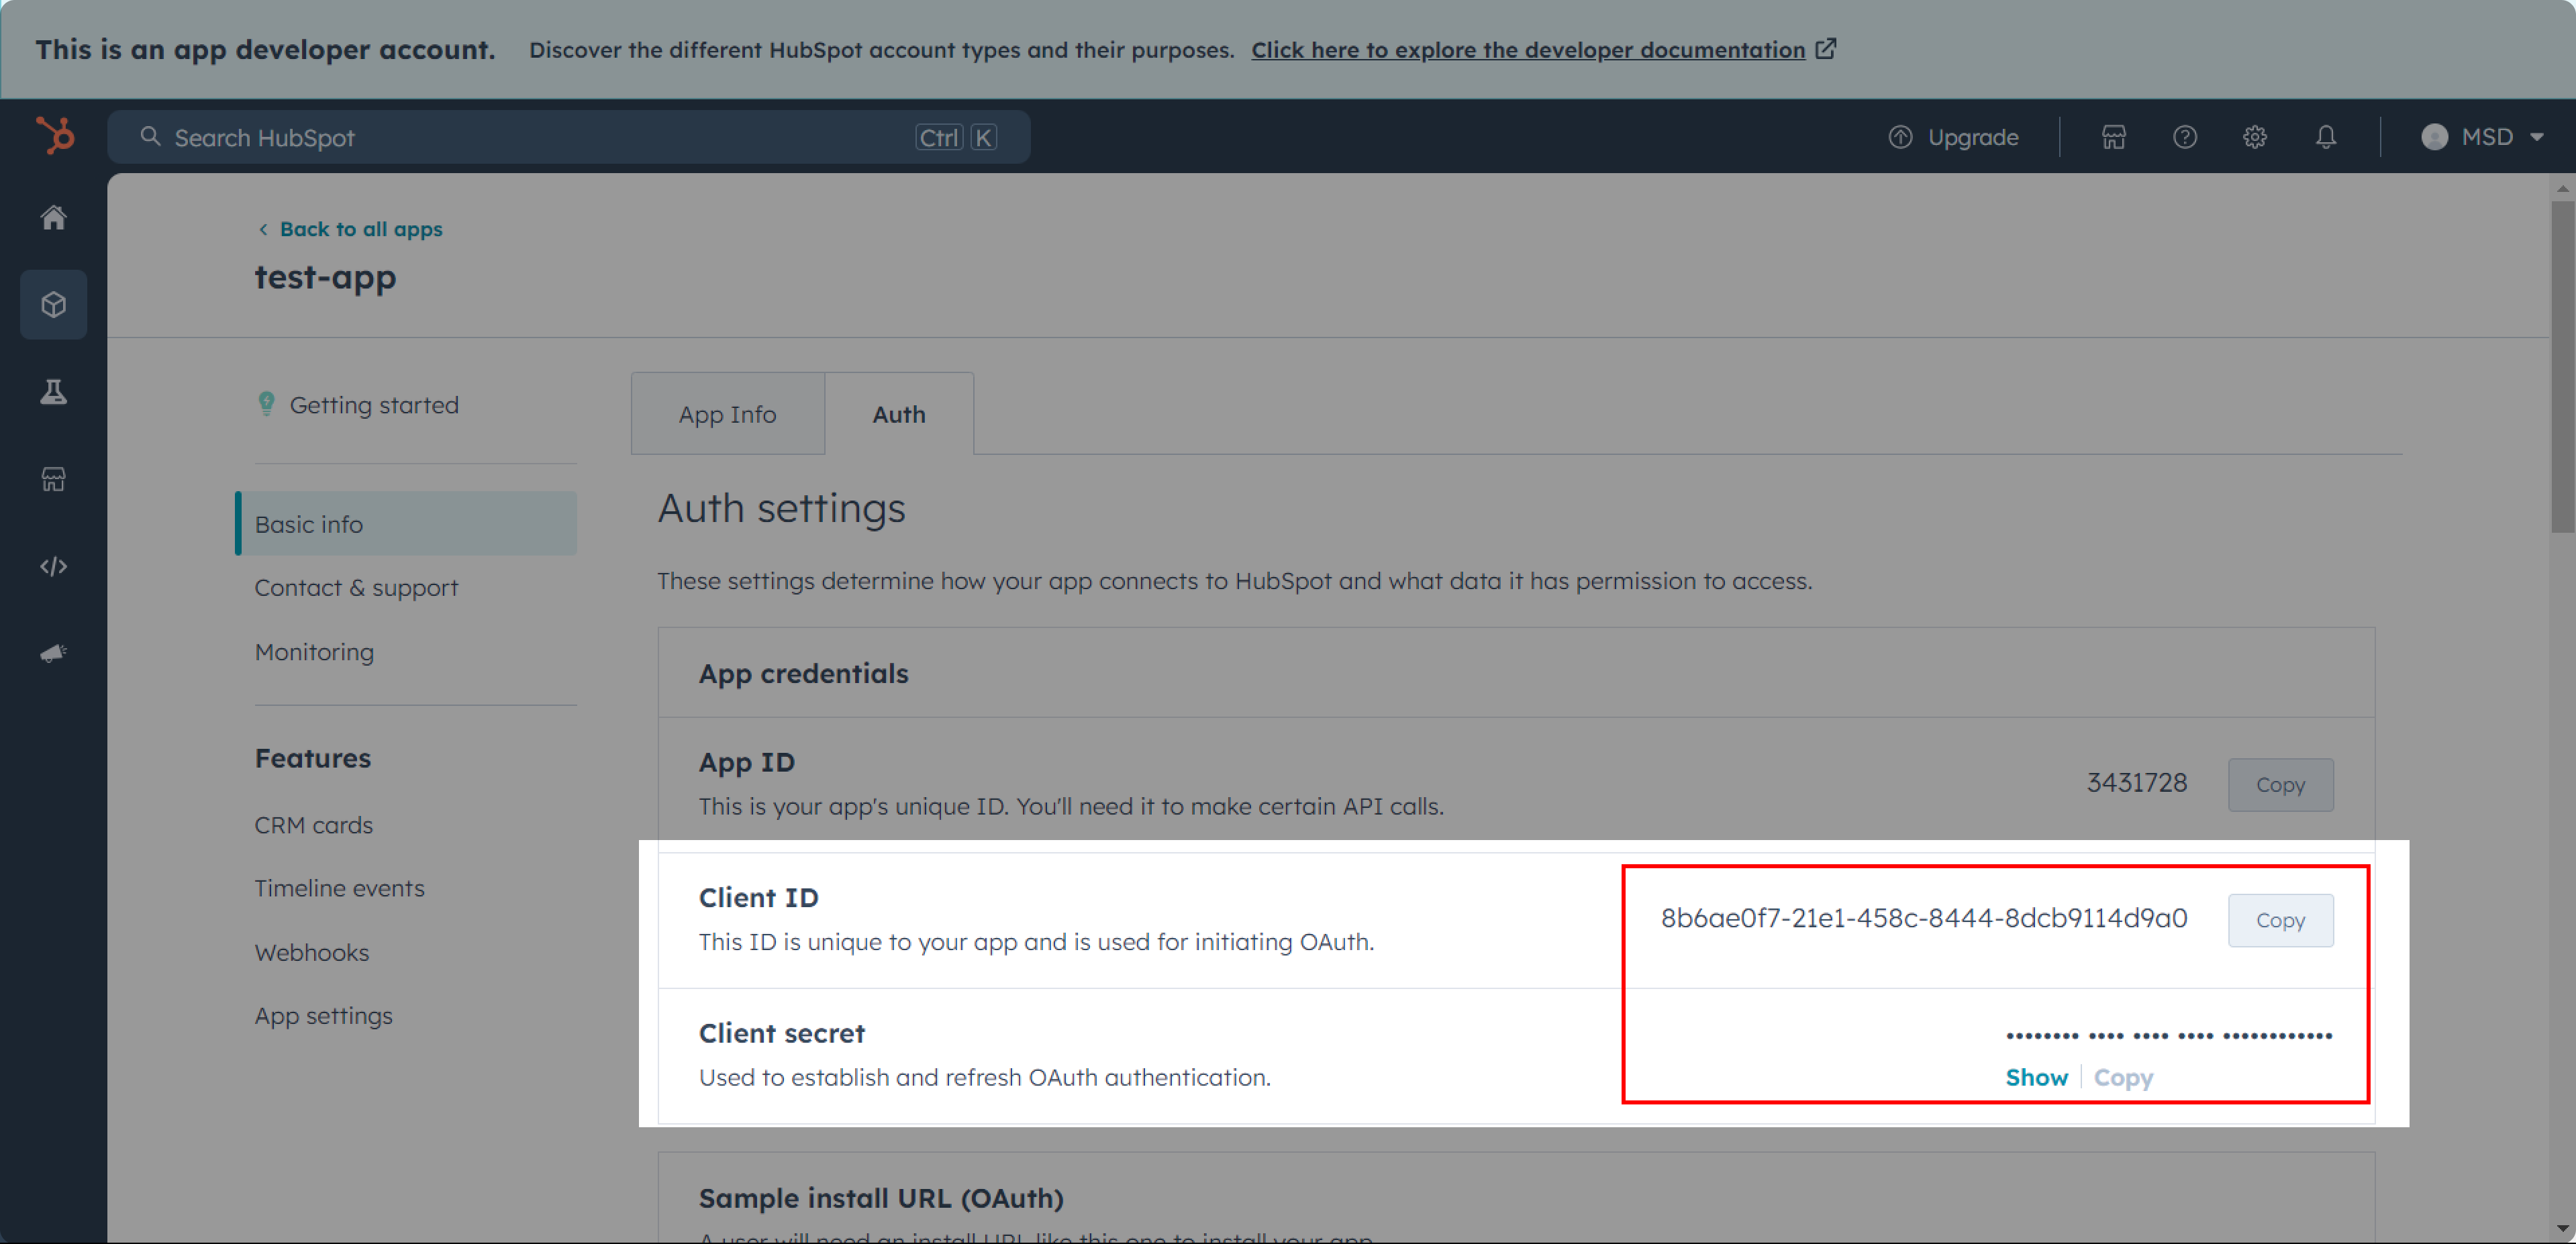
Open the Sample Install URL (OAuth) and authenticate your HubSpot account. Copy the authorization code from the redirect URL
Use the code to obtain a Refresh Token by executing the following cURL command
curl --location 'https://api.hubapi.com/oauth/v1/token' \
--header 'Content-Type: application/x-www-form-urlencoded' \
--data-urlencode 'grant_type=authorization_code' \
--data-urlencode 'client_id=<placeholder_client_id>' \
--data-urlencode 'client_secret=<placeholder_client_secret>' \
--data-urlencode 'redirect_uri=<placeholder_redirect_uri>' \
--data-urlencode 'code=<placeholder_code>'
Private App Authentication
Credentials Needed:
- Private App Access Token
To set up Private App Authentication:
Navigate to Private Apps Settings Go to Settings > Integrations > Private Apps in the HubSpot account
Locate and select the desired Private App, then click View Access Token to copy the token
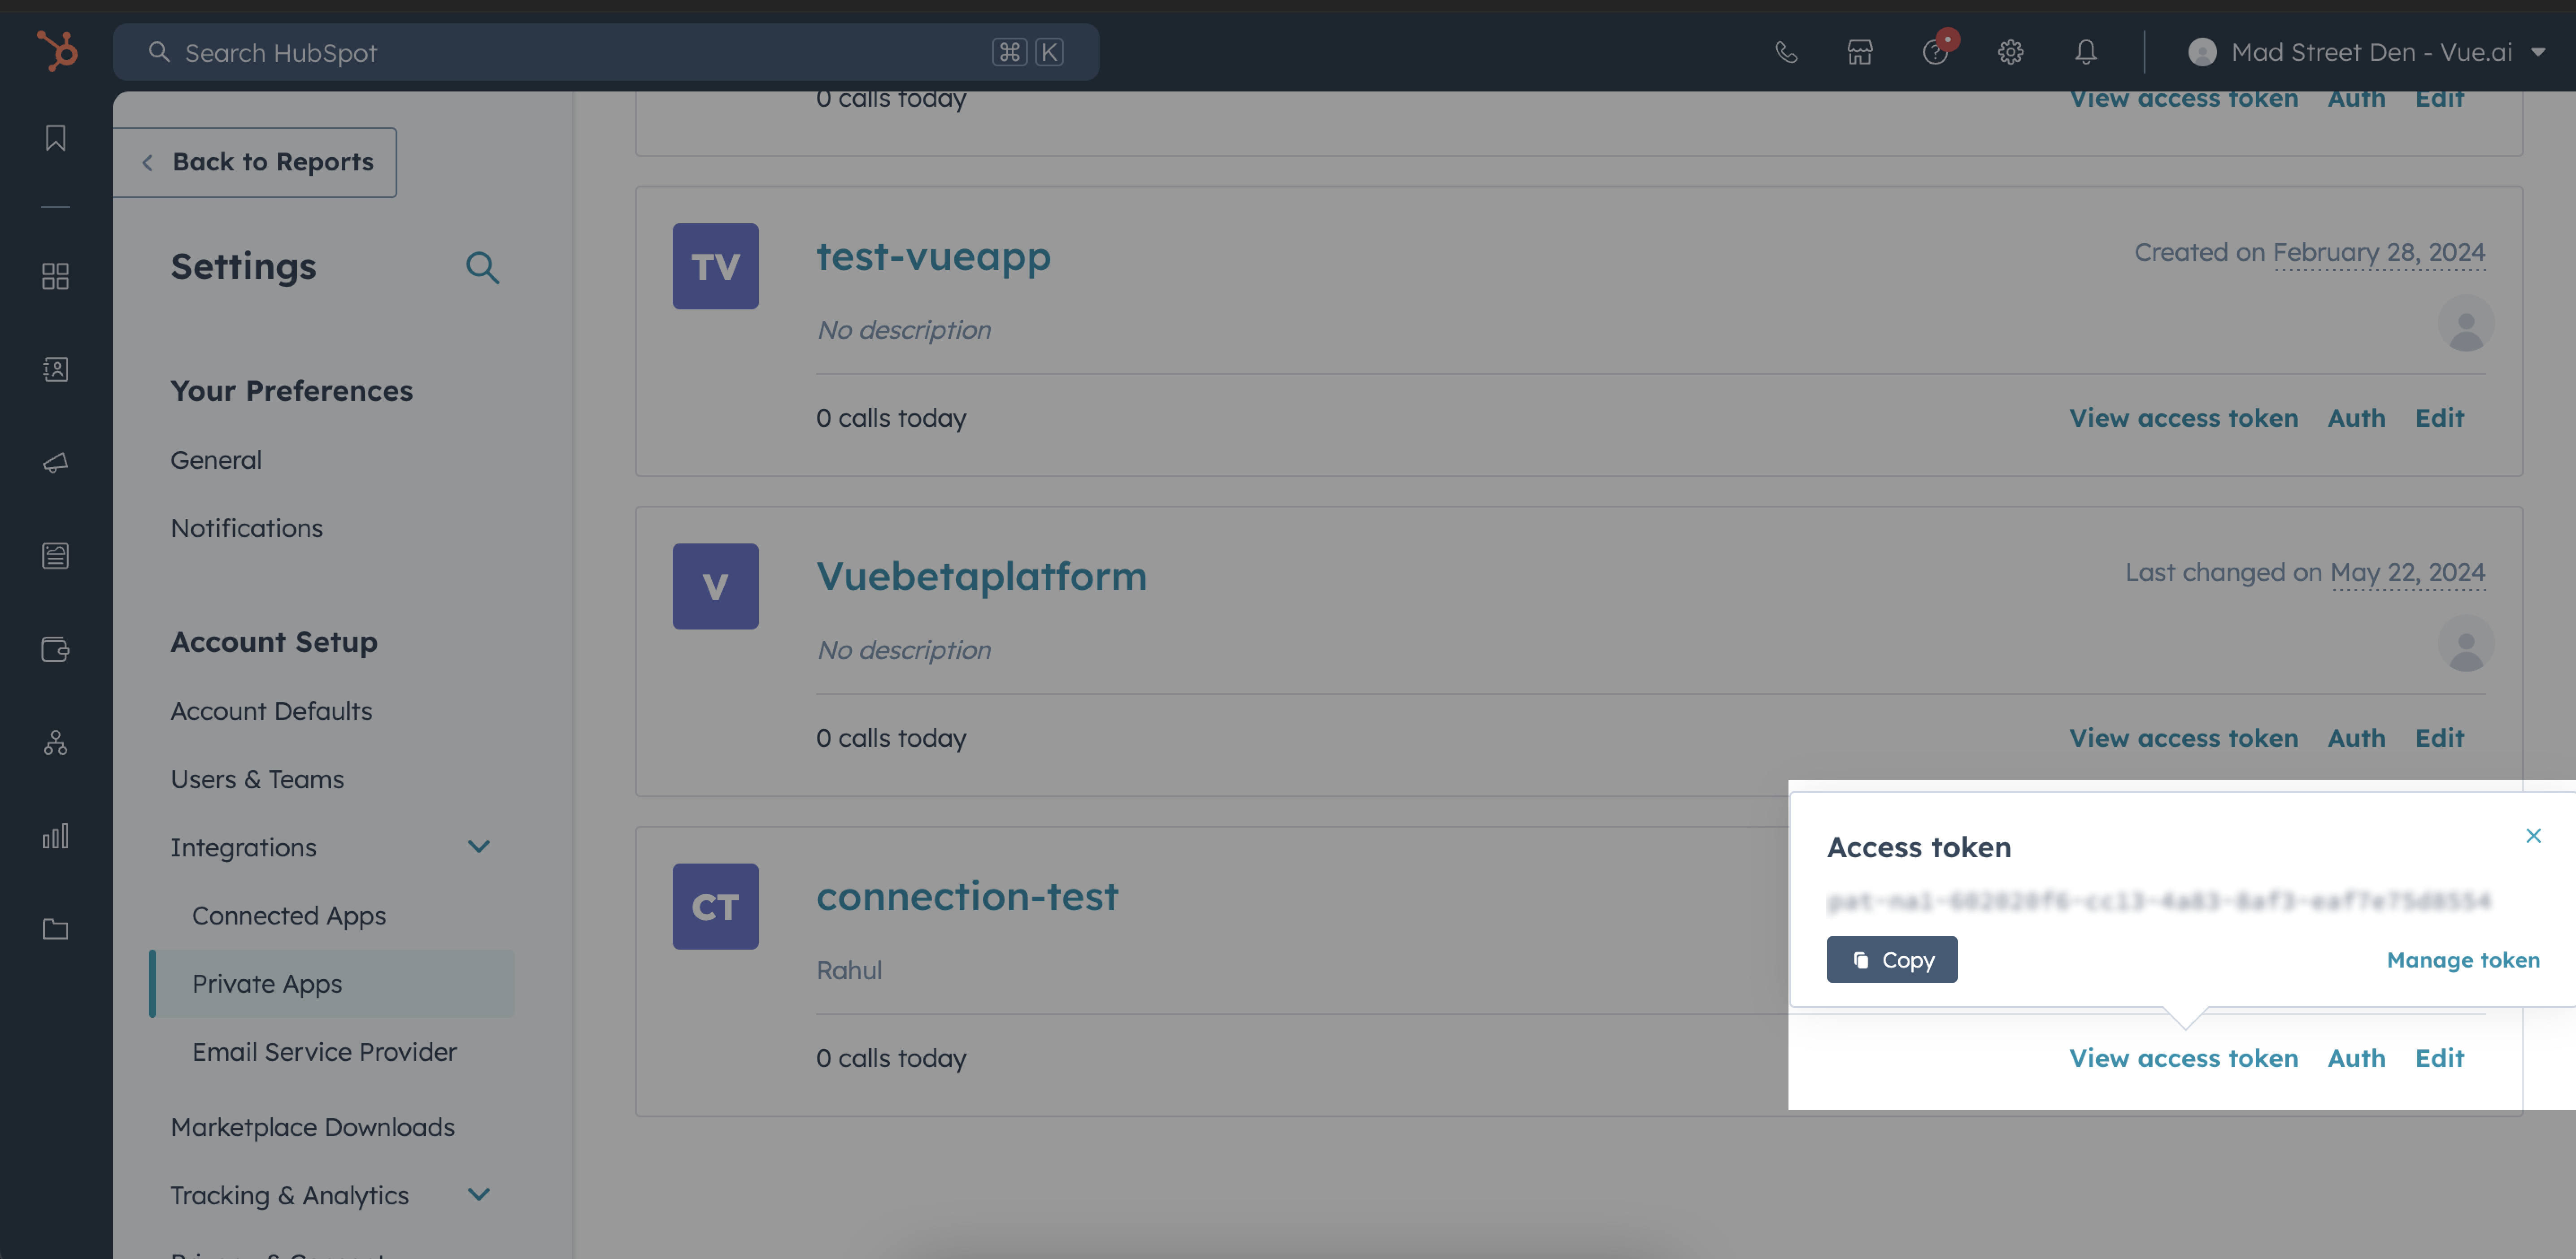
For more details, visit the HubSpot API Documentation.
Google Sheets Data Source Configuration
A comprehensive guide to configuring Google Sheets as a data source, covering prerequisites, authentication methods, configuration steps, and supported functionalities.
Prerequisites Before beginning, ensure the following prerequisites are met:
- A Google Cloud Project with the Google Sheets API enabled
- A service account key or OAuth credentials for authentication
- Access to the Google Sheet intended for integration
Ensure access to a Google Cloud Project with the Google Sheets API enabled, a service account key or OAuth credentials for authentication, and the Google Sheet intended for integration, before starting.
Overview
Google Sheets, due to its flexibility and ease of use, is a popular choice for data ingestion. The platform supports two authentication methods—Service Account Key and OAuth Authentication—allowing secure connection of spreadsheets to the data ingestion tool.
Configuration Steps
Prerequisites
- Enable the Google Sheets API for your project carefully
- Obtain a Service Account Key or OAuth credentials
- Ensure the spreadsheet permissions allow access to the service account or OAuth client
Choose Authentication Method
Service Account Key Authentication:
- Create a service account and grant appropriate roles (Viewer role recommended) in Google Cloud Console
If the spreadsheet is viewable by anyone with its link, no further action is needed. If not, give your Service Account access to your spreadsheet.
- Generate a JSON key by clicking on Add Key under Keys tab
- Grant the service account viewer access to the Google Sheet
OAuth Authentication:
- Create OAuth 2.0 Credentials by going to APIs & Services → Credentials
- Click Create Credentials → OAuth Client ID
- Configure the OAuth consent screen:
- Provide app name, support email, and authorized domains
- Select Application Type as Web application
- Add your application's Redirect URI
Generate Authorization URL
Use the following format:
https://accounts.google.com/o/oauth2/auth?
client_id={CLIENT_ID}&
response_type=code&
redirect_uri={REDIRECT_URI}&
scope=https://www.googleapis.com/auth/spreadsheets https://www.googleapis.com/auth/drive&
access_type=offline&
prompt=consent
Exchange Authorization Code
Make a POST request to:
https://oauth2.googleapis.com/token
The response will include:
{
"access_token": "ya29.a0AfH6SMCexample",
"expires_in": 3599,
"refresh_token": "1//0exampleRefreshToken",
"scope": "https://www.googleapis.com/auth/spreadsheets https://www.googleapis.com/auth/drive",
"token_type": "Bearer"
}
Configure Data Source
- Select Google Sheets as the source type
- Provide authentication details:
- For Service Account Key, paste the JSON key
- For OAuth, provide the Client ID, Client Secret, and Refresh Token
- Enter additional configuration details, such as the spreadsheet link and row batch size
Based on Google Sheets API limits documentation, it is possible to send up to 300 requests per minute, but each individual request has to be processed under 180 seconds, otherwise the request returns a timeout error. Consider network speed and number of columns of the Google Sheet when deciding a row_batch_size value. The default value is 200, but if the sheet exceeds 100,000 records, consider increasing the batch size.
Test Connection Verify integration by testing the connection. If the connection fails, recheck your credentials, API settings, and project permissions.
Additional Information
- Supported sync modes: Full Refresh (Overwrite and Append)
- Supported streams: Each sheet is synced as a separate stream, and each column is treated as a string field
API limits: Google Sheets API allows 300 requests per minute with a 180-second processing window per request. Adjust batch sizes accordingly.
PostgreSQL Data Source Configuration
Step-by-step instructions for configuring PostgreSQL as a data source with secure connections using SSL modes and SSH tunneling, and understanding advanced options like replication methods.
Prerequisites Before beginning, ensure the following details are available:
- Database Details: Host, Port, Database Name, Schema
- Authentication: Username and password
Ensure access to database details and authentication credentials before starting.
Overview
PostgreSQL, a robust and versatile relational database system, supports various integration methods for data sources. This guide explains essential configurations, optional security features, and advanced options such as replication and SSH tunneling.
Configuration Steps
Select PostgreSQL as the Source Type
Fill in the required details
- Host: Provide the database host
- Port: Specify the database port (default: 5432)
- Database Name: Name of the database to connect
- Schema: Schema in the database to use
- Username: Database username
- Password: Database password
Additional Security Configuration (Optional)
- SSL Mode: Choose from the available modes (e.g., require, verify-ca)
- SSH Tunnel Method: Select the preferred SSH connection method if required
Advanced Options (Optional) Replication Method: PostgreSQL supports two replication methods: Change Data Capture (CDC) and Standard (with User-Defined Cursor)
Change Data Capture (CDC):
- Uses logical replication of the Postgres Write-Ahead Log (WAL) to incrementally capture deletes using a replication plugin
- Recommended for:
- Recording deletions
- Large databases (500 GB or more)
- Tables with a primary key but no reasonable cursor field for incremental syncing
Standard (with User-Defined Cursor):
- Allows incremental syncing using a user-defined cursor field (e.g.,
updated_at)
- Allows incremental syncing using a user-defined cursor field (e.g.,
SSL Modes
PostgreSQL supports multiple SSL connection modes for enhanced security:
- disable: Disables encrypted communication between the source and Airbyte
- allow: Enables encrypted communication only when required by the source
- prefer: Allows unencrypted communication only when the source doesn't support encryption
- require: Always requires encryption. Note: The connection will fail if the source doesn't support encryption
- verify-ca: Always requires encryption and verifies that the source has a valid SSL certificate
- verify-full: Always requires encryption and verifies the identity of the source
SSH Tunnel Configuration (Optional)
To enhance connectivity, PostgreSQL supports SSH tunneling for secure database connections:
- No Tunnel: Direct connection to the database
- SSH Key Authentication: Use an RSA Private Key as your secret for establishing the SSH tunnel
- Password Authentication: Use a password as your secret for establishing the SSH tunnel
Supported Sync Methods
The PostgreSQL source connector supports the following sync methods:
| Mode | Description |
|---|---|
| Full Refresh | Fetches all data and overwrites the destination |
| Incremental | Fetches only new or updated data since the last sync |
Commonly used SSL modes are 'require' and 'verify-ca.' SSH tunneling is optional and typically used for enhanced security when direct database access is restricted.
Amazon Redshift Source Configuration
Step-by-step instructions for configuring Amazon Redshift as a data source, covering prerequisites, authentication methods, and configuration steps for seamless integration.
Prerequisites Before beginning, ensure the availability of the following:
- Host: The hostname of the Amazon Redshift cluster
- Port: The port number for the Amazon Redshift cluster (default is 5439)
- Database Name: The name of the Redshift database to connect to
- Schemas: The schemas in the specified database to access
- Username: The Redshift username for authentication
- Password: The Redshift password for authentication
Ensure access to the necessary prerequisites and authentication details for successful configuration.
Configuration Steps
Select Amazon Redshift as the Source Type
Provide Configuration Details
- Enter the hostname of the Redshift cluster in the Host field
- Enter the port number (default: 5439) in the Port field
- Enter the database name in the Database Name field
- List the schemas to access in the database in the Schemas field
- Enter the Redshift username in the Username field
- Enter the Redshift password in the Password field
Test the Connection Ensure that the credentials and configuration are correct
Ensure that network settings, such as firewalls or security groups, allow connections to the Redshift cluster.
Advanced Configuration Options
SSL Configuration
- SSL Mode: Choose between
disable,allow,prefer,require,verify-ca, orverify-full - Certificate: Upload SSL certificate if required by your Redshift cluster
Connection Pooling
- Pool Size: Configure connection pool size for optimal performance
- Timeout: Set connection timeout values
- Retry Policy: Configure retry attempts for failed connections
Schema Selection
- Include/Exclude: Use patterns to include or exclude specific schemas
- Wildcards: Support for wildcard patterns in schema selection
- Case Sensitivity: Configure case-sensitive schema matching
Supported Sync Modes
The Amazon Redshift source connector supports the following sync modes:
| Mode | Description |
|---|---|
| Full Refresh | Fetches all data and overwrites the destination |
| Incremental | Fetches only new or updated data since the last sync |
Amazon Redshift requires username and password authentication for connecting to the database. Ensure that the Redshift credentials have the necessary permissions to access the database and schemas.
Destinations Configuration
Redshift Destination Configuration
Step-by-step instructions for configuring Amazon Redshift as a destination with S3 staging for efficient data loading.
Prerequisites Before beginning, ensure the following are available:
- An active AWS account
- A Redshift cluster
- An S3 bucket for staging data
- Appropriate AWS credentials and permissions
Required Credentials include:
- Redshift Connection Details:
- Host
- Port
- Username
- Password
- Schema
- Database
- S3 Configuration:
- S3 Bucket Name
- S3 Bucket Region
- Access Key Id
- Secret Access Key
Redshift replicates data by first uploading to an S3 bucket and then issuing a COPY command, following Redshift's recommended best practices.
AWS Configuration
Set up Redshift Cluster
- Log into the AWS Management Console
- Navigate to the Redshift service
- Create and activate a Redshift cluster if needed
- Configure VPC settings if Airbyte exists in a separate VPC
Configure S3 Bucket
- Create a staging S3 bucket
- Ensure the bucket is in the same region as the Redshift cluster
- Set up appropriate bucket permissions
Permission Setup
Execute the following SQL statements for required permissions:
GRANT CREATE ON DATABASE database_name TO read_user;
GRANT usage, create on schema my_schema TO read_user;
GRANT SELECT ON TABLE SVV_TABLE_INFO TO read_user;
Supported Sync Methods
The Redshift destination connector supports the following sync methods:
| Mode | Description |
|---|---|
| Full Refresh | Fetches all data and overwrites the destination |
| Incremental - Append Sync | Fetches only new or updated data and appends it to the destination |
| Incremental - Append + Deduped | Fetches new or updated data, appends it to the destination, and removes duplicates |
Data Specifications Naming Conventions for Standard Identifiers require them to start with a letter/underscore, contain alphanumeric characters, have a length of 1-127 bytes, and contain no spaces or quotation marks. Delimited Identifiers are enclosed in double quotes, can contain special characters, and are case-insensitive.
Data Size Limitations include a maximum of 16MB for raw JSON records, a 65,535 bytes limit for VARCHAR fields, and handling of oversized records by nullifying values exceeding VARCHAR limits while preserving Primary Keys and cursor fields when possible.
PostgreSQL Destination Configuration
Step-by-step instructions for configuring Postgres as a destination with secure connections and performance optimization.
Prerequisites Before beginning, ensure the following are available:
- A PostgreSQL server version 9.5 or above
- Database details and authentication credentials
- Proper network access configuration
PostgreSQL, while an excellent relational database, is not a data warehouse. It should only be considered for small data volumes (less than 10GB) or for testing purposes. For larger data volumes, a data warehouse like BigQuery, Snowflake, or Redshift is recommended.
Database User Setup
A dedicated user should be created with the following command:
CREATE USER read_user WITH PASSWORD '<password>';
GRANT CREATE, TEMPORARY ON DATABASE <database> TO read_user;
The user needs permissions to:
- Create tables and write rows
- Create schemas
Configuration Steps
Provide Connection Details
- Host: Database server hostname
- Port: Database port (default: 5432)
- Database Name: Target database
- Username: Database username
- Password: Database password
- Default Schema Name: Schema(s) for table creation
Security Configuration (Optional)
- SSL Mode: Choose appropriate encryption level
- SSH Tunnel Method: Select if required
- JDBC URL Parameters: Add custom connection parameters
Data Type Mapping and Raw Tables Structure are provided. Each stream creates a raw table with specific columns. Final Tables Mapping, Supported Sync Modes, and Naming Conventions are also detailed.
Vue Data Catalog Destination Configuration
Step-by-step instructions for configuring Vue Data Catalog as a destination with multiple access modes and performance optimization.
Prerequisites Before beginning, ensure the following are available:
- Access to Enterprise AI Orchestration Platform | Vue.ai
- Necessary permissions to create and manage datasets
- Understanding of the data structure and volume
Dataset Creation Methods A dataset can be created through:
- Enterprise AI Orchestration Platform
- Datasets API
- Vue SDK
Configuration Steps
Choose Dataset Access Mode
- File-based (CSV, JSON, Parquet, Delta)
- Relational Database (PostgreSQL)
- Polyglot (combination of both)
Configure Storage Settings
- For file-based: S3 or Azure Container configuration
- For relational: PostgreSQL database details
- For polyglot: Both storage configurations
Set Performance Parameters
- Buffer Size
- CPU Limit
- Memory Limit
Configure Data Processing Options
- Writing mode (append, append-dedupe, overwrite)
- Schema handling preferences
- Data type mappings
Supported Datatypes For File Datasets (Delta)
| Input Datatype | Output Datatype |
|---|---|
| string | pyarrow string |
| integer | pyarrow int64 |
| number | pyarrow float64 |
| boolean | pyarrow bool_ |
| timestamp | pyarrow timestamp(nanosecond) |
Supported Datatypes For Relational Database
| Input Datatype | Output Datatype for PostgreSQL |
|---|---|
| string | BIGINTEGER |
| integer | INTEGER |
| float | DOUBLE PRECISION |
| bool | BOOLEAN |
| datetime | TIMESTAMP |
Document Manager
The Document Manager provides comprehensive capabilities for intelligent document processing (IDP), from defining document types and taxonomies to executing complex extraction workflows. It enables automated extraction and processing of structured and unstructured documents.
Key Capabilities:
- OCR Processing: Convert images and PDFs to machine-readable text
- Auto-Classification: Automatically identify document types
- Data Extraction: Extract specific fields and values from documents
- Review Workflow: Human-in-the-loop validation and correction
- Batch Processing: Handle large volumes of documents efficiently
Advanced Features:
- Live OCR: Annotate and extract data in real-time
- Auto-Classification Models: Identify the correct document type automatically
- Data Enrichment Techniques: Use methods like STP and matching to further enrich and organize extracted data
- One-Click Features: Utilize one-shot learning and zero-shot learning for high output accuracy
Core Functionalities:
- Document Type Management: Create & manage taxonomy and register new document types
- Document Processing: Upload documents, review extracted data, and annotate extracted data
- Performance Analytics: Analyze model performance and accuracy metrics based on provided feedback
Document Type
This guide will walk you through the step-by-step process of creating and registering a new Document Type. This is the foundational step for teaching the AI how to extract data from your specific documents.
Objective: To create a reusable template (Document Type) that can accurately extract data from a specific kind of document, such as a driver's license or an invoice.
Prerequisites:
- Access to Document Manager
- You must have at least one high-quality example image or PDF of the document you want to process.
Step 1: Navigate to the Document Type Manager
- From the main dashboard, hover over Data Hub in the top navigation bar.
- In the dropdown menu, under Document Manager, click on Document Type.
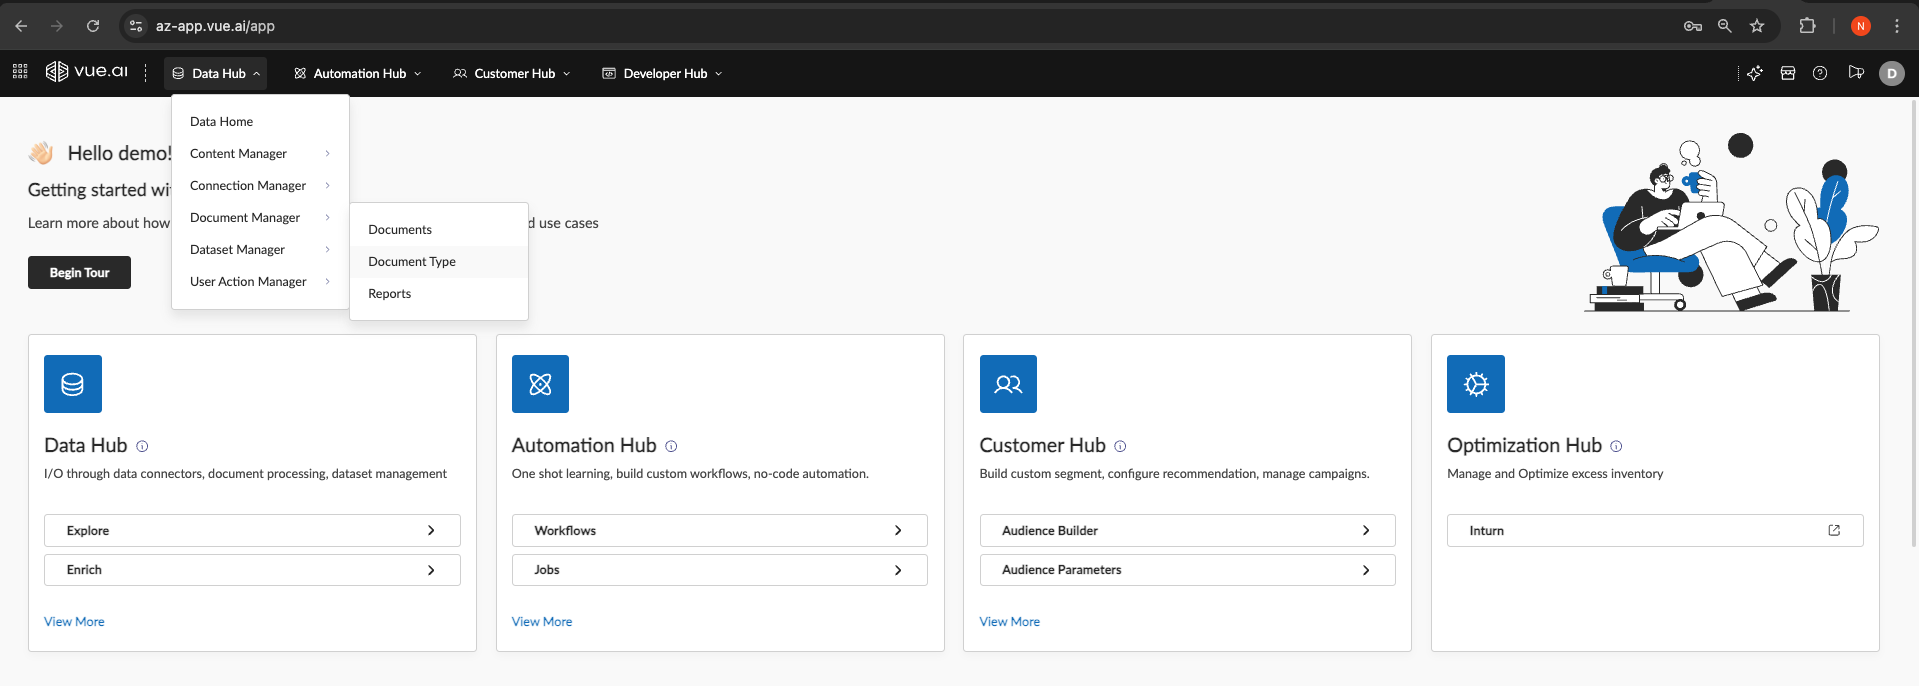
This will take you to the "All Document Type" page, which lists all existing document types in your account.
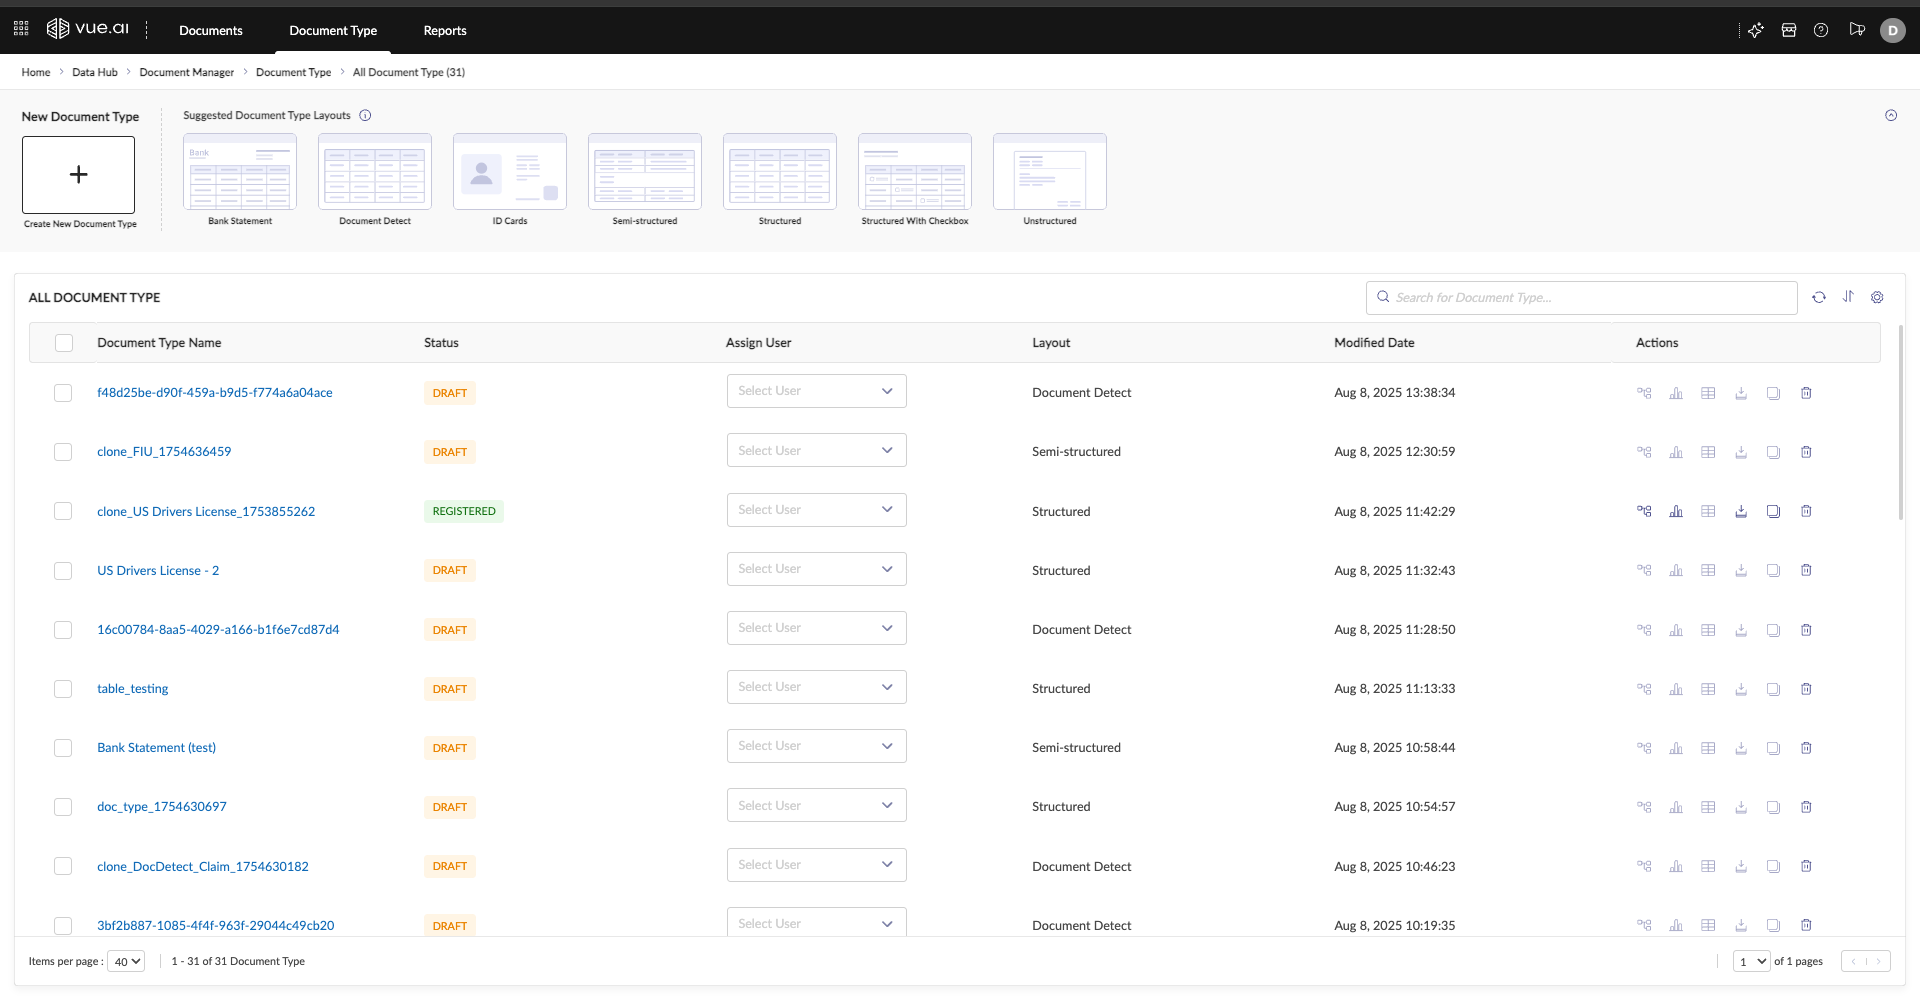
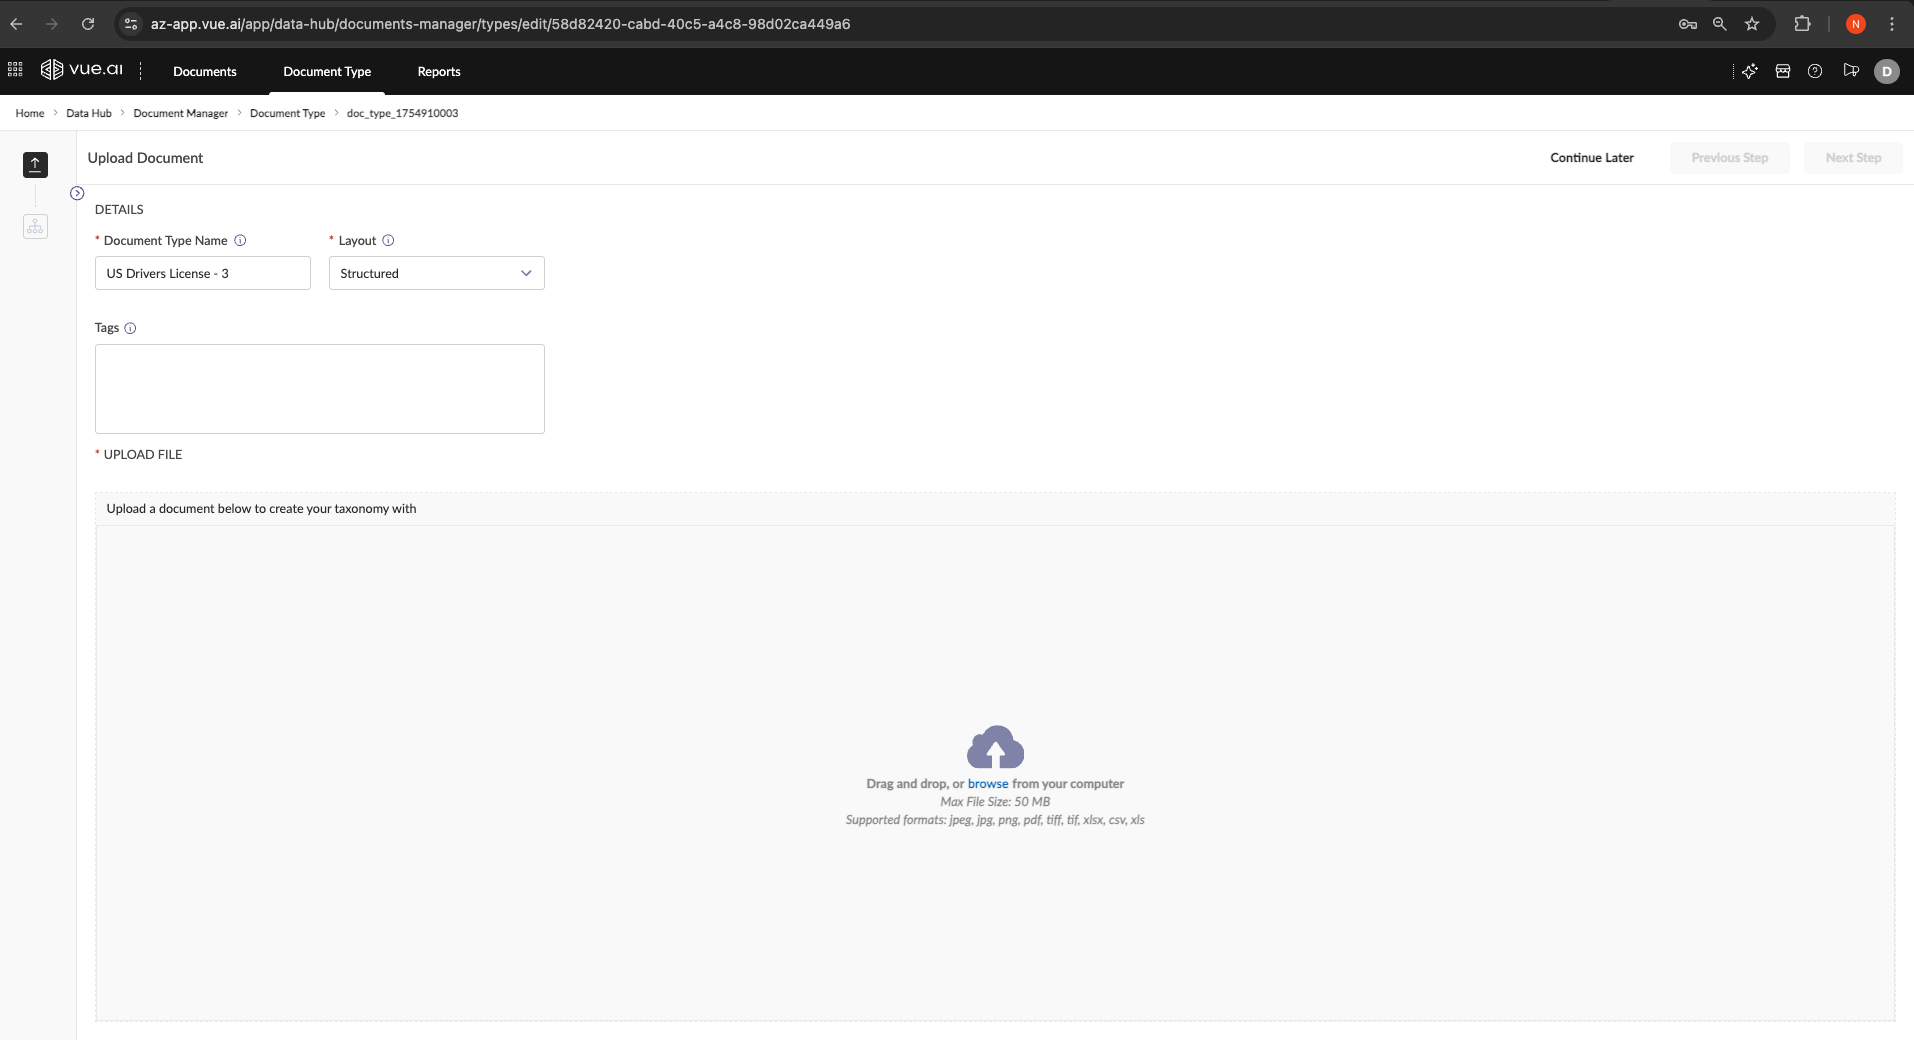
Step 2: Create and Configure the New Document Type
- Click the + Create New Document Type button.
- On the "Upload Document" screen, fill in the initial details:
- Document Type Name: Give your template a clear, unique name (e.g.,
US Drivers License - CA). - Layout: Select the layout that best describes your document (e.g.,
Structured). - Tags (Optional): Add any relevant tags for organization.
- Document Type Name: Give your template a clear, unique name (e.g.,
- In the "UPLOAD FILE" section, drag and drop your example document or click browse to upload it.
- Click Next Step.
Step 3: Review the Initial (0-Shot) Extraction
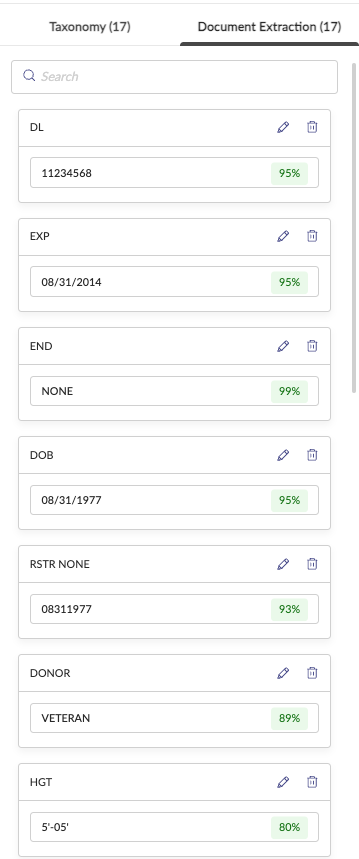
After uploading, you are taken to the annotation interface. The system automatically performs a 0-shot extraction—an initial attempt to identify and extract data without any prior training.
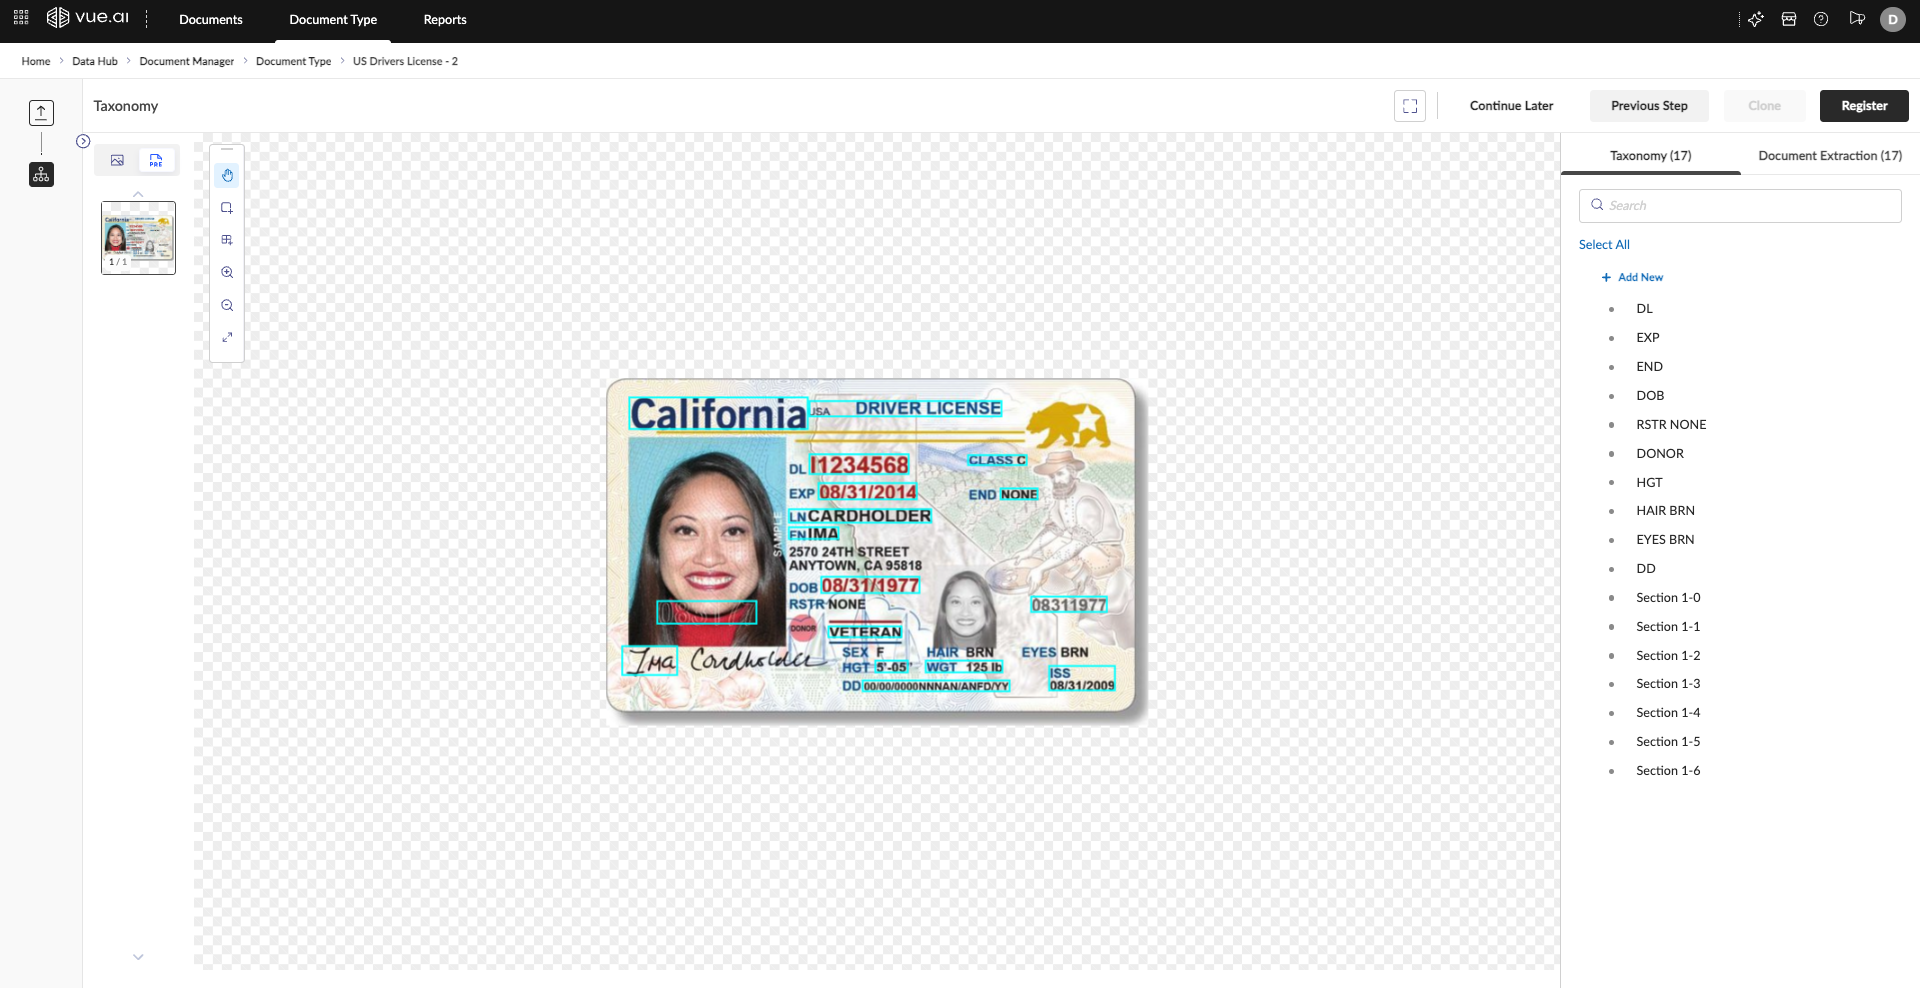
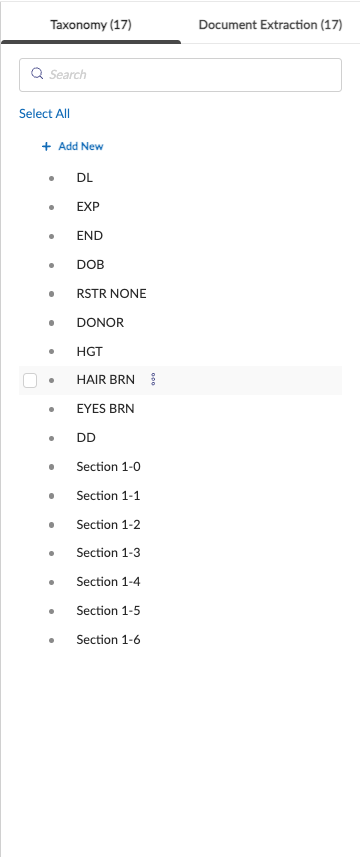
On the right, you'll see two tabs representing the 0-shot results:
| Taxonomy (The Field Names) | Document Extraction (The Field Values) |
|---|---|
The Taxonomy tab lists the names of the attributes the AI believes are present. This is your starting point for building the schema. | The Document Extraction tab shows the actual data extracted for each attribute, along with a confidence score. |
 |  |
Your goal is to refine this initial result into a perfect, reusable taxonomy.
Step 4: Refine the Taxonomy
Now, you will edit, add, or delete attributes to match your exact requirements.
Editing Standard Attributes
For each attribute you want to keep or modify:
- Click on the attribute in the list. The configuration panel will open on the right.
- Define its properties:
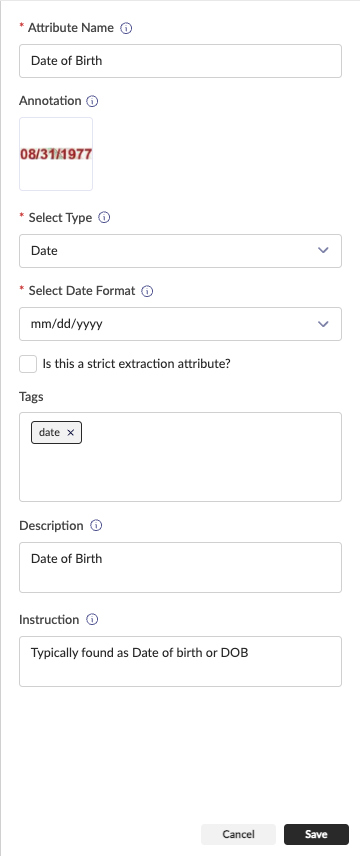
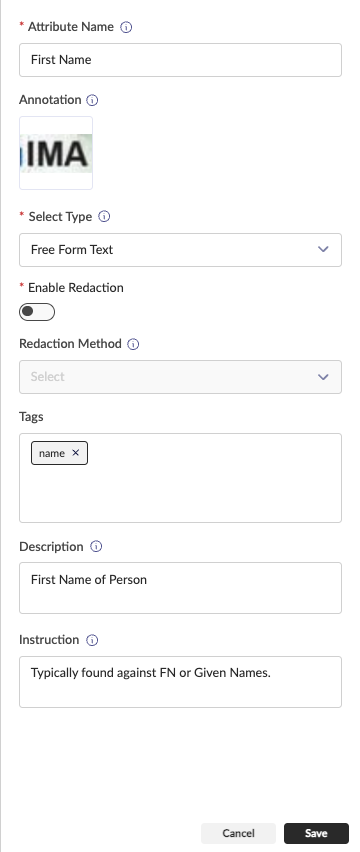
- Attribute Name: Change the raw name (e.g.,
DOB) to a user-friendly one (e.g.,Date of Birth). - Annotation: Adjust the bounding box on the document image if it's incorrect.
- Select Type: Choose the correct data type (e.g.,
Date,Free Form Text). This is critical for validation and formatting. - Description / Instruction: Add context for the model and human reviewers.
- Attribute Name: Change the raw name (e.g.,
- Click Save.
Editing a Date attribute | Editing a Free Form Text attribute |
|---|---|
 |  |
Configuring Table Attributes
If your document contains a table, the process is more detailed:
When you create or edit a
Tableattribute, first define its approximateColumnsandRowsin the right-hand panel. Then draw a bounding box around the entire table.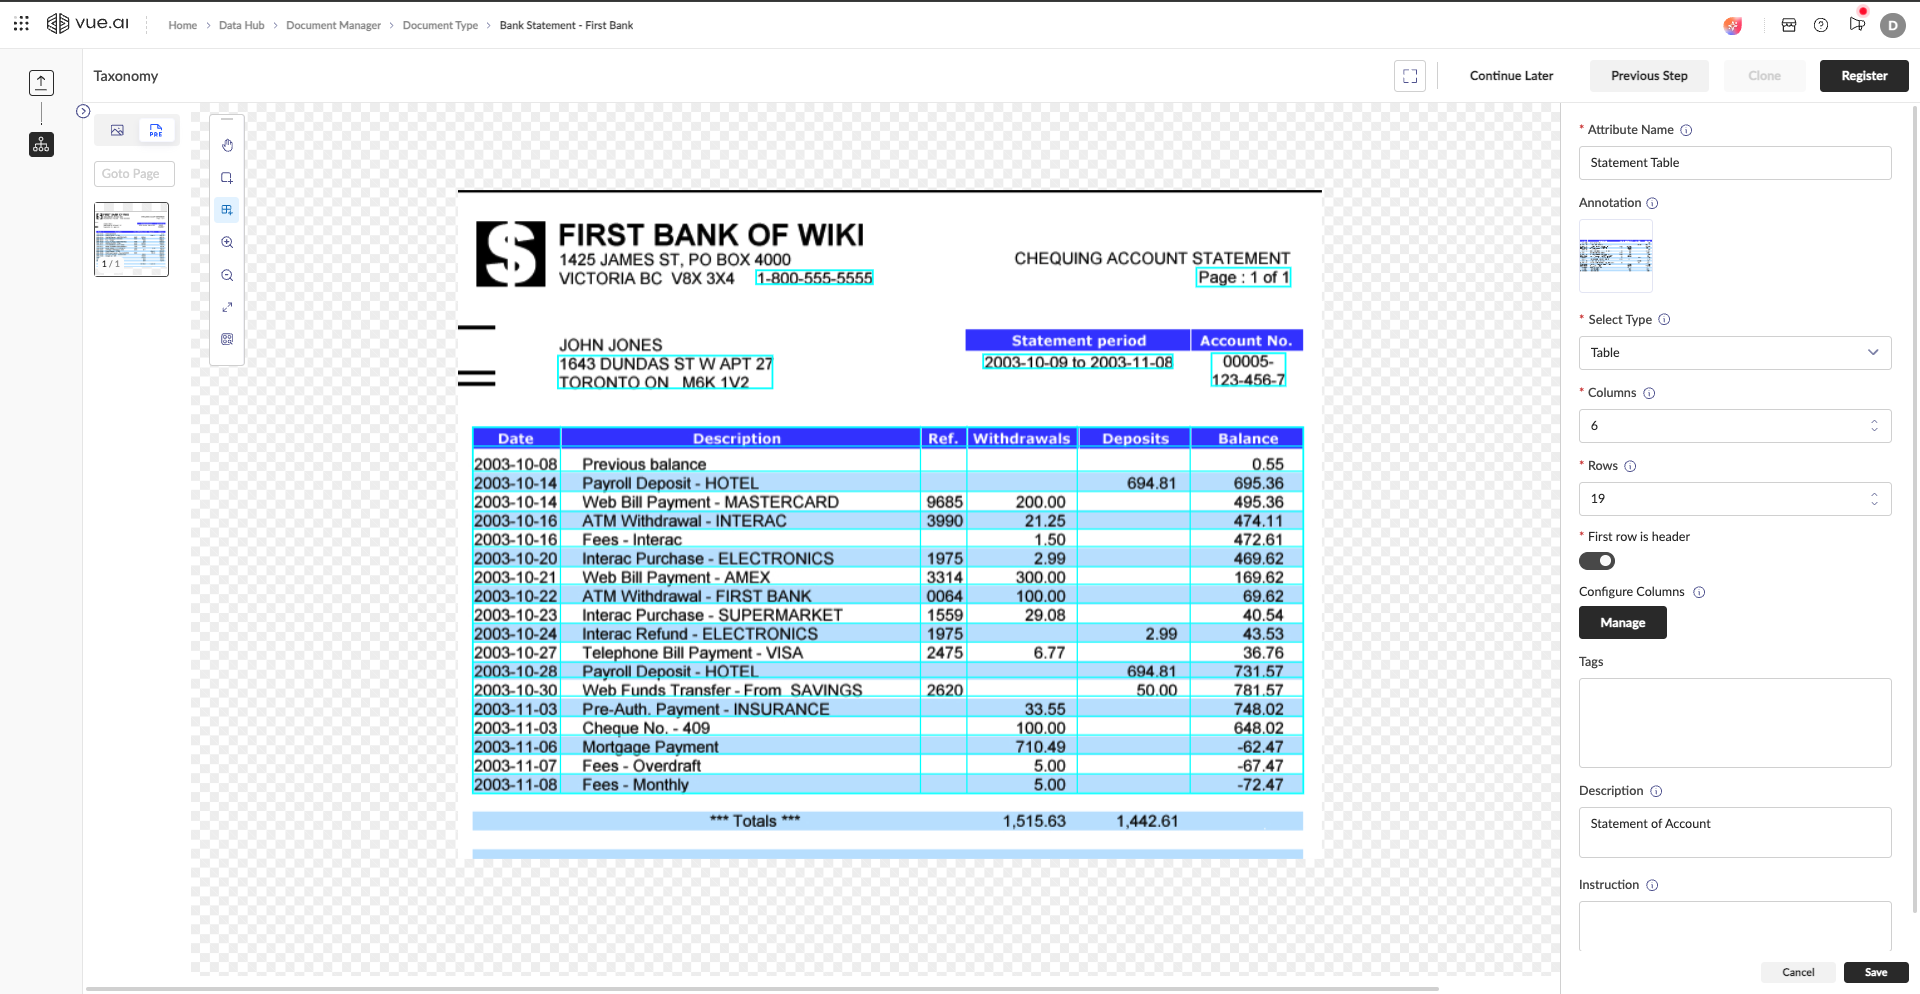
Click the Manage button under "Configure Columns" to define the table's internal schema.
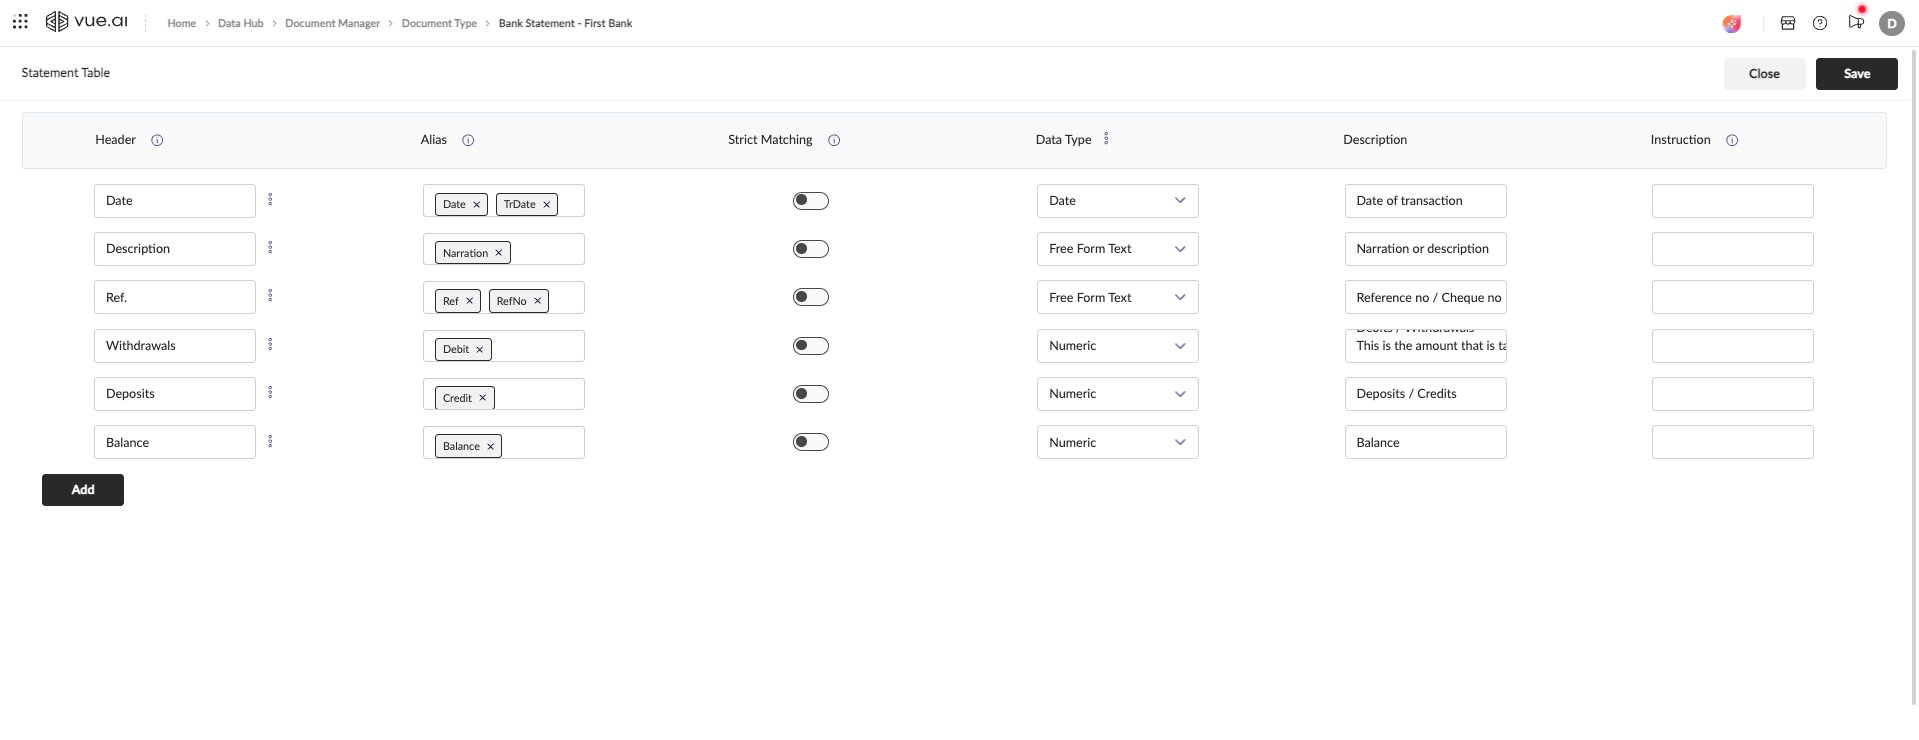
In this view, you can define each column's
Header,Alias,Data Type, and more. This creates a standardized output for your table data.
Step 5: Verify the Final Taxonomy and Extraction
Once you have configured all your attributes, perform a final review.
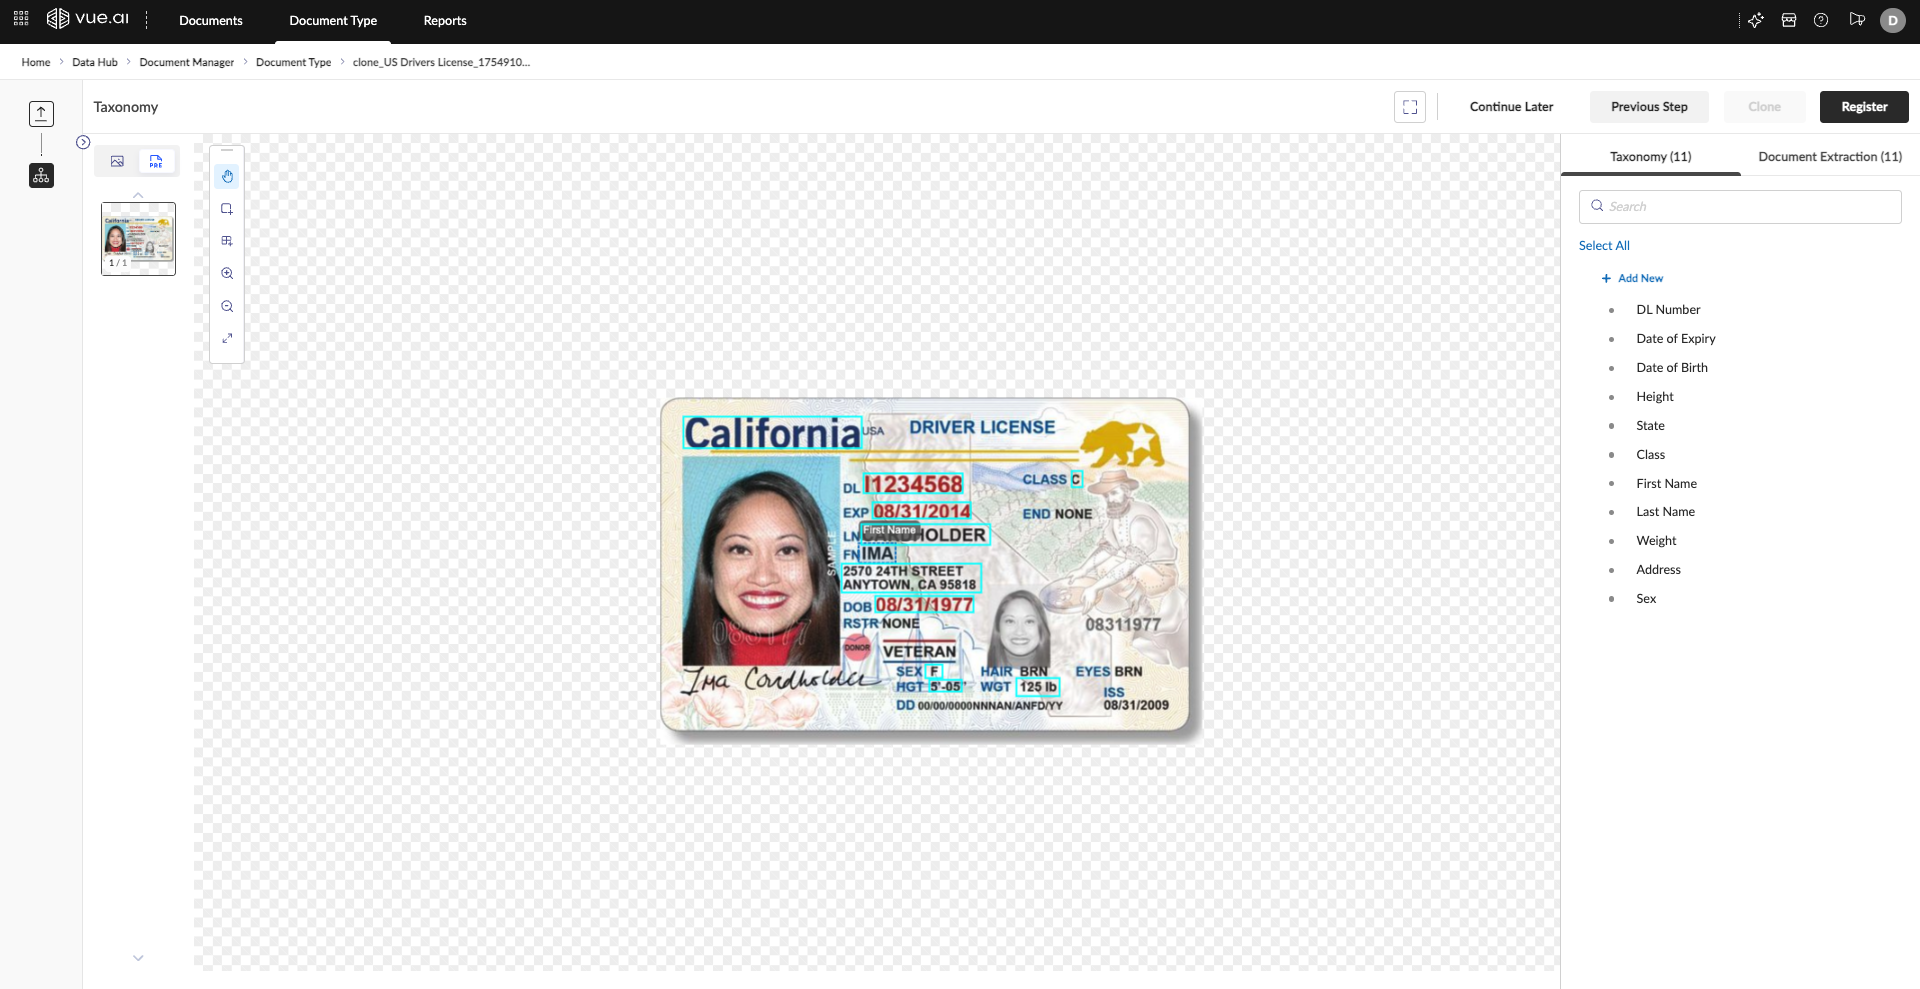
Switch to the Taxonomy tab. It should now show your clean, finalized list of attribute names.
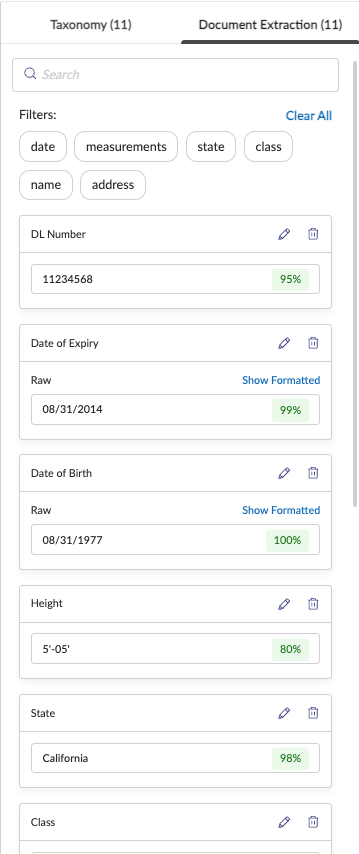
Switch to the Document Extraction tab. This view shows the extracted values based on your refined taxonomy. Check that the values are correct and properly formatted. Note the use of tags (
date,name, etc.) for filtering.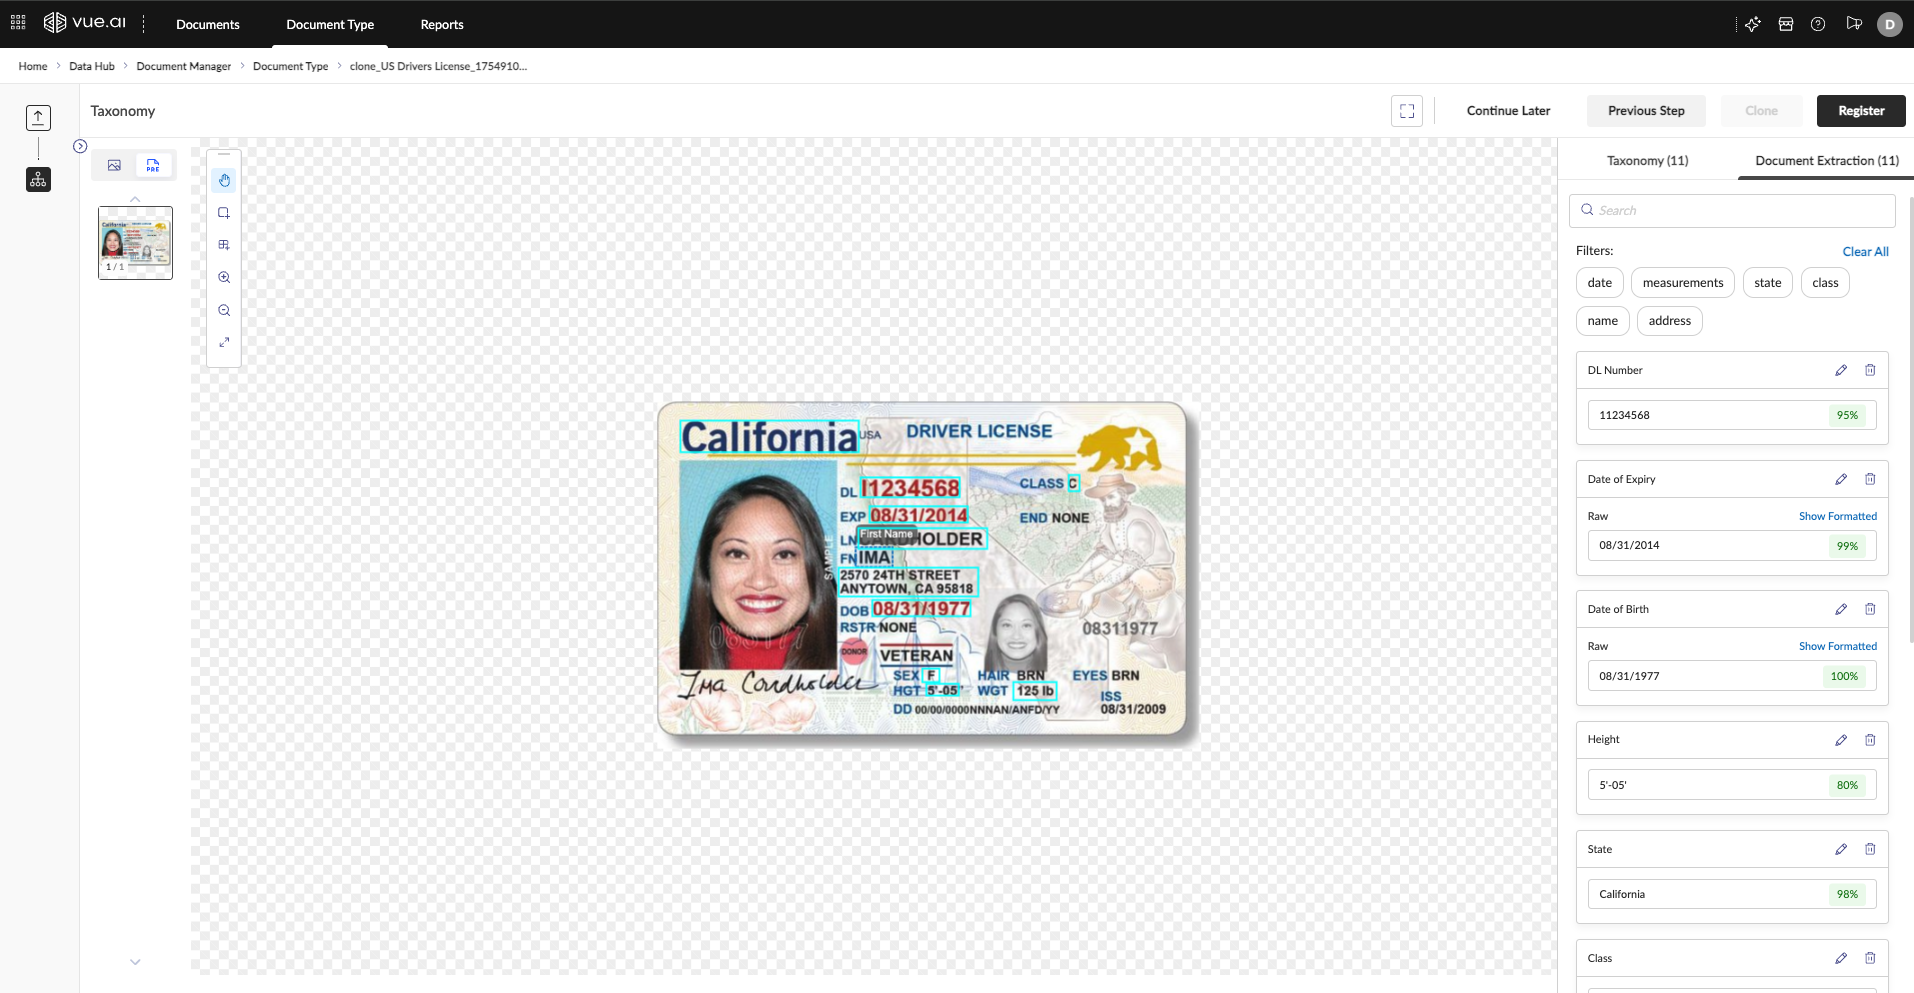
Step 6: Register the Document Type
When you are fully satisfied with the taxonomy and the extraction results, you are ready to finalize the Document Type.
- Click the Register button in the top-right corner of the page.
- The status of your Document Type will change from
DrafttoRegistered.
Congratulations! Your Document Type is now a live, reusable model that can be used to automatically process new documents of the same kind.
Document Extraction
This guide provides step-by-step instructions for uploading, processing, and reviewing documents using the platform's user interface.
Step 1: Navigate the Documents Hub
The Documents Hub is your central dashboard for all processed documents. You can access it from Data Hub > Document Manager > Documents.
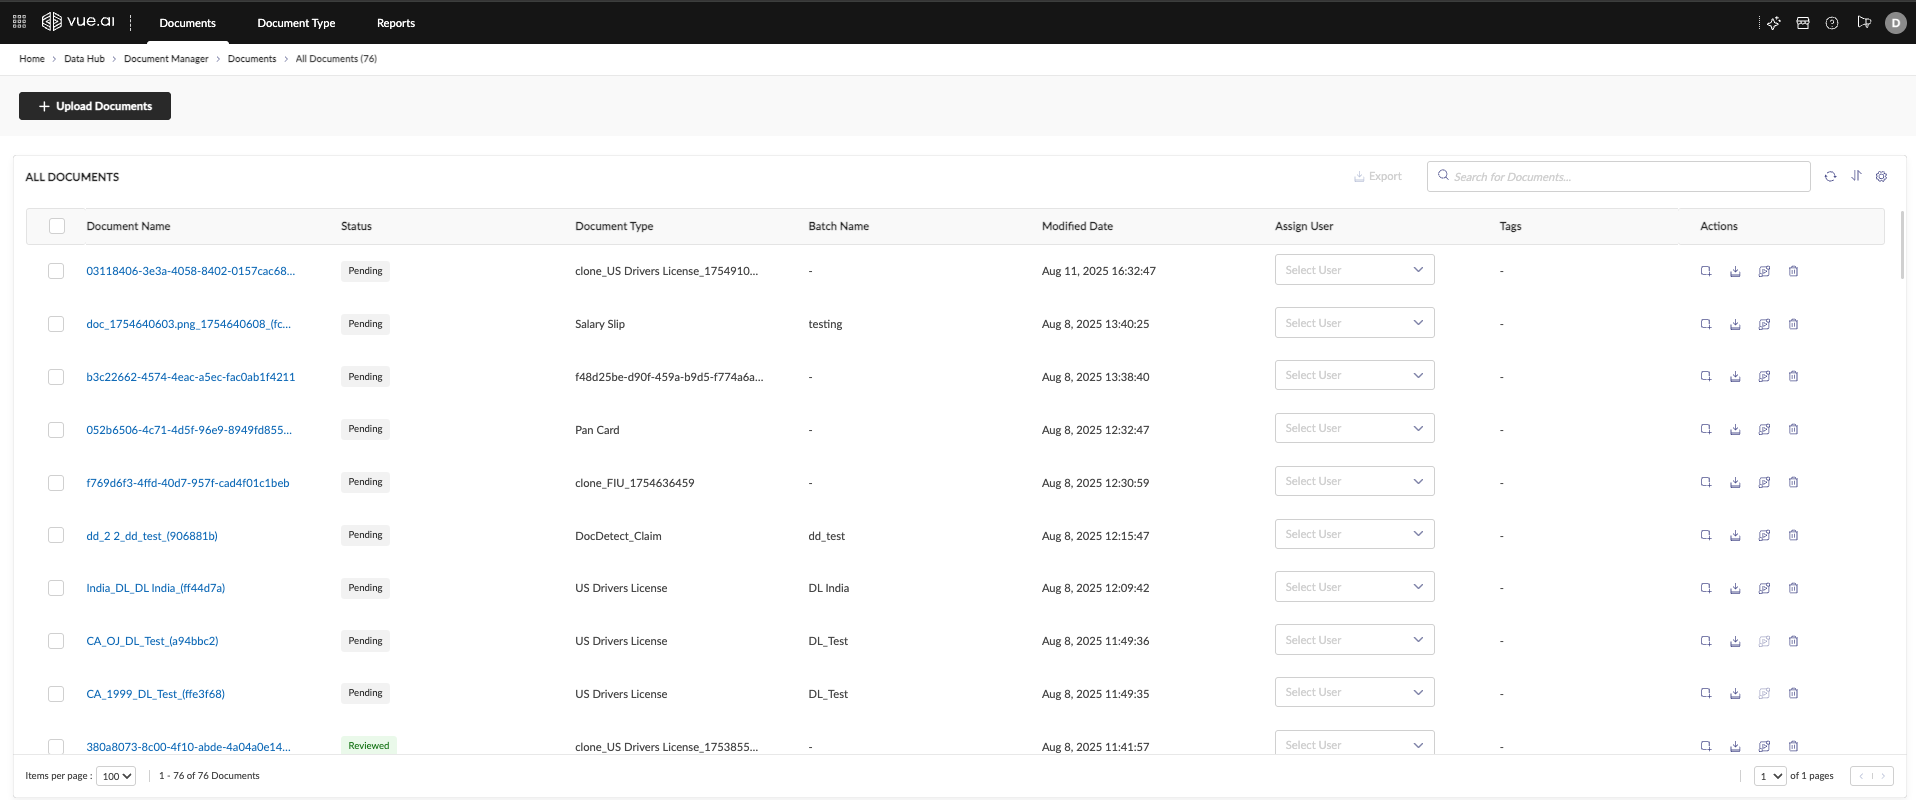
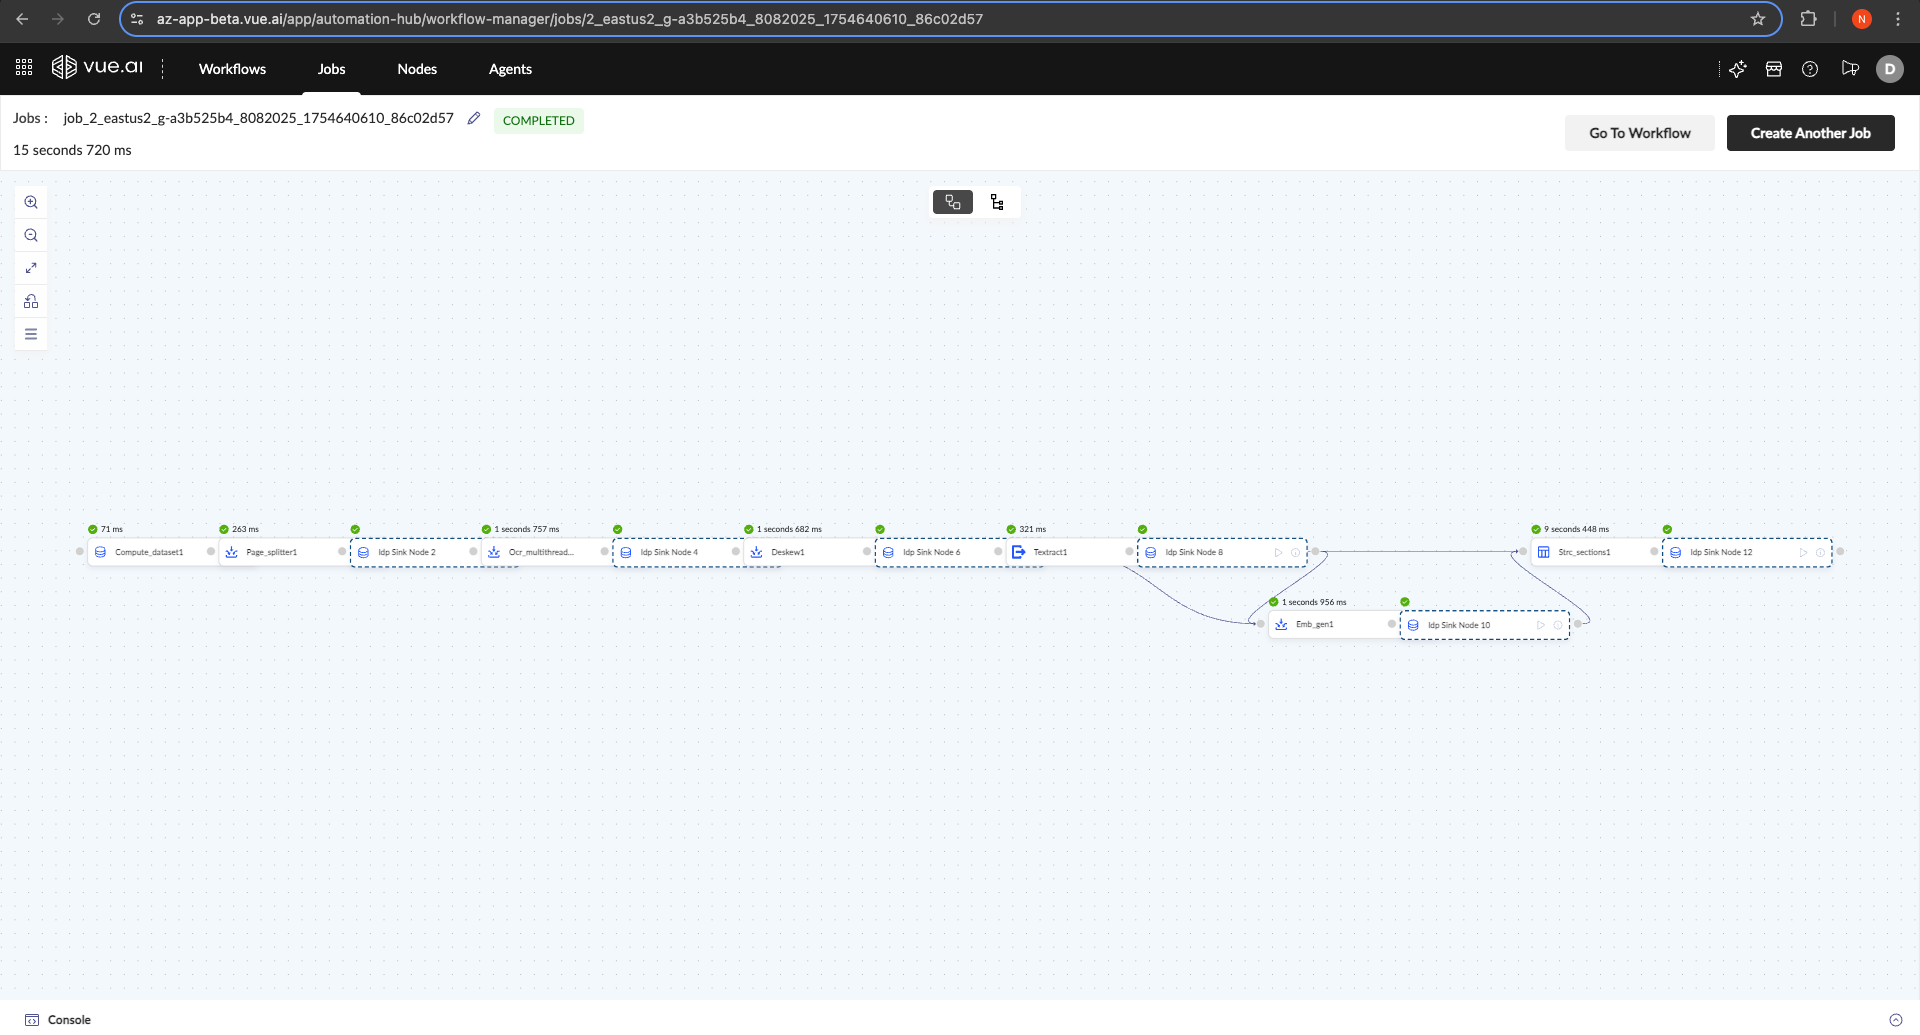
From here, you can search, filter, assign documents for review, and access key actions like Annotate or View Job. The "View Job" action takes you to the Automation Hub to see the specific workflow run for that document.
Step 2: Upload New Documents
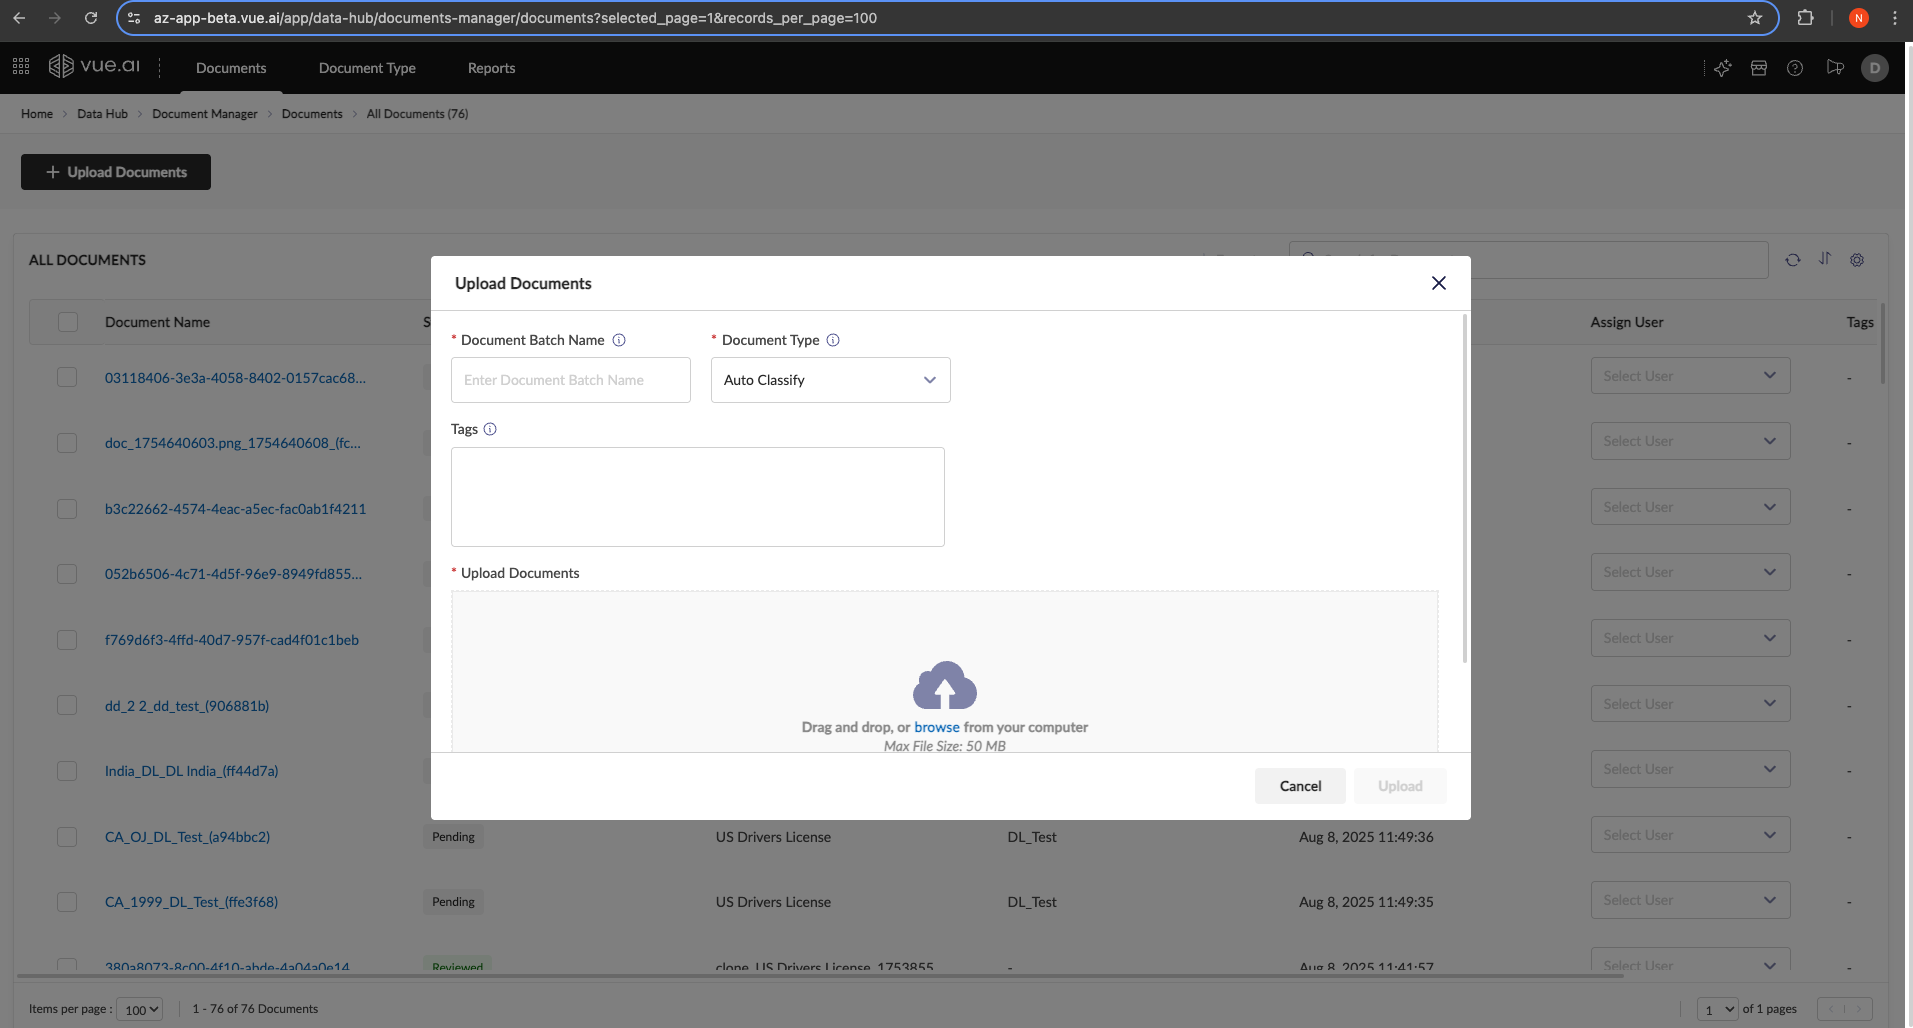
- Click the + Upload Documents button to open the upload modal.
- Provide a Document Batch Name and optional Tags for organization.
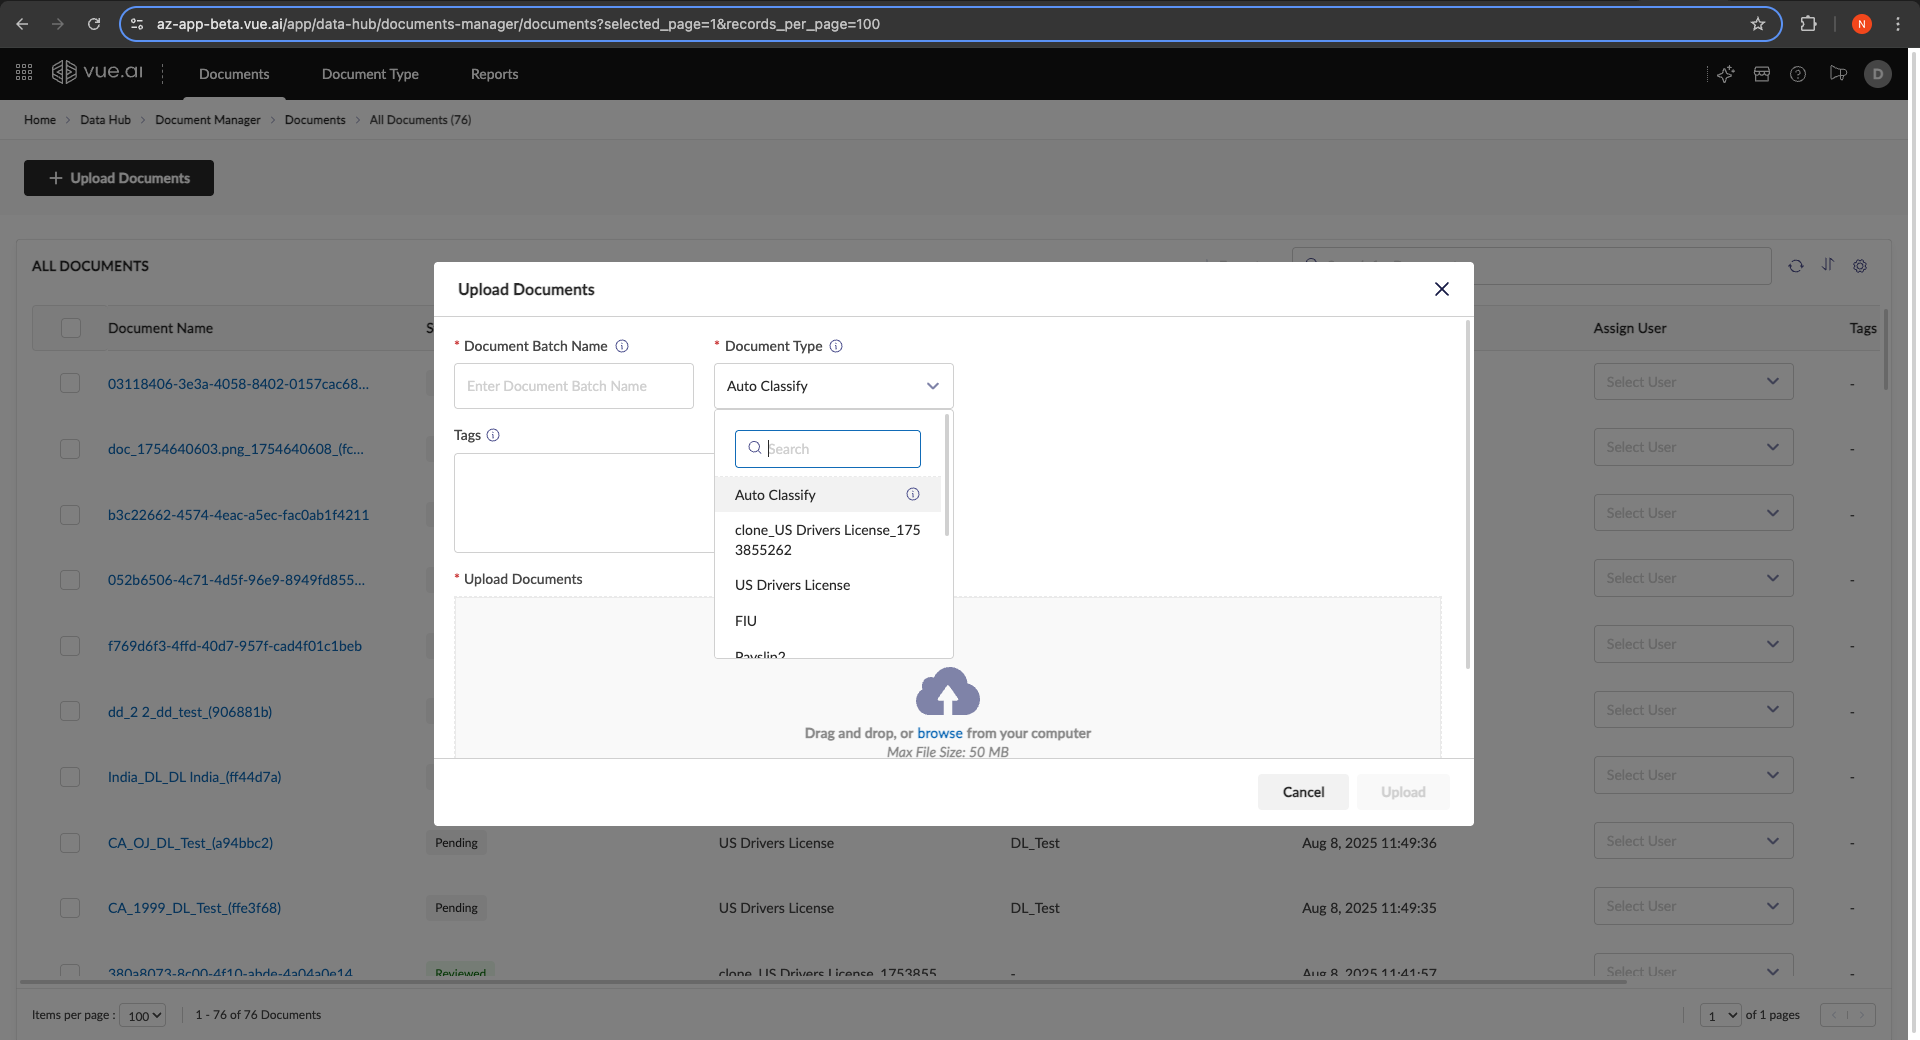
- Choose a Document Type:
- Select a specific type if all documents are the same.
- Choose Auto Classify to let the system identify the type for each document automatically.
- Drag and drop your files or browse to upload.
Step 3: Review and Annotate Extraction Results
After processing, click the Annotate action for a document to open the review interface. This screen is divided into three panels for an efficient workflow.
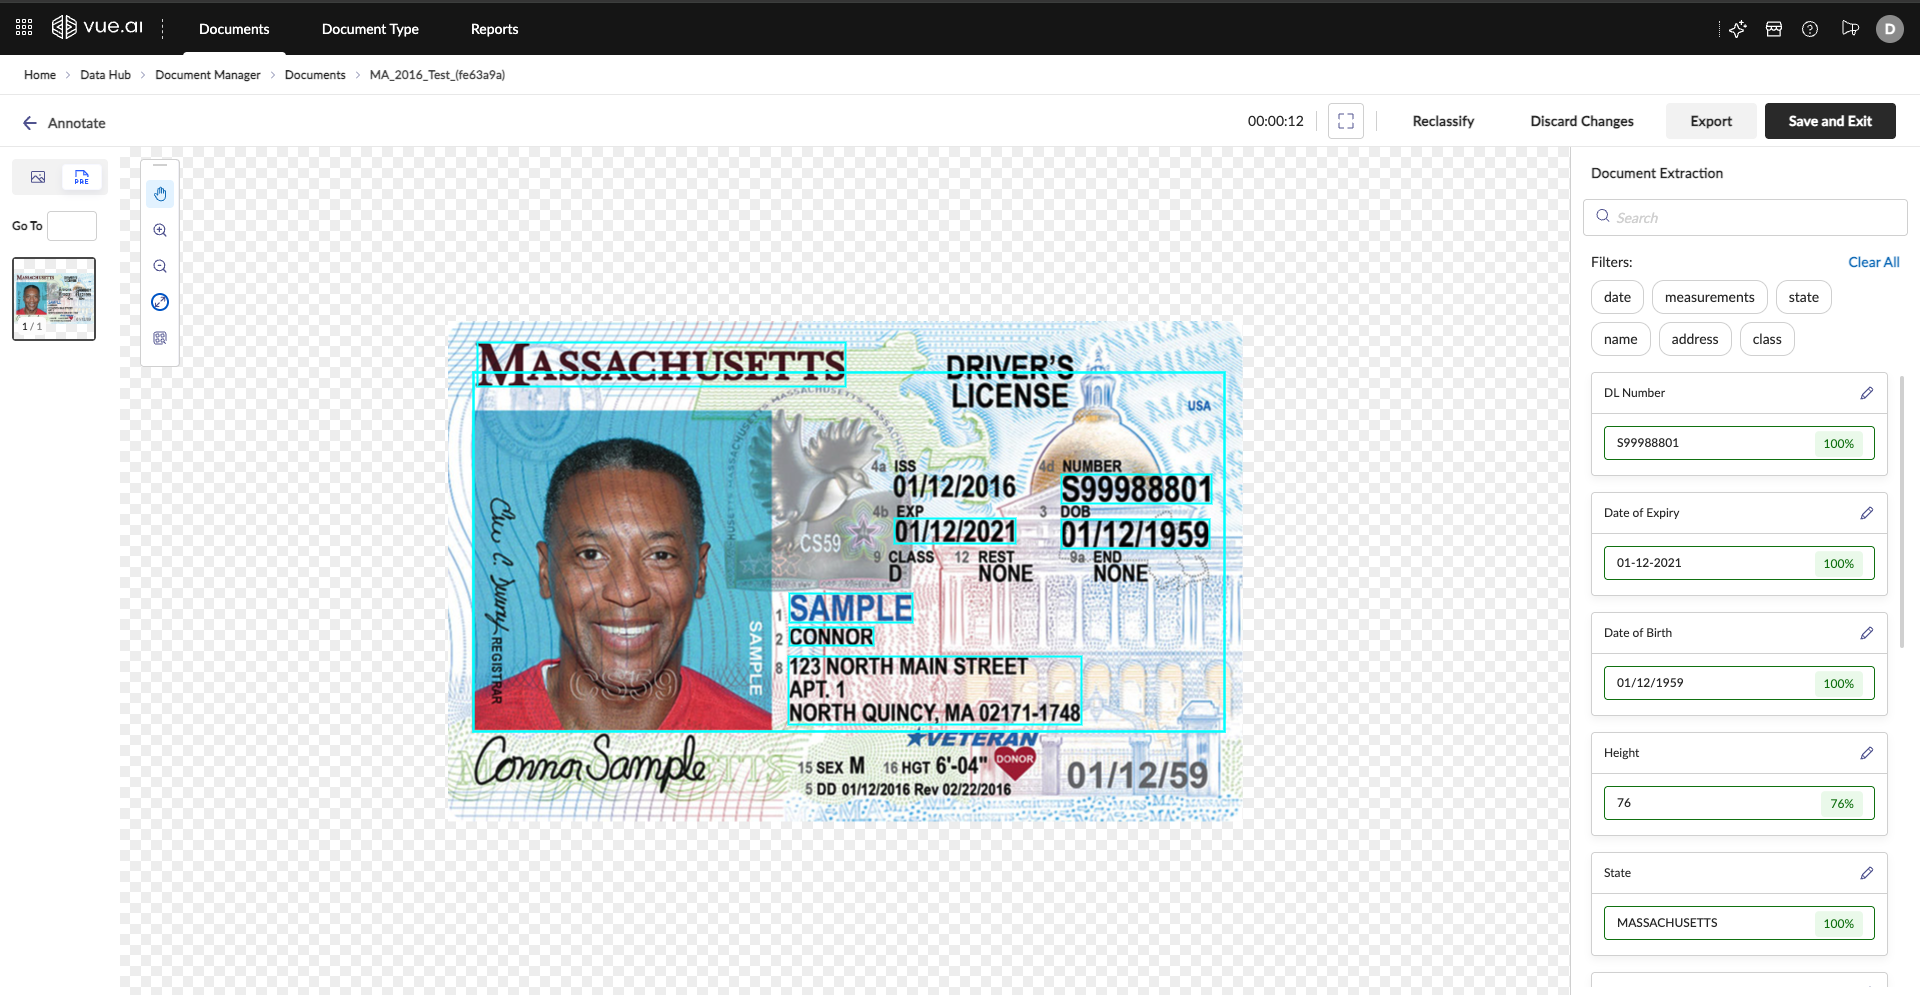
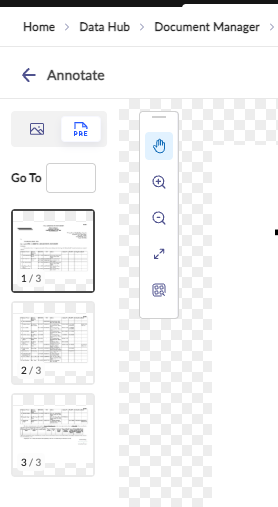
- Left Panel (Navigator): Click page thumbnails to jump between pages.
- Center Panel (Viewer): Interact with the document image and its bounding boxes.
- Right Panel (Results): View and edit the extracted data.
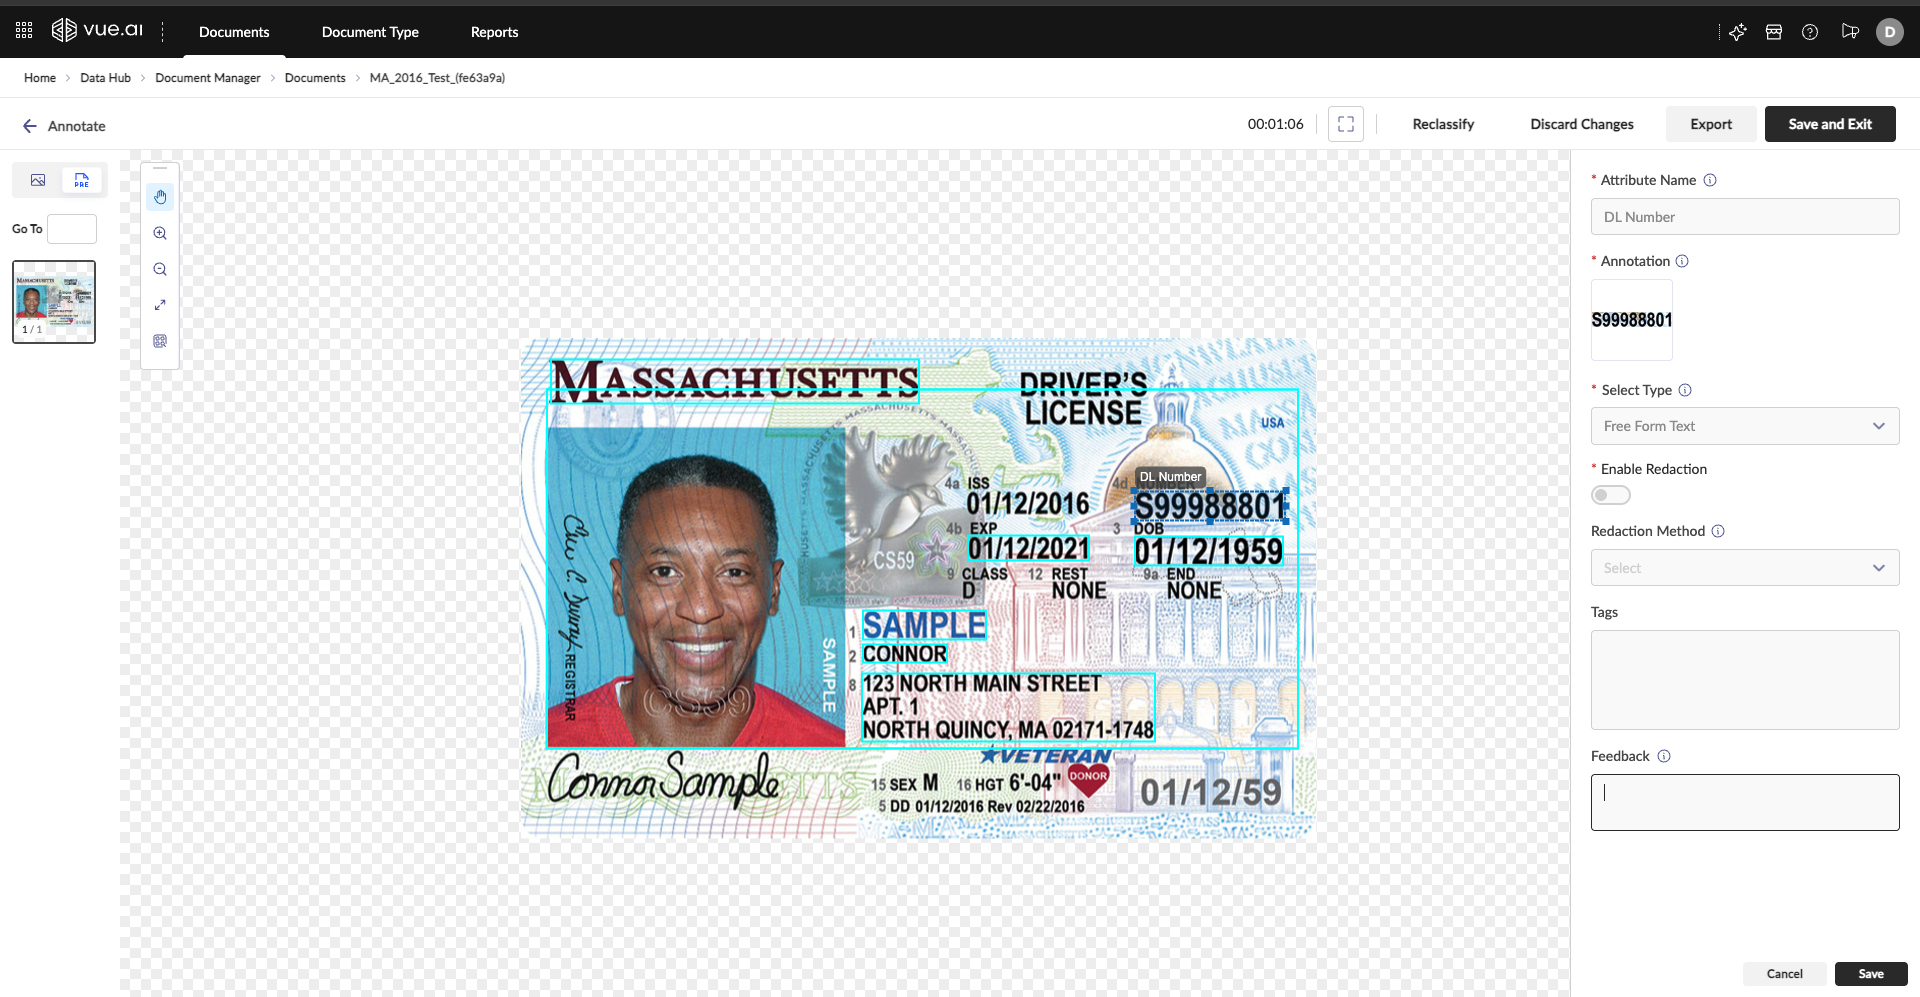
Correcting Data
If an extracted value is incorrect:
- Click the attribute in the right panel to open the edit view.
- You can edit the text directly, re-draw the bounding box on the document, or provide natural language feedback to the model.
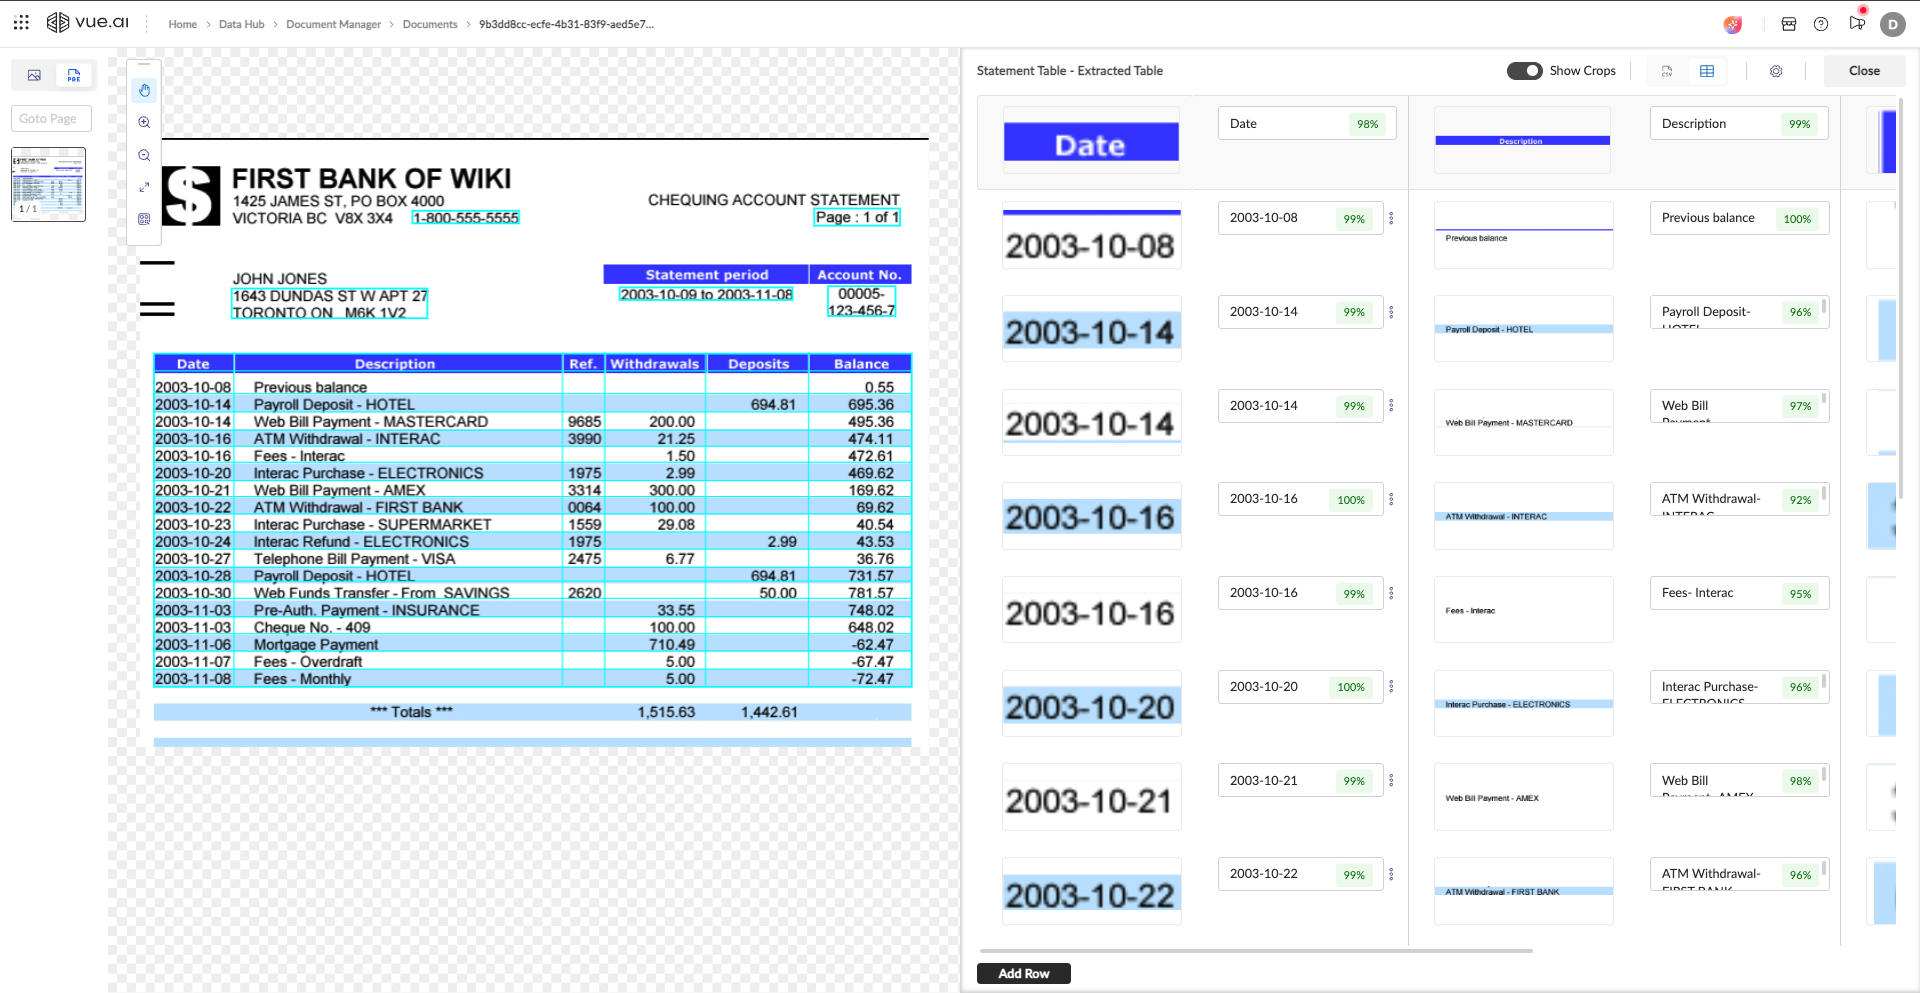
Step 4: Reviewing Extracted Tables
Table data has a specialized review interface.
Merged View: For tables spanning multiple pages, the system presents a single merged table first, which you can expand to see the tables from individual pages.
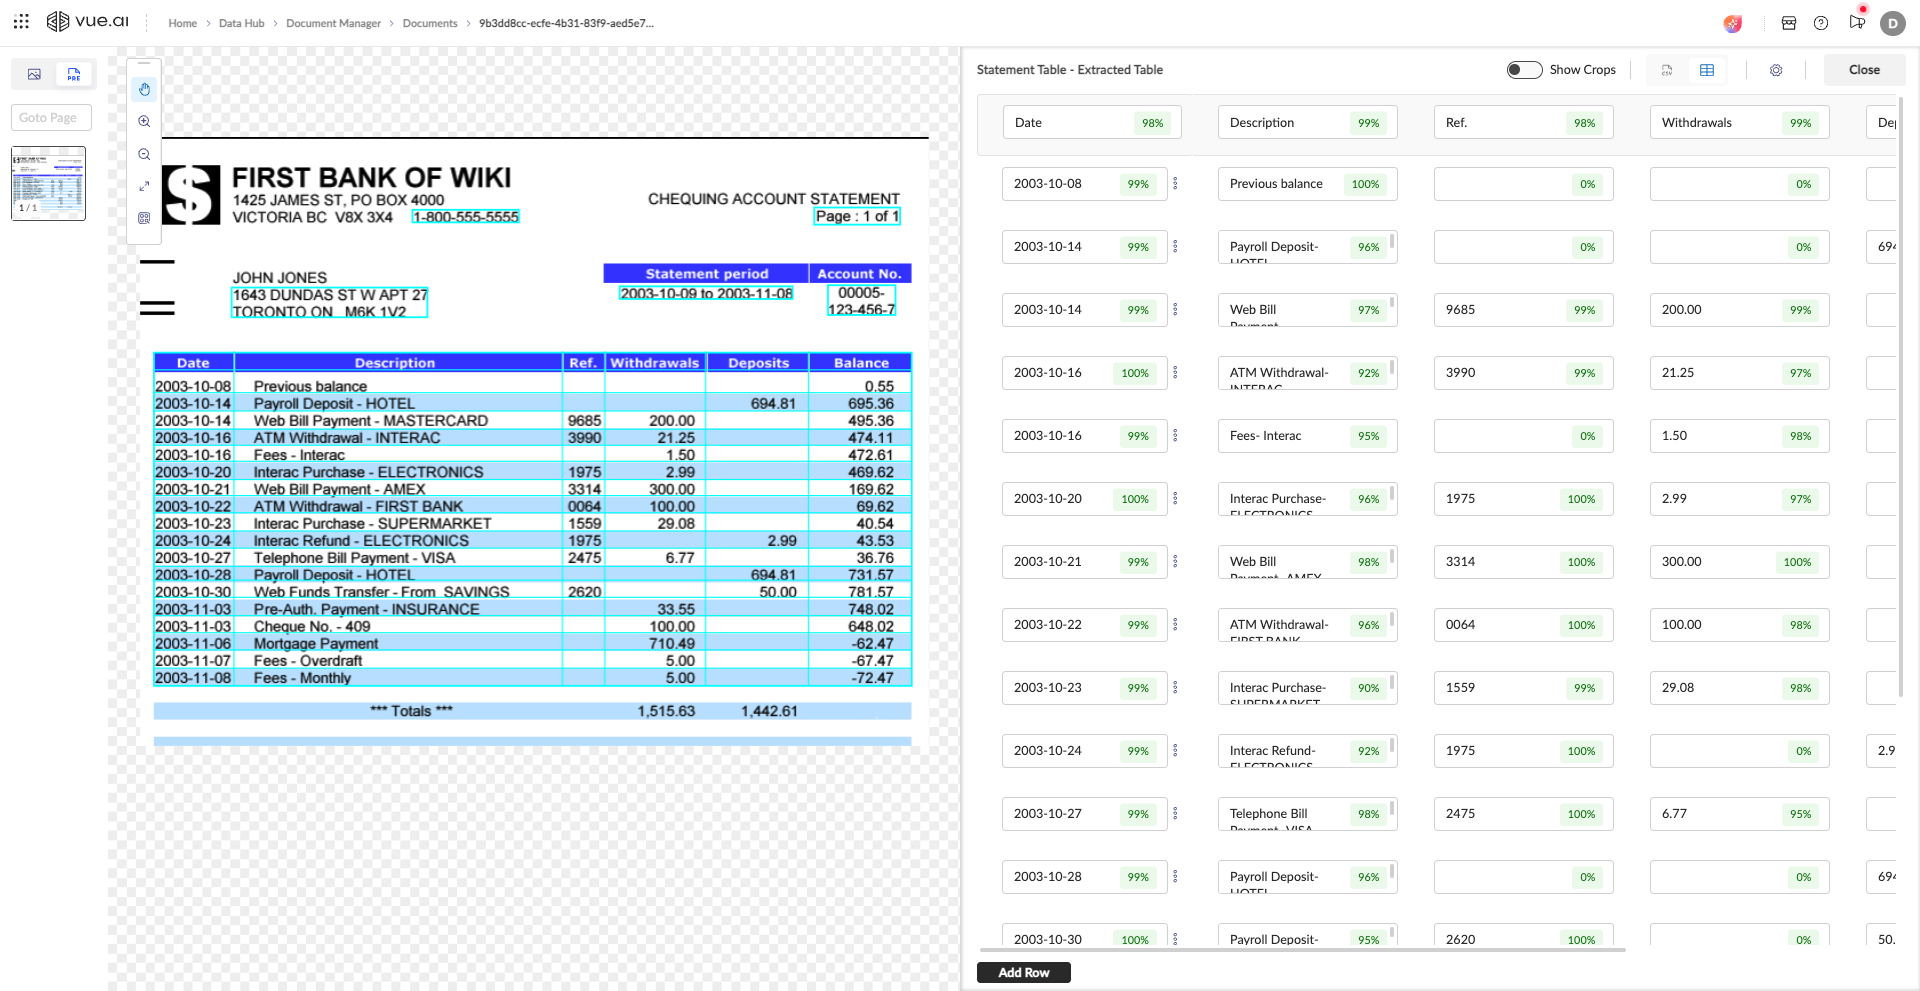
Review Views: You can switch between two views:
- Spreadsheet View: A clean grid for easy scanning and editing. You can sort, filter, and even perform quick calculations like summing selected cells.
- Cell View ("Show Crops"): Displays the actual image snippet for each cell, perfect for verifying difficult-to-read characters.
| Spreadsheet View (with Column Management) | Cell View (Visual Crops) |
|---|---|
 |  |
Step 5: Finalize the Review
Once all corrections are made, click Save and Exit. The document's status will update to Reviewed, and your corrections will be used to improve the model over time.
Folio
Welcome to your comprehensive user guide for Folio processing and review.
This guide will walk you through the step-by-step process of processing, and reviewing a new Folio, so you can streamline your document processing, glean actionable insights, and make confident decisions—all within an intuitive interface.
Objective: To effectively process and review Folio.
Prerequisites: You must have the necessary Folio Type already created and high-quality example image(s) or PDF(s) of the document you want to process.
What Is Folio?
Folio is an intelligent document processing feature that transforms collections of documents into actionable insights. By leveraging taxonomy, predefined rules and data dictionaries configured in Folio_Type, Folio automates the extraction, validation, and organization of data across your uploaded document sets. Your processed outcome—the Folio—serves as a single source of truth for review and helps you make informed decisions.
Step 1: Navigate the Folio
The Documents Hub is your central dashboard for all processed documents, including Folio. You can access Folio from Data Hub > Document Manager > Folio.
When you navigate to the Folio section, you'll see the Folio Listing screen, which displays all folios processed within your account. Each folio in the list shows:

- Folio Name: A unique identifier for the Folio
- Status: Current system processing state of the Folio (Processing, Processed, Error, Completed)
- Review Status: Current review state of the Folio (Not Ready, Ready for Review, Ready for Re-review, Approved, Sent Back)
- Folio Type: The processing template/taxonomy used
- Tags: Associated labels for easy categorization
- Assign User: Shows who's responsible for reviewing the folio
- Modified Date: Last update timestamp
- Created Date: When the folio was initially created
Step 2: Managing Your Folio
From the Folio Listing Screen, you can efficiently manage your folios using the following features:
- Search: Use the search bar to quickly find specific folio by name.
- Filter and Sort: Click on the column headers to sort the list or use advanced filters to narrow down the Folios based on specific criteria.
- Assign (Admins): If you are an administrator, you can assign or reassign a Folio to any user in your account directly from the Assign User dropdown menu or multi-select Folios via checkbox next to Folio Name and click on Assign User button.
- Delete: Delete any of the existing Folio.
Step 3: Reviewing Folio Results
Once Folio processing is done, click the Folio Name to open the Folio details and begin the review process. You'll find everything you need to conduct a thorough review. The screen is generally divided into two main tabs: Overview, and Rules.
Overview Tab: Your Folio at a Glance
The Overview provides a human-readable comprehensive summary of your processed folio and it's metrics:
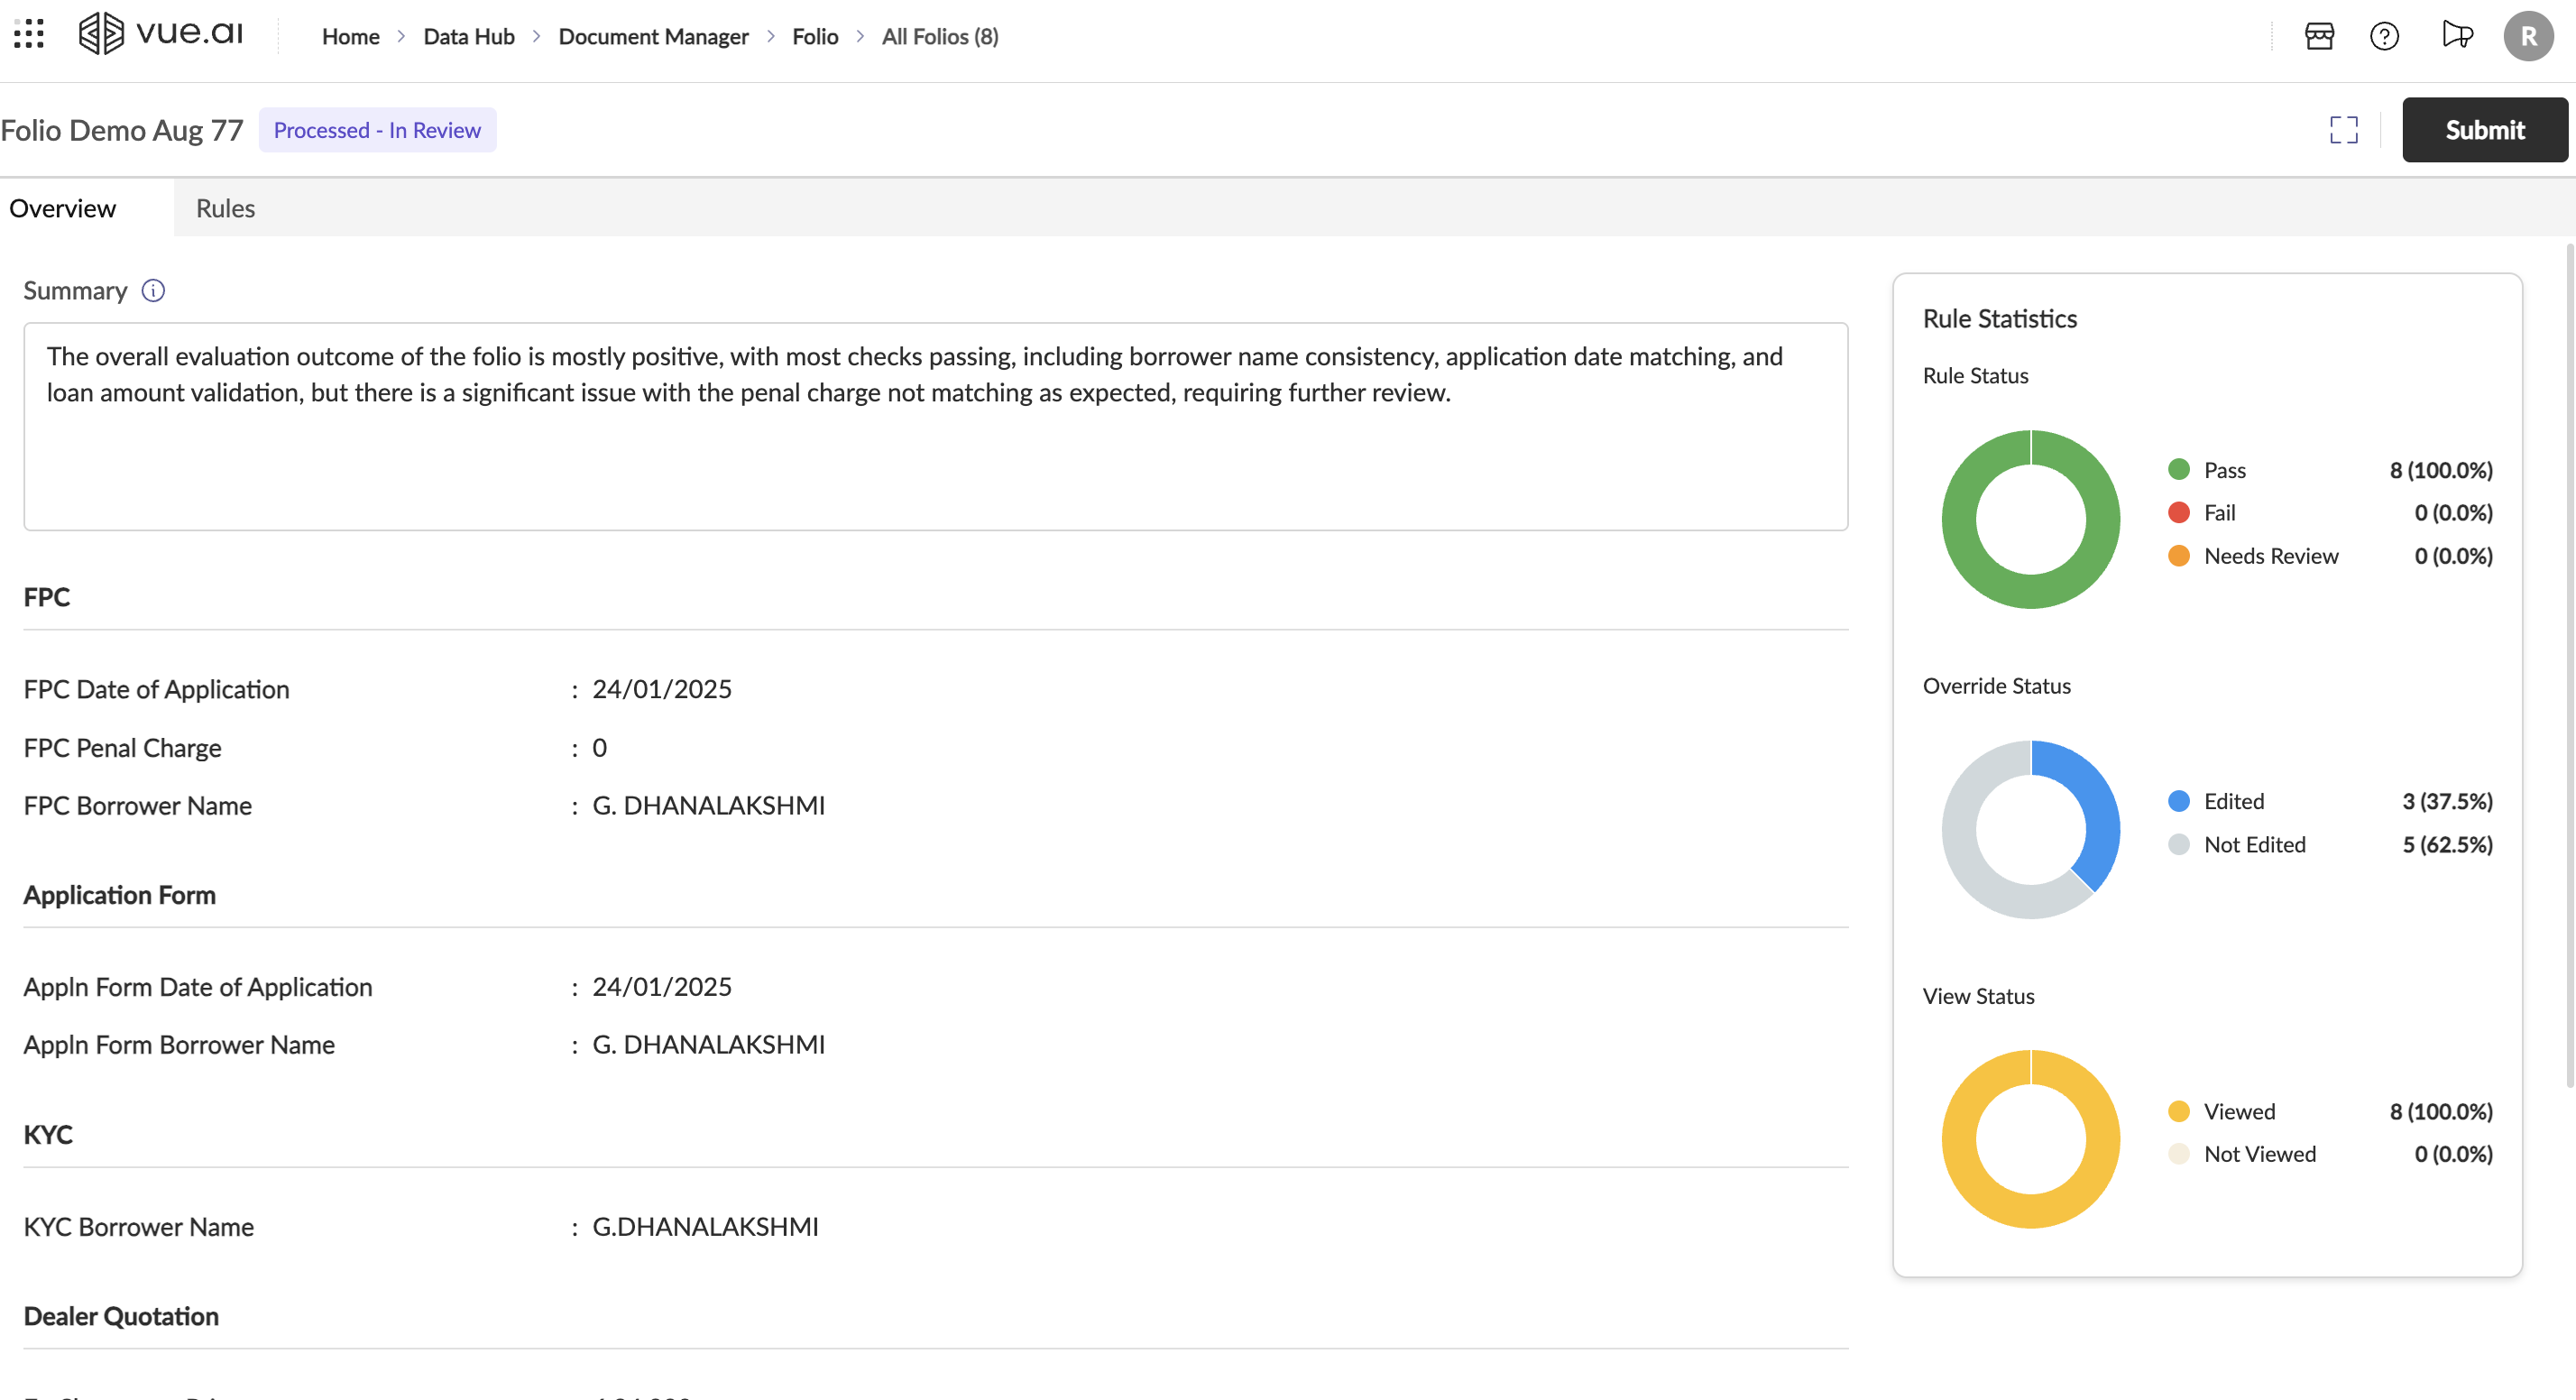
Here's what you'll find:
- Summary: A concise, auto-generated summary of the evaluation. It highlights key outcomes, such as passed checks and any significant issues that require further attention.
- Document Information: Details about each processed document with extracted attribute-value pairs.
- Example: you'll see Date of Application : 24/01/2025 and Borrower Name : 0 under the Application Form.
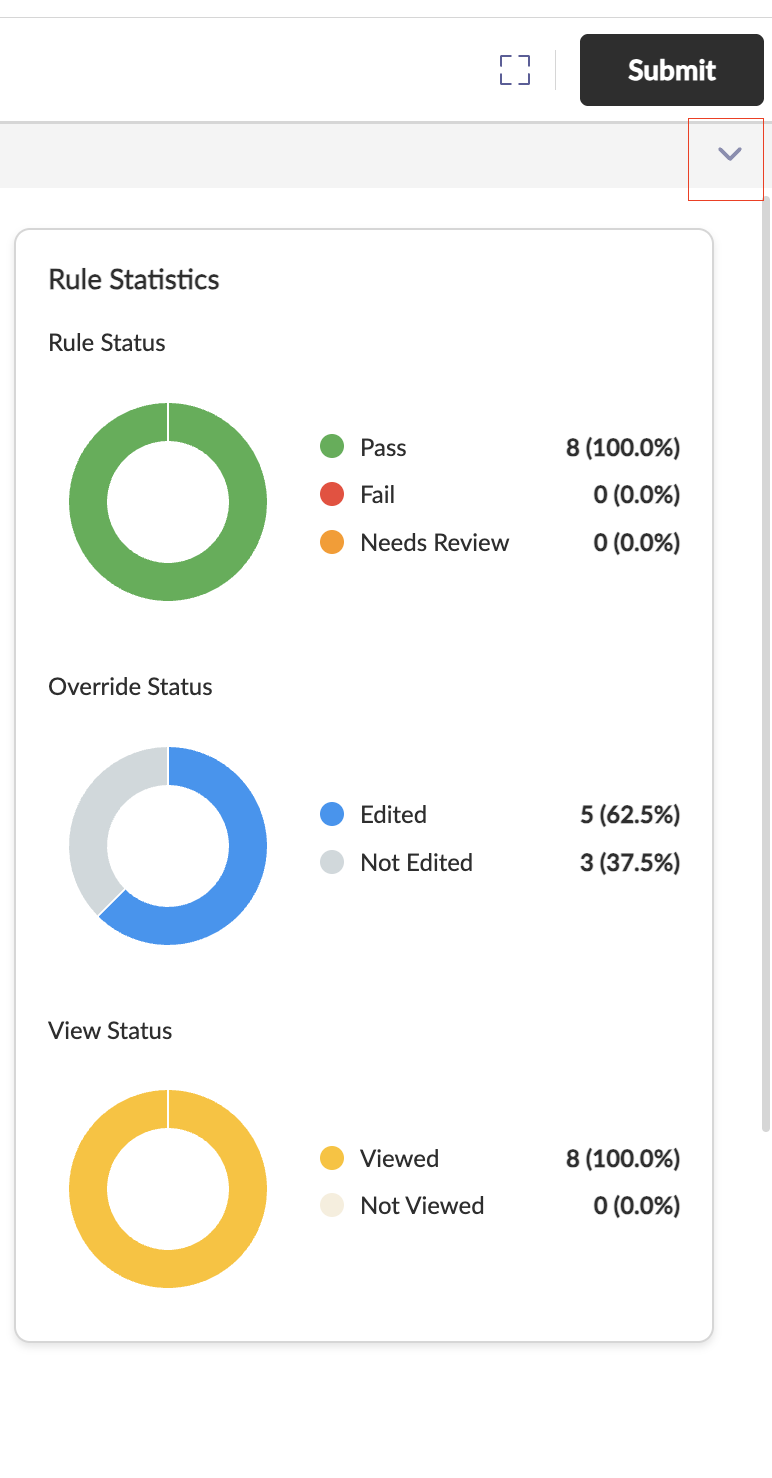
- Rule Statistics: Statistics about rule execution and user actions performed.
- Rule Status: A donut chart showing the percentage of rules that have passed, failed, or are pending review.
- Override Status: See how many rule statuses have been manually edited by users during the review process.
- View Status: Track how many of the total rules have been viewed by a reviewer.
Rules Tab: A Deep Dive into the Details
The Rules section is where you'll spend most of your review time. It lists every rule that was executed on the Folio. Here you can dive deeper into how your documents were analyzed and validated:
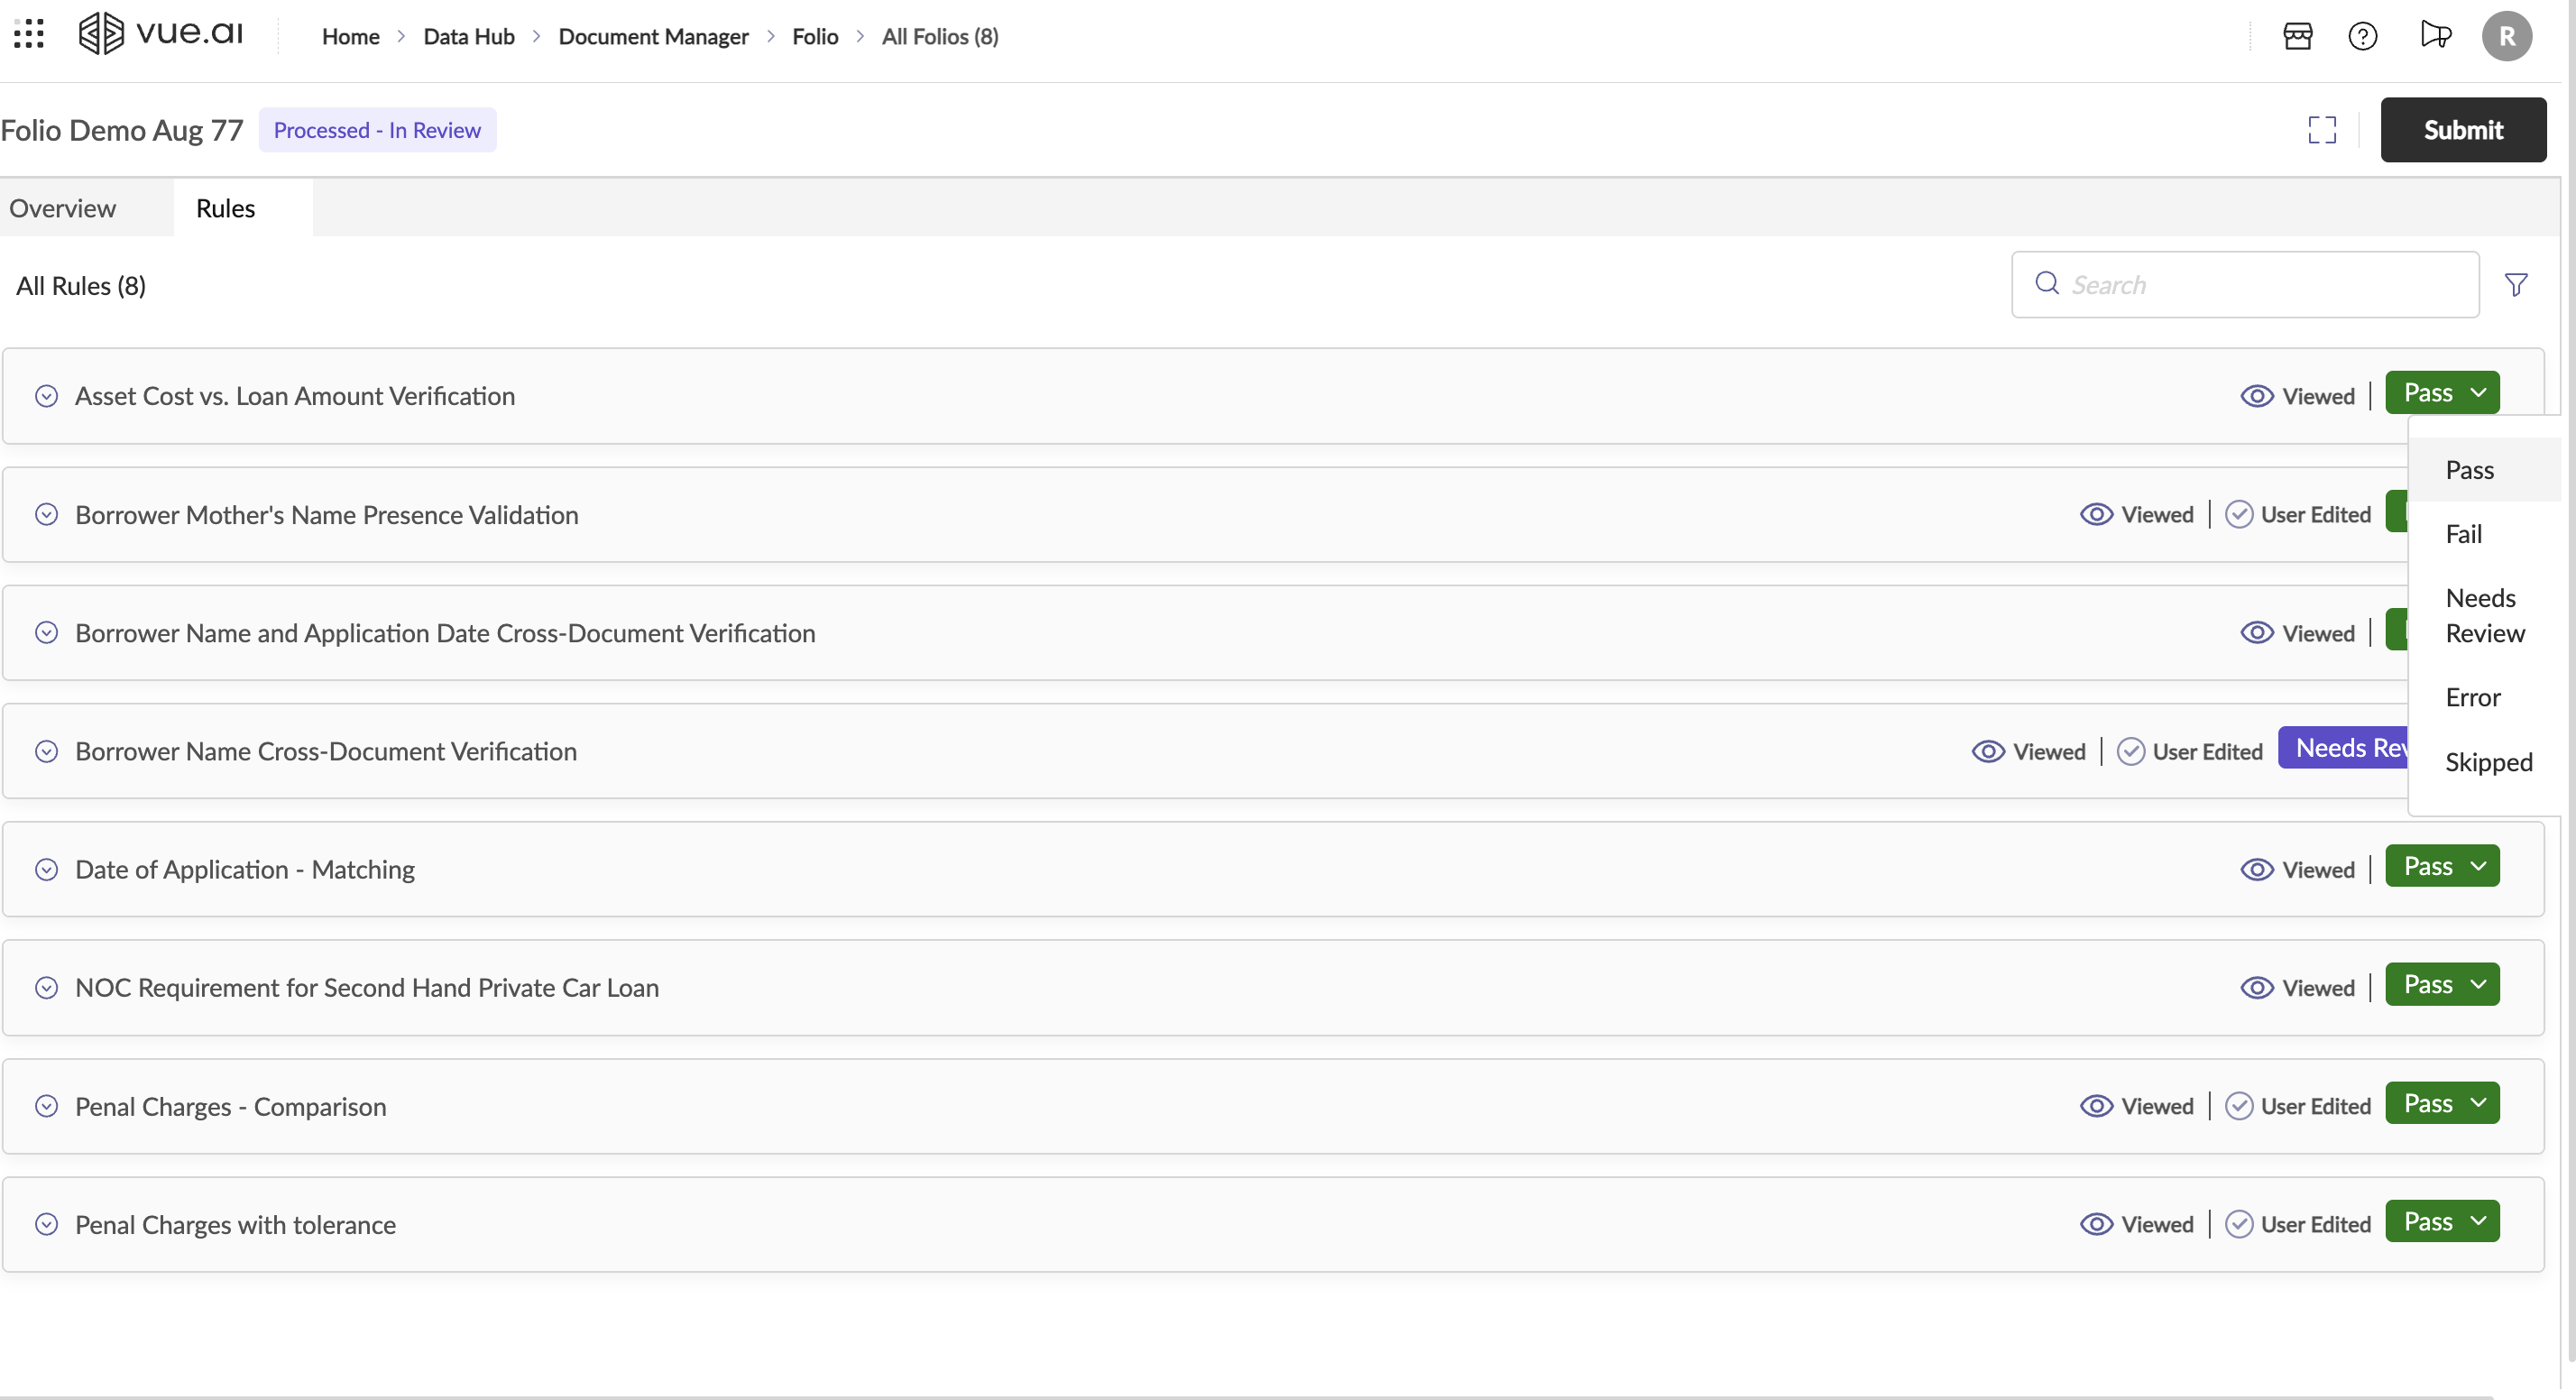
View All Rules: See a complete list of all rules executed during processing, with each rule consisting of:
- Rule Name: Descriptive title of what the rule is
- Execution Summary: What the rule found
- Status: Current result (Pass, Fail, Needs Review, etc.)
- View Status: Whether you've reviewed this rule
- Edit Status: Whether you've made changes to the rule status
- Description: Detailed explanation of the rule's purpose
- Conditions: All conditions that were evaluated
- Results Table: Detailed results showing source data, target data, and outcomes
- Document References: Direct links to source documents
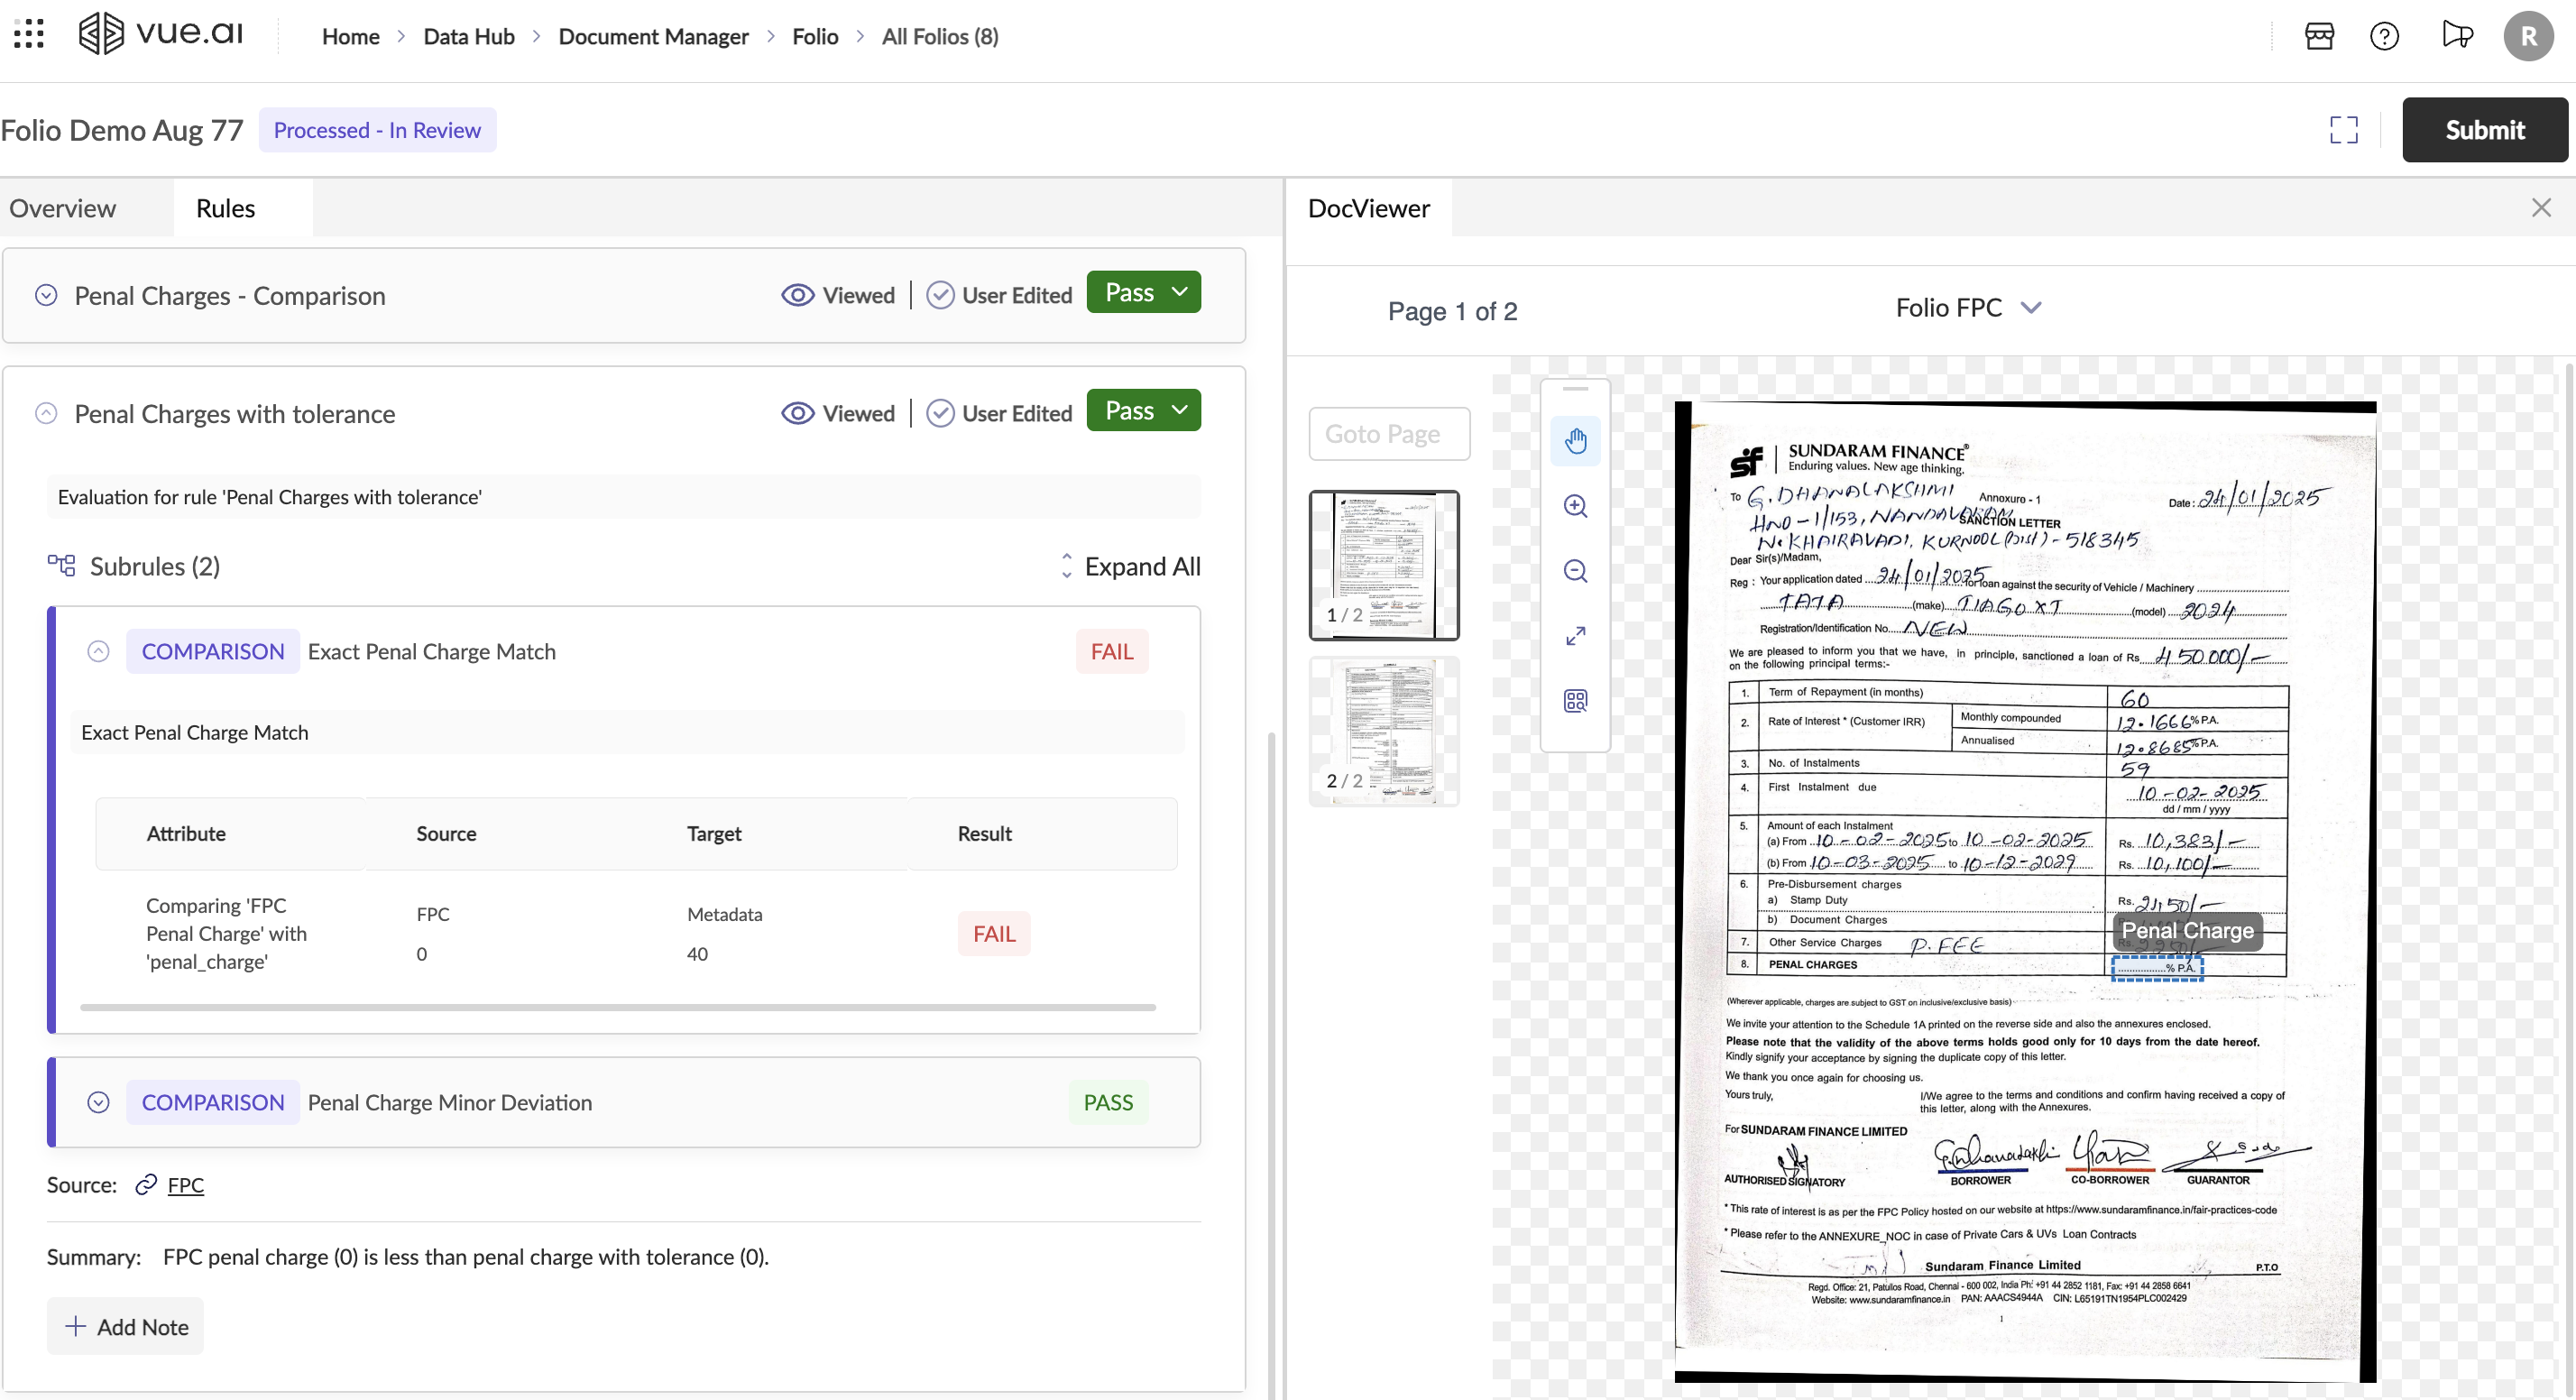
Understanding and Reviewing a Rule:
- Click on any rule name to expand and you'll see it's subrules. Clicking on rule name will also open the documents processed as part of the rule in the document viewer.
- Click a subrule to expand its results table (shows attributes, source, target and result).
- Click any row or value in the results table to open the Document at the exact page and highlight the attribute (the area the rule used). This helps you verify OCR/extraction visually.
- Note:
- If the rule used non-document sources (data dictionaries), links to those sources appear — click to open them in the Document Viewer.
- You can compare multiple sources by using the Compare Sources toggle.
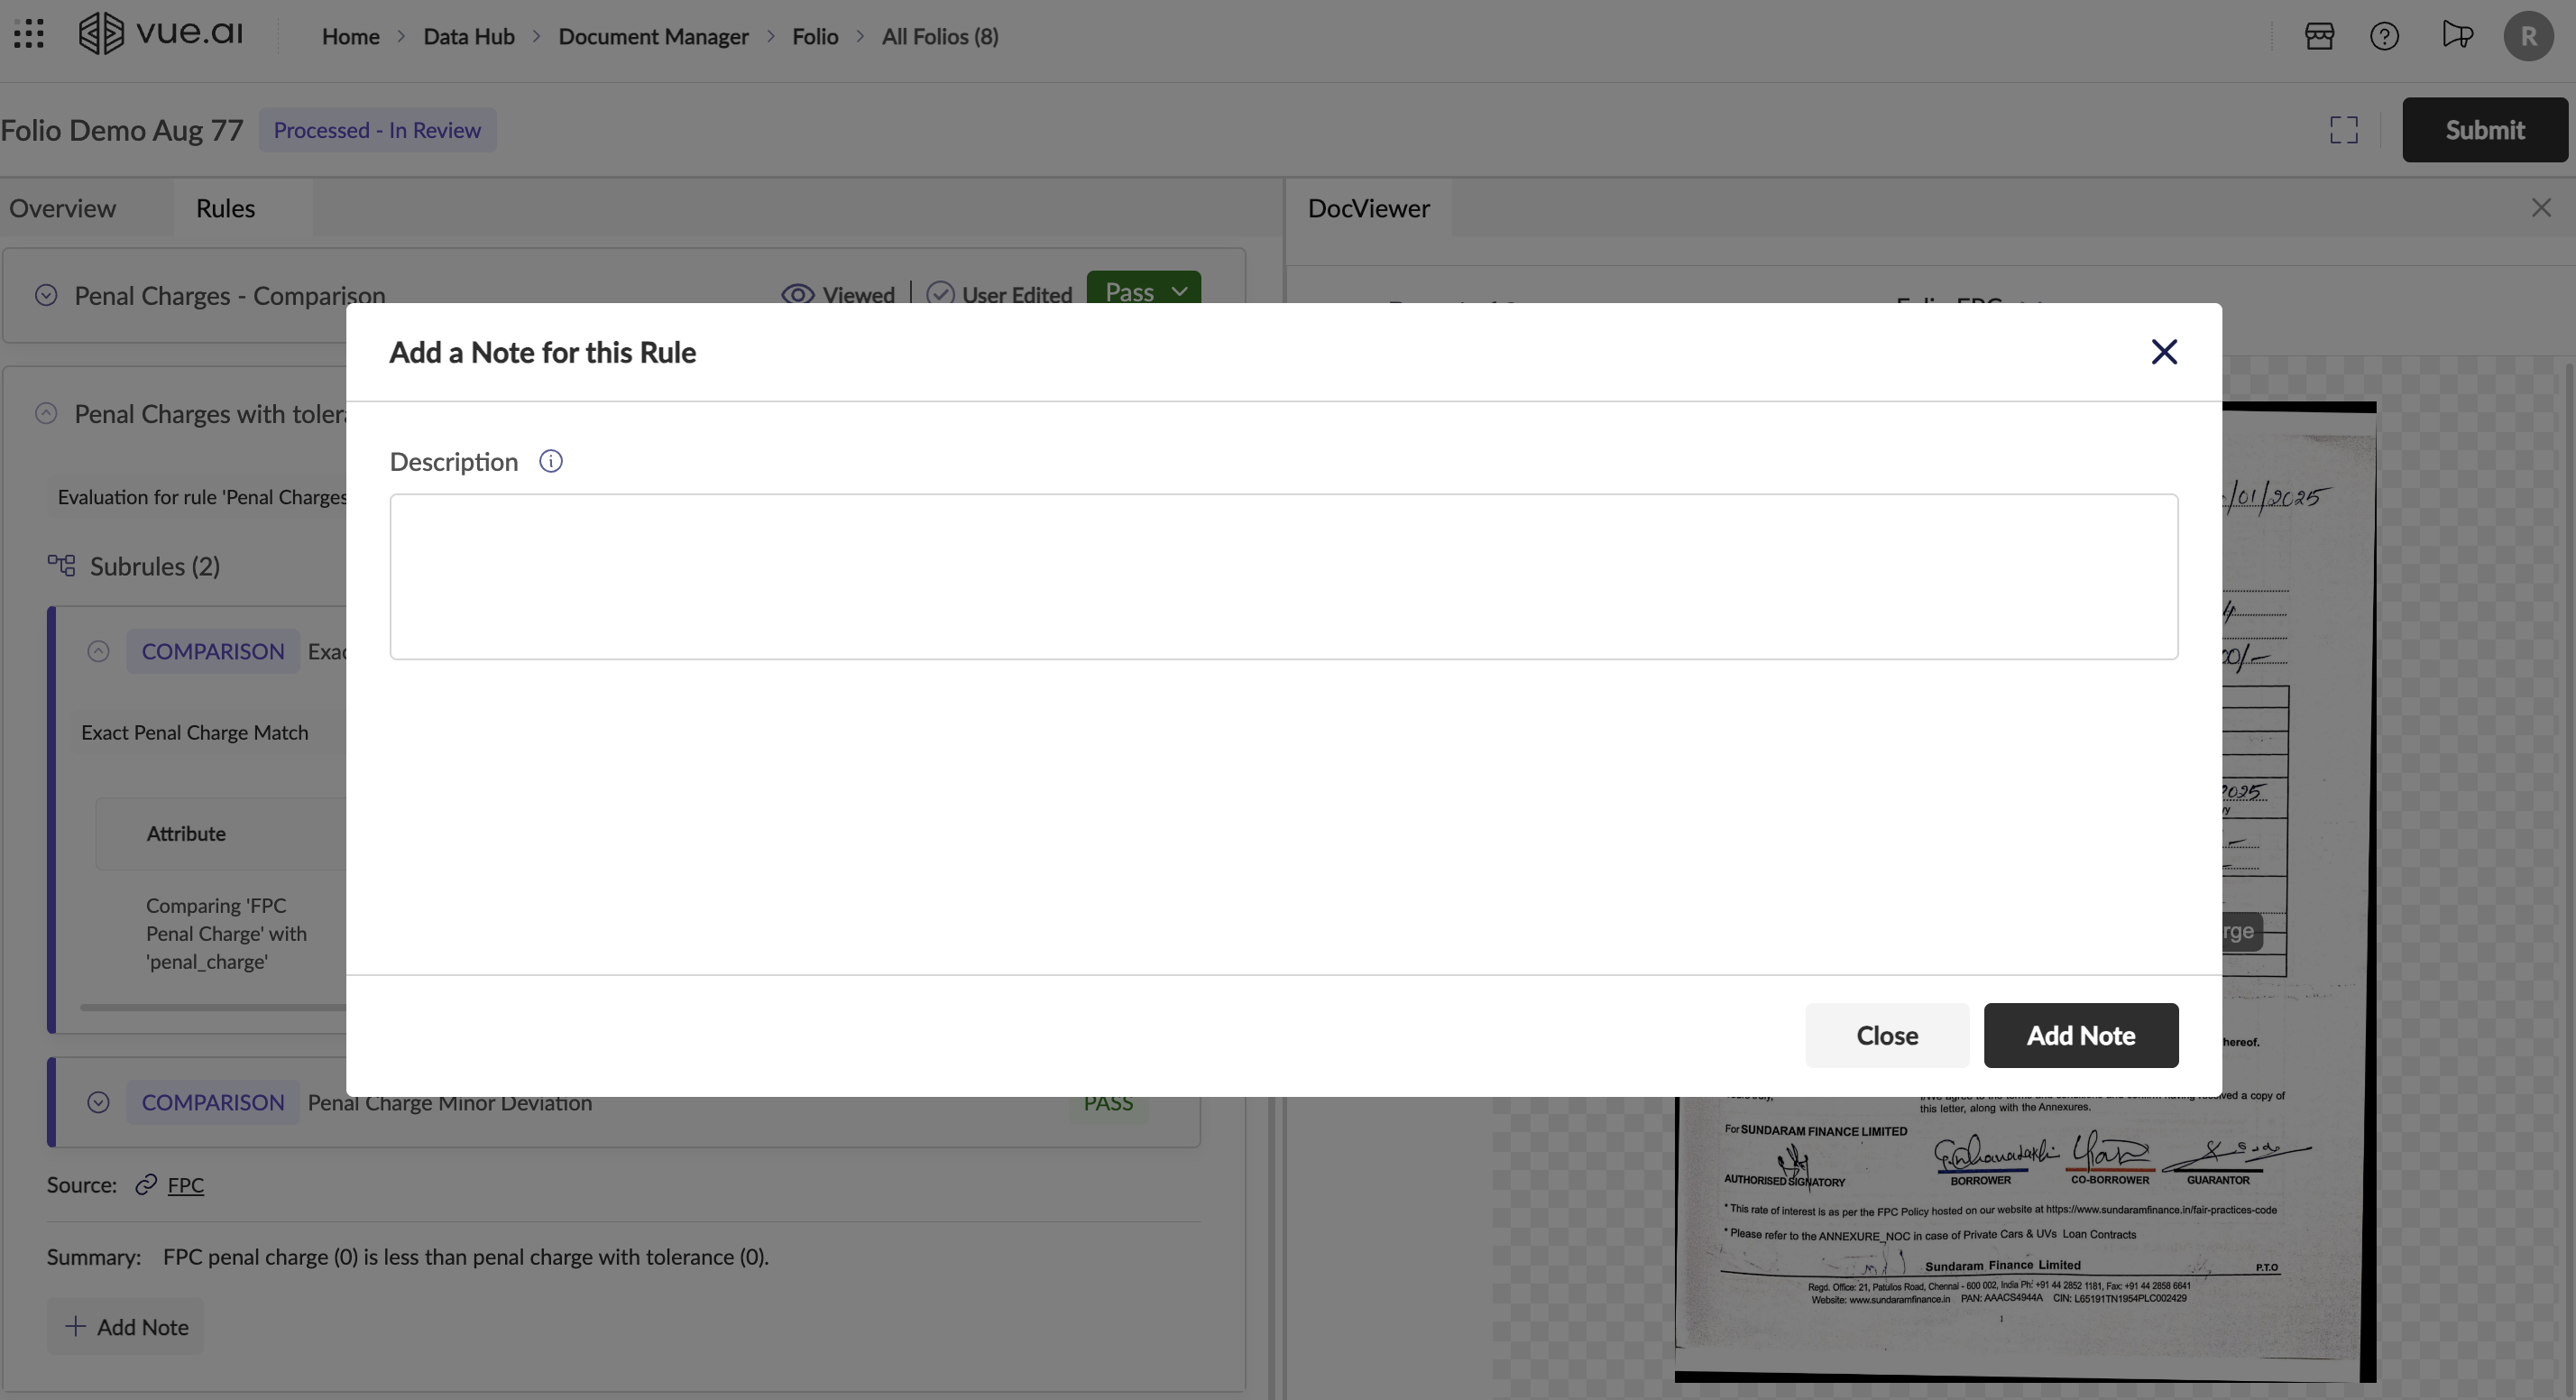
- Use Add Note inside a rule to record observations, corrections, or actions to be taken if reprocessing is needed. Notes are stored with the rule and included if you send the folio for reprocessing. Example flow: expand Date of Application - Matching → open the subrule Application Date Match → the results show Folio FPC: 24/01/2025 vs AppIn Form: 24/01/2025 → PASS. If it was different you could click the row, view the highlighted date on the doc, add a note and change status to "Needs Review."
| Rule details | Rule Notes |
|---|---|
 |  |
DocViewer Tab: Your Window to the Documents
The DocViewer is seamlessly integrated with the Rules tab to give you a direct side-by-side view of the documents you are reviewing.
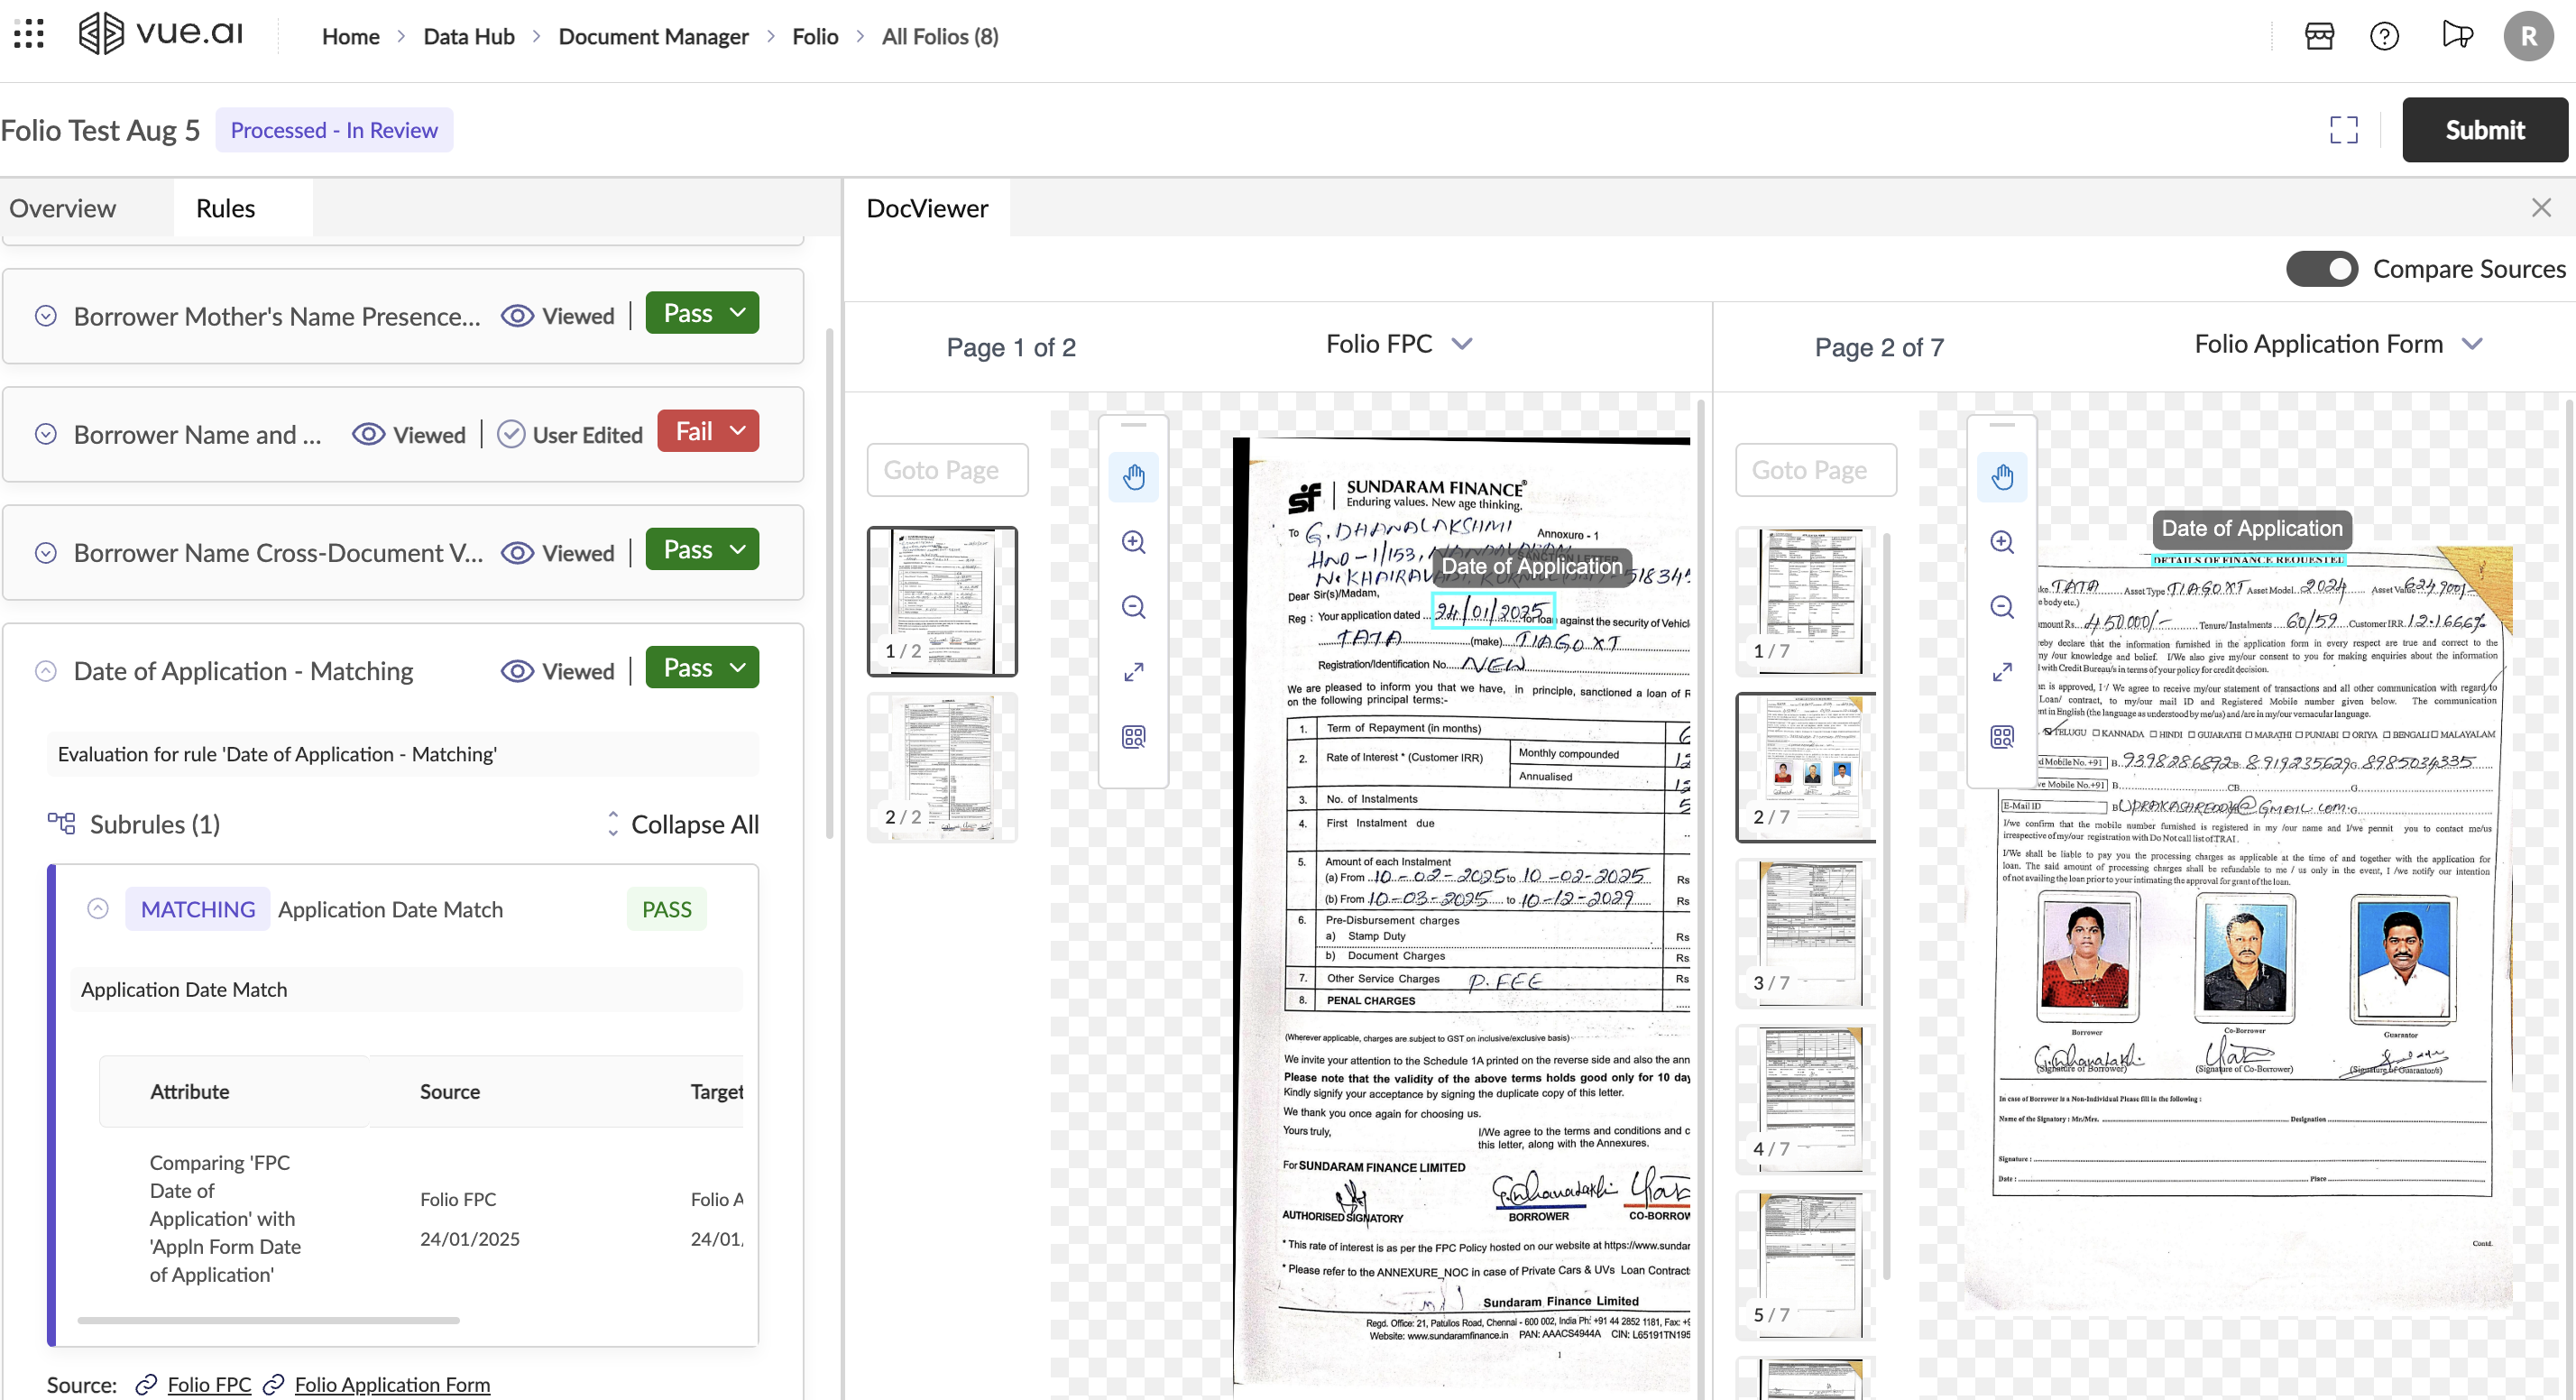
The Document Viewer opens automatically when you click on rule results and provides a rich viewing experience with several helpful tools:
- Side-by-Side Comparison: You can open and compare multiple documents at once by clicking the
Compare Sourcesbutton. - Easy Navigation: Use the page thumbnails on the left to jump to a specific page or use the
Goto Pageinput for direct access.- Thumbnails & page list — quickly navigate pages of the current source.
- Zoom / Fit / Pan — focus on specific regions.
- Full-screen - mode for detailed inspection.
- Viewing Tools: Effortlessly zoom in and out to get a closer look at the document details.
- Highlight: When you click a result from a rule, the viewer takes you to the page and highlights the attribute/region used by the rule.
- Switch sources: Manually choose a different source (e.g., swap from ID card to Application Form) or use the rule's source links.
All Sources Tab: An index of all the documents and master records (or System Data)
Access all the documents & system data used in processing the Folio. This tab also lists all the attributes and values from all sources.
You can also access the document viewer and compare sources from the source tab.
Step 4: Finalizing Your Work: Submitting the Folio
Once your review is complete, you have two primary options using the Submit button located in the top-right corner.
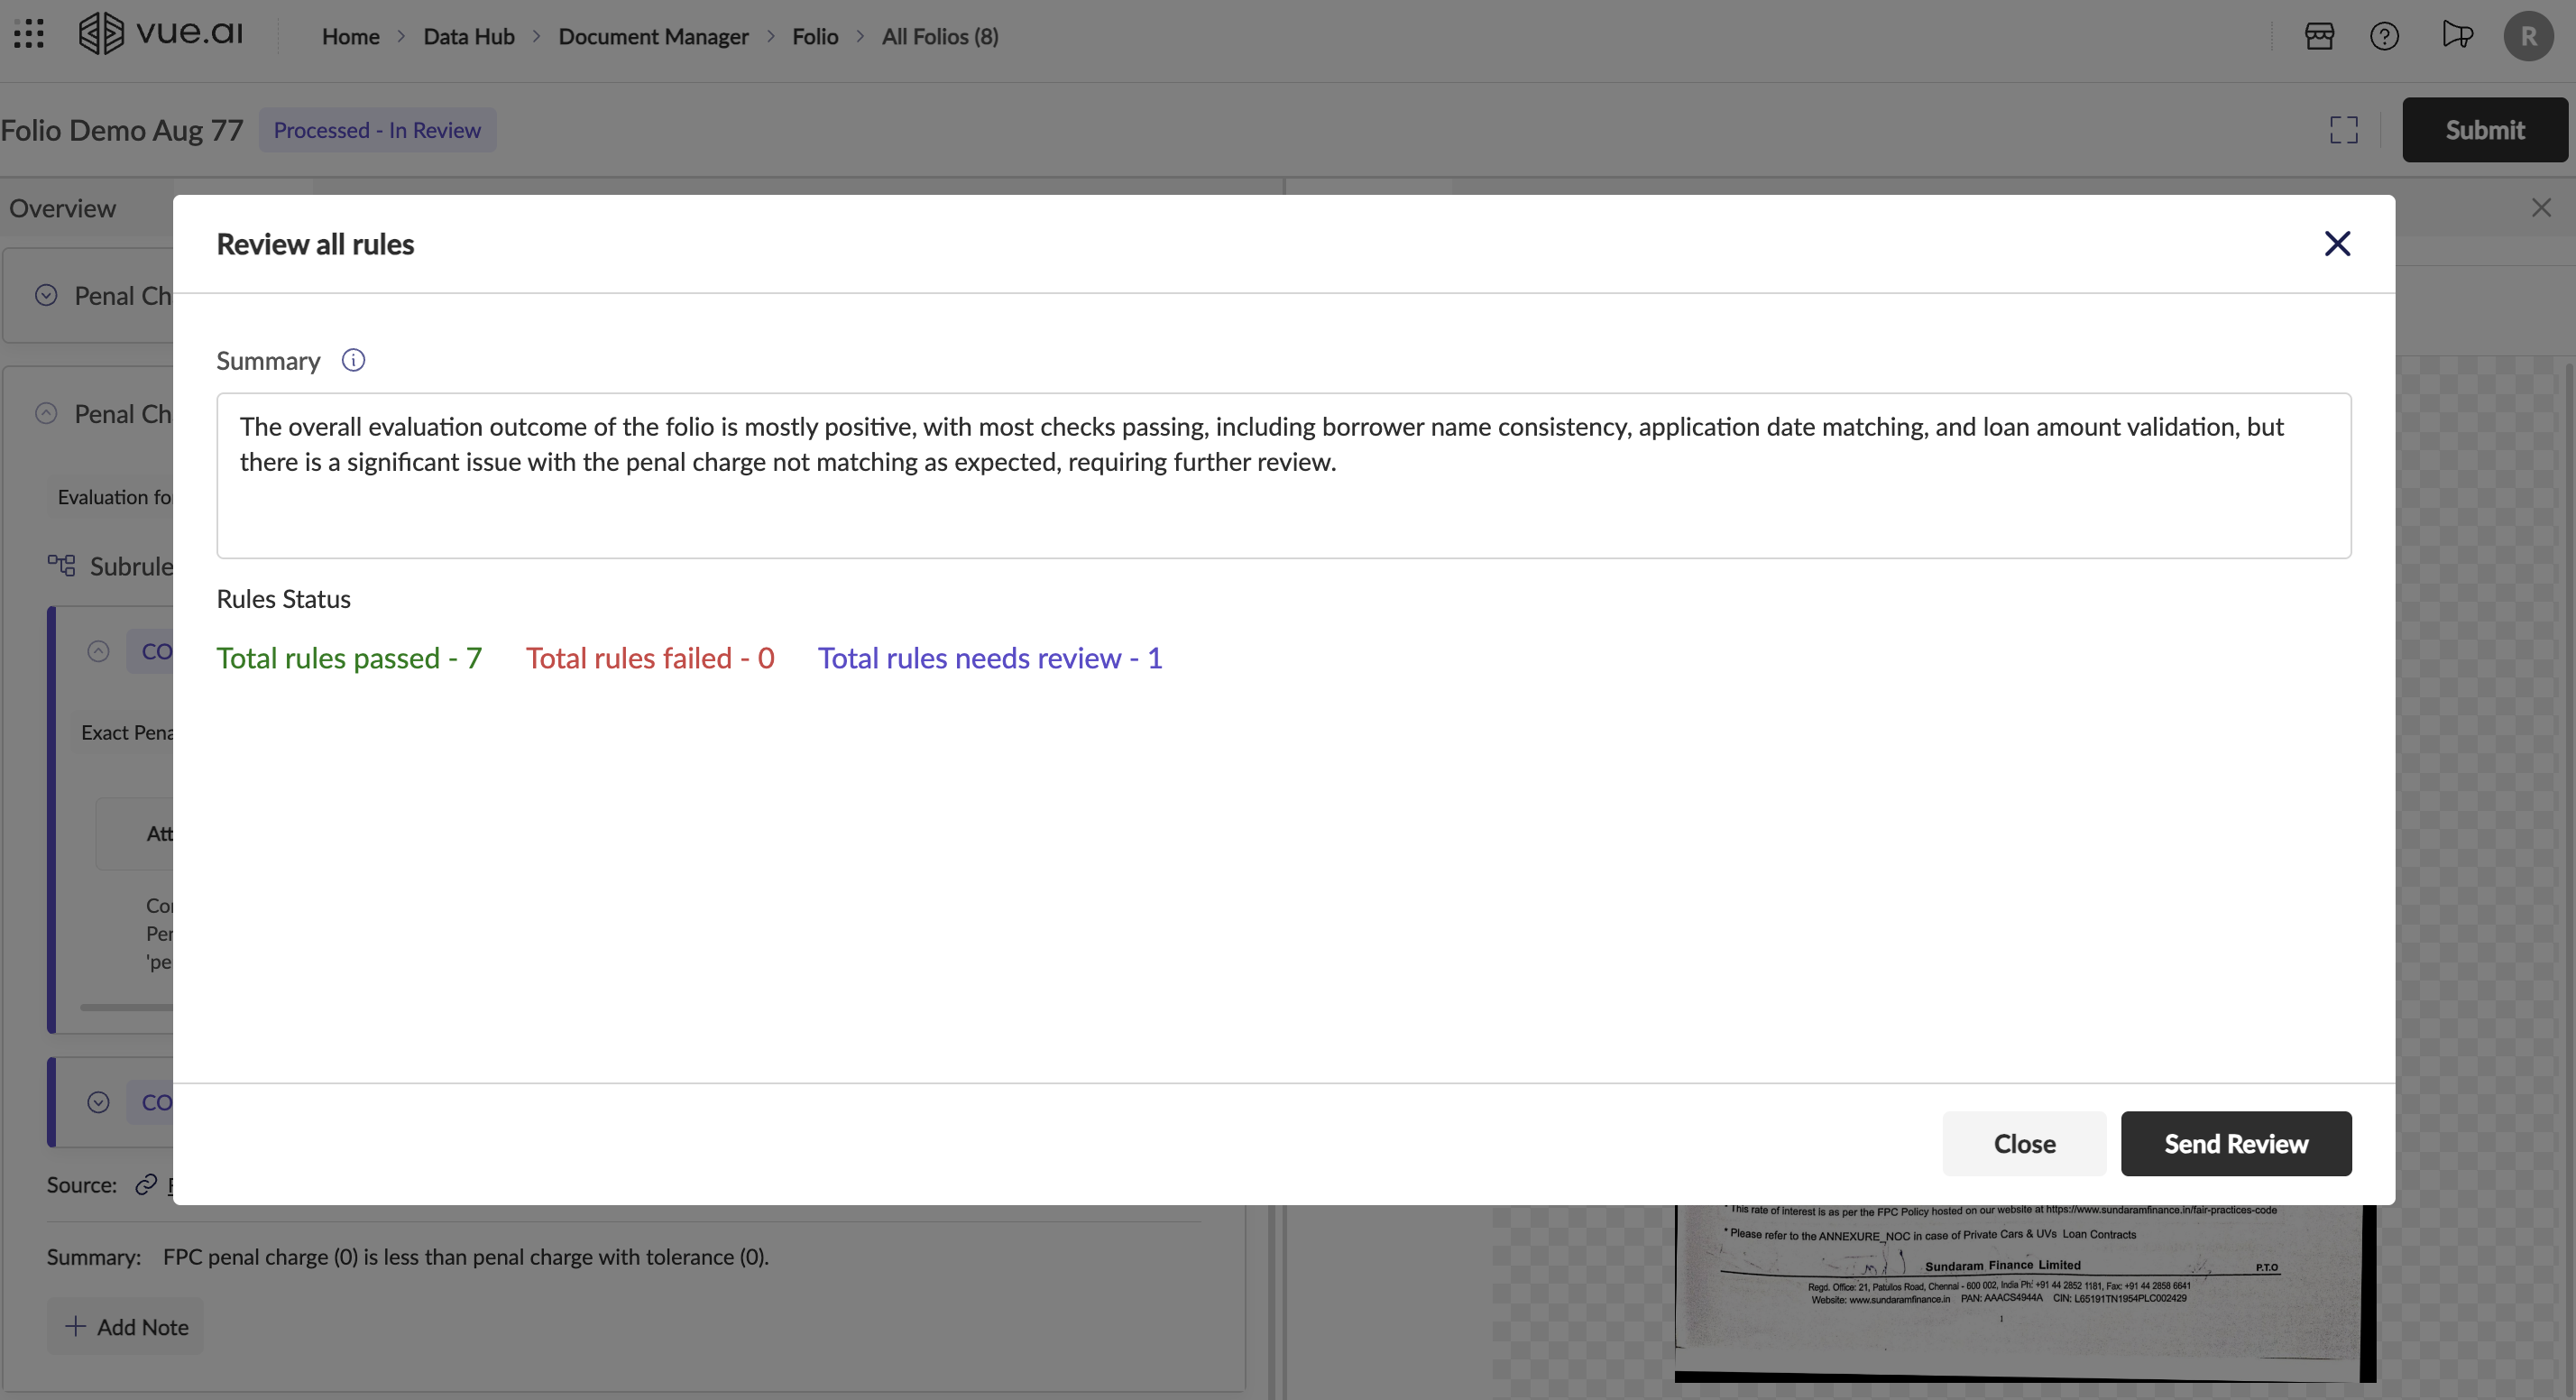
Complete the Review: If you have resolved all issues and are satisfied with the results, you can submit the Folio to finalize the review process.
Send for Review/Reprocessing: If you discover a significant issue that needs to be addressed—perhaps by another team member or through reprocessing—you can send it back. When doing this, it is best practice to leave a clear summary or notes explaining the reason, ensuring a smooth handoff. Click Send Review to complete this action.
You are now equipped with the knowledge to effectively use the Folio feature. Happy processing!
Best Practices
Efficient Review Process
- Start with the Overview: Get familiar with the key data points before diving into rules
- Prioritize Failed Rules: Focus first on rules that failed automated validation
- Use Document Viewer Effectively: Take advantage of the highlighting feature to quickly locate relevant information
- Document Your Decisions: Always add notes when overriding system assessments
- Compare Sources When Needed: Use the side-by-side comparison for complex validations
- Final Review gives you a summary before you submit, ensuring nothing is missed.
Quality Assurance Tips
- Cross-Reference Data: Verify that information is consistent across different documents
- Check Edge Cases: Pay special attention to rules marked as "Needs Review"
- Validate Calculations: For rules involving computations, double-check the math
- Consider Context: Sometimes technically correct data might still need human judgment
Collaboration Features
- Assign Users: Administrators can assign specific folios to team members
- Notes for Team: Use notes to communicate with colleagues who might reprocess the folio
- Status Tracking: Monitor which team members have viewed or edited rules
Glossary
- Status: Current system processing state of the Folio.
- Processing: Folio is currently being processed by Vue.
- Processed: Folio has finished processed is ready for review.
- Error: Folio has run into an issue during processing. If this occurs, reach out to our support team via the support widget.
- Completed: Folio has finished processing and reviewed by the user.
- Review Status: Current review state of the Folio (Not Ready, Ready for Review, Ready for Re-review, Approved, Sent Back)
- Not Ready: Folio is currently being processed is not ready for review.
- Ready for Review:
- Rules: Business or technical checks that run on the data from sources based on a set of defined conditions. Example: Verify customer identify by checking if personal information like name, date of birth match across the different sources.
Verify rule result using its statuses.- Pass (Green): Rule conditions were successfully met
- Fail (Red): Rule conditions were not met
- Needs Review (Blue): Manual review is required
- Not Ready (Orange): Processing is incomplete or pending
- Error (Red): Rule processing has failed due to unexpected reasons. If this occurs, reach out to our support team via the support widget.
- Subrules and Conditions: A rule is often made up of one or more specific checks, referred to as "Subrules" or conditions. Example: the "Date of Application - Matching" rule has a "MATCHING Application Date Match" subrule.
- Results Table: This table shows you the exact data points that were compared. It details the attribute, its source document, and the target value it was compared against.
- Interactive Highlighting: When you click on a row in the results table, the DocViewer will automatically navigate to the precise location in the source document and highlight the data point for you. This makes verification incredibly fast and intuitive.
- Manual Override: If you disagree with a rule's automated status after your review, you can manually change it. The
User Editedtag will appear to indicate a manual change has been made. - Add a Note: You can add notes to any rule to provide context, ask questions, or leave instructions for other reviewers. These notes are saved with the rule for future reference.
Frequently Asked Questions
This FAQ provides answers to common questions about creating and managing Document Types.
Getting Started
What is Folio and how does it work?
Folio is an intelligent document processing feature that transforms collections of documents into actionable insights. It uses predefined taxonomy, rules, and data dictionaries configured in Folio Type to automatically extract, validate, and organize data from your uploaded document sets. The system processes your documents and creates a comprehensive review interface where you can verify results and make informed decisions.
What are the prerequisites for using Folio?
To use Folio effectively, you need:
- A properly configured Folio Type that matches your document processing needs
- High-quality images or PDFs of the documents you want to process
- Appropriate user permissions (RBAC) to access, create and review folios
How do I access Folio?
Navigate to Home > Data Hub > Document Manager > Folio from the home screen. This will take you to the Folio Listing screen where you can view all folios associated with your account.
Folio Management
What information is displayed in the Folio Listing?
The Folio Listing displays:
- Folio Name: A unique identifier for your document collection
- Status: Current processing state (Processing, Processed, Ready for Review, etc.)
- Review Status: Current review state (Ready for Review, Approved, Sent Back, etc.)
- Folio Type: The processing template used
- Tags: Associated labels for easy categorization
- Assign User: Shows who's responsible for reviewing
- Modified Date: Last update timestamp
- Created Date: When the folio was initially created
How can I search and filter folios?
- Search: Use the search bar to find specific folios by name
- Filter and Sort: Click column headers to sort or use advanced filters based on specific criteria
- Assign: Administrators can assign folios to users via dropdown menus or bulk assignment
- Multi-select folios: using checkboxes next to folio names for bulk operations
- Delete: Remove unwanted folios from the system
Can I assign folios to other users?
Yes, if you are an administrator, you can assign or reassign a folio to any user in your account by:
- Using the Assign User dropdown menu directly from the listing
- Multi-selecting folios via checkboxes and clicking the Assign User button
Can I delete folios? Yes, you can delete existing folios from the Folio Listing screen. However, ensure you have the necessary permissions and that deletion aligns with your organization's data retention policies
What is the difference between 'Status' and 'Review Status' on the listing page?
- Status refers to the system's processing state of the Folio. It tells you if the documents are still being processed (
Processing), if the system has finished its work (Processed), or if it's ready for human intervention (Ready for Review). - Review Status refers to the human-driven review stage. It indicates whether a user has approved the Folio (
Approved), sent it back for corrections (Sent Back), or if it's still waiting to be reviewed.
Understanding Folio Review Process
What's the difference between the Overview and Rules tabs?
- Overview Tab: Provides a high-level summary including auto-generated evaluation summary, extracted document information, and statistical metrics about rule execution
- Rules Tab: Contains detailed information about every rule executed on the folio, allowing for in-depth review and validation of each condition and result
What information is available in the Overview tab?
The Overview tab includes:
- Summary: Auto-generated evaluation summary highlighting key outcomes and issues
- Document Information: Details about each processed document with extracted attribute-value pairs
- Rule Statistics: Including Rule Status, Override Status, and View Status charts
What do the different rule statuses mean?
Rule statuses indicate:
- Pass (Green): Rule conditions were successfully met
- Fail (Red): Rule conditions were not met
- Needs Review (Blue): Manual review is required
- Not Ready (Orange): Processing is incomplete or pending
- Error (Red): Rule processing has failed due to unexpected reasons. If this occurs, reach out to our support team via the support widget.
How do I review individual rules in detail?
To review rules:
- Click on any rule name to expand and see subrules and result tables
- Click on subrules to view their specific results tables
- Click any row or value in results tables to open the document at the exact location with highlighting
- Use the Document Viewer to verify OCR/extraction accuracy
- Add notes to record observations or corrections
How can I add notes to rules?
You can add notes by:
- Opening the specific rule you want to annotate
- Using the Add Note feature within the rule
- Recording observations, corrections, or actions for future reference
- Notes are saved with the rule and included if you send the folio for reprocessing
Document Viewer Features
How does the Document Viewer work?
The Document Viewer:
- Opens automatically when you click on rule results
- Provides direct view of documents being reviewed
- Highlights specific attributes when you click on rule results
- Allows navigation through pages using thumbnails or "Goto Page" input
What is the Compare Sources feature and when should I use it?
The Compare Sources feature allows you to view multiple documents side-by-side in the Document Viewer. Use this when you need to:
- Cross-reference information between different documents
- Verify data consistency across multiple sources
- Conduct complex validations that involve comparing data points
How does the highlighting feature work?
When you click on a result from a rule, the Document Viewer automatically navigates to the specific page and highlights the exact attribute or region that was used by the rule. This makes verification fast and intuitive, allowing you to visually confirm the accuracy of data extraction.
What navigation tools are available in the Document Viewer?
The Document Viewer provides:
- Page thumbnails on the left for quick navigation
- "Goto Page" input for direct page access
- Zoom in/out controls for detailed inspection
- Full-screen mode for comprehensive review
- Pan functionality to focus on specific regions
Rule Management and Overrides
Can I change a rule's status after the system has processed it?
Yes, you can manually override rule statuses based on your review. When you make changes, a "User Edited" tag will appear to indicate manual intervention. This is useful when you disagree with the automated assessment after thorough review.
What should I include in rule notes?
Rule notes should contain:
- Observations about rule execution
- Explanations for status changes
- Corrections needed for reprocessing
- Instructions for other reviewers
- Context for future reference
These notes are saved with the rule and included if you send the folio for reprocessing.
What are subrules and conditions?
Subrules are specific checks within a larger rule. For example, a "Date of Application - Matching" rule might contain a "MATCHING Application Date Match" subrule. Each subrule has its own conditions and results table showing exactly what data points were compared.
Submitting and Finalizing Folios
What are my options when I finish reviewing a folio?
You have two primary options using the Submit button:
- Complete the Review: Submit the folio to finalize if you're satisfied with all results
- Send for Review/Reprocessing: Send back for additional work with clear notes explaining issues that need addressing
When should I send a folio back for reprocessing?
Send a folio for reprocessing when you discover:
- Significant data extraction errors
- OCR issues that affect accuracy
- Rule configuration problems
- Missing or incorrect document processing
Always include detailed notes explaining the specific issues found.
What happens after I submit a folio?
Once submitted, the folio moves to approved status and the review process is complete. If sent for reprocessing, it returns to processing status with your feedback notes attached for the processing team to address.
What happens to my notes when I send a folio for reprocessing?
All notes you've added to rules are saved and included when you send the folio for reprocessing, ensuring continuity and clear communication with the next reviewer.
User Permissions and Administration
What can administrators do that regular users cannot?
Administrators have additional capabilities:
- Assign or reassign folios to specific users
- Perform bulk folio assignments using checkboxes
- Access advanced user management features
- Configure folio types and processing rules
How can I track who has worked on a folio?
The system provides several tracking features:
- View Status: Shows which rules have been reviewed
- Override Status: Indicates manual changes made by users
- User assignment information
- Modification timestamps
What if I don't have permission to perform certain actions?
Contact your system administrator to:
- Request access to folio creation
- Get assigned to specific folios for review
- Obtain additional permissions for advanced features
- Resolve any access-related issues
Troubleshooting
What should I do if documents don't load in the viewer?
Try these steps:
- Check your internet connection
- Refresh the page
- Clear your browser cache
- Contact technical support if issues persist
Why might a rule result seem incorrect?
Rule results may appear incorrect due to:
- OCR extraction errors
- Document quality issues
- Rule configuration problems
- Data format inconsistencies
Always verify by checking the source documents and use notes to flag potential system issues.
How do I handle edge cases in rule validation?
For edge cases:
- Pay special attention to rules marked "Needs Review"
- Use your professional judgment to assess context
- Cross-reference with multiple document sources
- Add detailed notes explaining your reasoning
- Consider whether technically correct data still needs manual review
I accidentally closed one of the tabs (Overview, Rules). How do I recover it?
Click on the dropdown arrow on the top right below the Submit button. You will see the tab which were recently closed. Click on it to recover it.
| Closed tab dropdown | Recover closed tab |
|---|---|
 |  |
Best Practices
What's the most efficient way to review a folio?
Follow this recommended workflow:
- Start with the Overview to understand key data points
- Prioritize reviewing failed rules first
- Use Document Viewer highlighting to quickly verify information
- Document all decisions with clear notes
- Use source comparison for complex validations
- Review the final summary before submitting
Dataset Manager
The Dataset Manager provides a centralized platform for uploading, organizing, and managing datasets efficiently. It supports multiple data formats and provides comprehensive data profiling capabilities.
Key Features:
- Multi-Format Support: CSV, Delta, Parquet, JSON, and more
- Data Profiling: Automatic analysis of data quality and statistics
- Dataset Groups: Organize related datasets with ER diagrams
- Version Control: Track dataset changes and maintain history
- Access Control: Manage permissions and sharing settings
Core Capabilities:
- Data Onboarding: Upload files simply and efficiently in all formats, sizes, and from any data system
- Data Processing: Automatically profile and sample data to make it ready for consumption
- Data Unification: Bring together data from different systems into Vue for unified analysis
- Workflow Integration: Use data to build automated workflows and reports
- Relationship Management: Form relationships between data using ER diagrams and summarize datasets within groups
Data Processing Pipeline: Once data is brought into the system, it is:
- Profiled: Analyze data characteristics and quality
- Sampled: Extract representative data samples
- Available for Use: Utilize data in building automated workflows
Data Ingestion
Learn how to upload and manage datasets effectively in the Vue.AI platform.
Getting Started
Prerequisites
- Access to Vue.AI Dataset Manager
- Data files prepared for upload
- Understanding of your data schema and relationships
Supported File Formats
- CSV: Comma-separated values (primary format)
- Delta: Delta Lake format for big data
- Parquet: Columnar storage format
- JSON: JavaScript Object Notation
- Excel: .xlsx files (converted to CSV)
File Size Limits
- Individual files: 50MB - 2GB depending on format
- Batch upload: Up to 10GB total
- Streaming ingestion: Unlimited with appropriate setup
Upload Process
Navigate to Dataset Manager
- Go to Data Hub → Dataset Manager → Datasets
- Click "Upload Dataset" or use drag-and-drop interface
File Selection and Configuration
- Select files from your local system
- Choose file format and encoding settings
- Configure column separators and delimiters
- Set header row and data type detection options
Schema Configuration
- Review auto-detected column types
- Modify data types as needed (String, Integer, Float, Date, Boolean)
- Set primary keys and unique constraints
- Configure null value handling
Data Validation
- Preview sample data before upload
- Validate data quality and format consistency
- Review data profiling statistics
- Address any validation warnings
Upload and Processing
- Initiate the upload process
- Monitor upload progress and status
- Review upload summary and any errors
- Confirm successful dataset creation
Dataset Groups and Organization
Creating Dataset Groups
- Group related datasets for better organization
- Create Entity-Relationship (ER) diagrams
- Define relationships between datasets
- Set group-level permissions and access controls
ER Diagram Configuration
- Identify primary and foreign key relationships
- Create visual representations of data connections
- Configure join conditions and relationship types
- Enable cross-dataset queries and analysis
Organizational Features
- Folder-based organization structure
- Tag-based categorization system
- Search and filter capabilities
- Metadata management and documentation
Data Profiling and Quality
Automatic Profiling
- Column statistics (min, max, mean, median)
- Data type distribution and consistency
- Null value analysis and missing data patterns
- Unique value counts and cardinality
Data Quality Metrics
- Completeness: Percentage of non-null values
- Validity: Data format and type compliance
- Consistency: Cross-column validation
- Accuracy: Data range and constraint validation
Sampling Methods
- Random sampling for large datasets
- Stratified sampling for representative analysis
- Time-based sampling for temporal data
- Custom sampling rules and configurations
Metrics and Visualization
The Dataset Manager includes comprehensive reporting and visualization capabilities with extensive chart and control options.
Report Creation
Getting Started with Reports
- Navigate to Dataset Manager → Metrics Overview
- Select datasets for analysis
- Choose visualization types and configurations
- Configure filters and interactive controls
Chart Types Available
Bar, Line, and Area Charts
- Compare values across categories
- Show trends over time
- Display cumulative data patterns
- Configure multiple data series
- Customize colors, labels, and data point styling
Scatter Plots
- Analyze relationships between variables
- Identify correlations and outliers
- Configure bubble sizing and colors
- Add trend lines and regression analysis
- Enable interactive point selection and tooltips
Donut and Pie Charts
- Show proportional data distribution
- Compare category percentages
- Configure color schemes and labels
- Add interactive drilling capabilities
- Support for exploded views and animations
Tables and Pivot Tables
- Display detailed data with sorting and filtering
- Create cross-tabulation analysis
- Configure aggregation functions (sum, avg, count, etc.)
- Export data in various formats (CSV, Excel, PDF)
- Conditional formatting and custom styling options
Funnel Charts
- Analyze conversion rates and processes
- Track multi-step workflows
- Identify bottlenecks and drop-off points
- Configure stage labels and metrics
- Support for both standard and multi-level funnels
Matrix Visualizations
- Heat map representations of data
- Cross-category analysis
- Color-coded value ranges
- Interactive cell exploration
- Customizable color gradients and thresholds
KPI Metrics
- Single-value displays for key indicators
- Comparison with targets and benchmarks
- Trend indicators and change calculations
- Alert configuration for threshold breaches
- Support for custom formulas and calculations
Advanced Visualization Features
Interactive Controls
- Dropdown Controls: Filter data by category values with multi-select capability
- Date Range Controls: Time-based filtering with preset ranges and custom selection
- Range Slider Controls: Numeric value filtering with histogram background display
- Text Search: Real-time filtering based on text input
- Cascading Filters: Dynamic filter relationships based on selection
Dashboard Management
- Drag-and-drop Layout: Flexible widget positioning with responsive grid system
- Template System: Save and reuse dashboard configurations
- Real-time Updates: Live data refresh with configurable intervals
- Collaboration Features: Share dashboards with permission-based access
- Export Options: Generate PDF reports, scheduled deliveries, and API access
Performance Optimization
- Data Caching: Intelligent caching strategies for large datasets
- Query Optimization: Automatic query optimization and indexing
- Load Balancing: Distribute processing across multiple resources
- Incremental Updates: Process only changed data for improved performance
Interactive Controls Configuration
Dropdown Controls
- Filter data by category values with multi-select capability
- Dynamic option loading based on data availability
- Cascading filter relationships for complex filtering scenarios
- Custom styling and validation rules
Date Range Controls
- Time-based filtering with multiple preset options
- Custom date selection with calendar interface
- Relative date calculations (Last 7 days, Month to Date, etc.)
- Time zone support and localization
Range Slider Controls
- Numeric value filtering with min/max range selection
- Real-time data updates with histogram background display
- Step configuration for discrete value selection
- Multiple range support for complex filtering
Dashboard and Sharing Configuration
Layout Management
- Drag-and-drop widget positioning with responsive grid system
- Full-screen and widget sizing options for different display modes
- Template-based dashboard creation for consistent designs
- Mobile-responsive layouts for on-the-go access
Sharing and Collaboration
- Share dashboards with team members using permission-based access
- Configure view and edit permissions with role-based access control
- Export dashboards as PDFs, images, or interactive web links
- Schedule automated report delivery via email or webhooks
Performance Optimization
- Data refresh scheduling with configurable intervals
- Intelligent caching strategies for large dataset handling
- Query optimization and automatic indexing for faster response times
- Real-time vs batch processing options based on use case requirements
Automation Hub
The Automation Hub provides powerful workflow orchestration capabilities with a comprehensive library of nodes for building end-to-end automation solutions. Design advanced analytics and machine learning workflows tailored to your needs.
- Streamline the design and execution of workflows with advanced automation capabilities, enabling scalable and efficient data and computational processes
- Create custom nodes and automate processes for specific problem statements
Agent Building
Build intelligent agents through a low-code/no-code setup on the Vue Platform Automation Hub.
Agent Service Guide
This guide will assist in using the Agent Builder and building agents using the builder interface.
Prerequisites
- Understanding of the concepts and components involved in workflow creation
- An understanding and a clear plan to create agents
- Ensure access to the Agent and Workflows before starting
Navigation Path Navigate to Home/Landing Page → Automation Hub → Workflow Manager → Agents

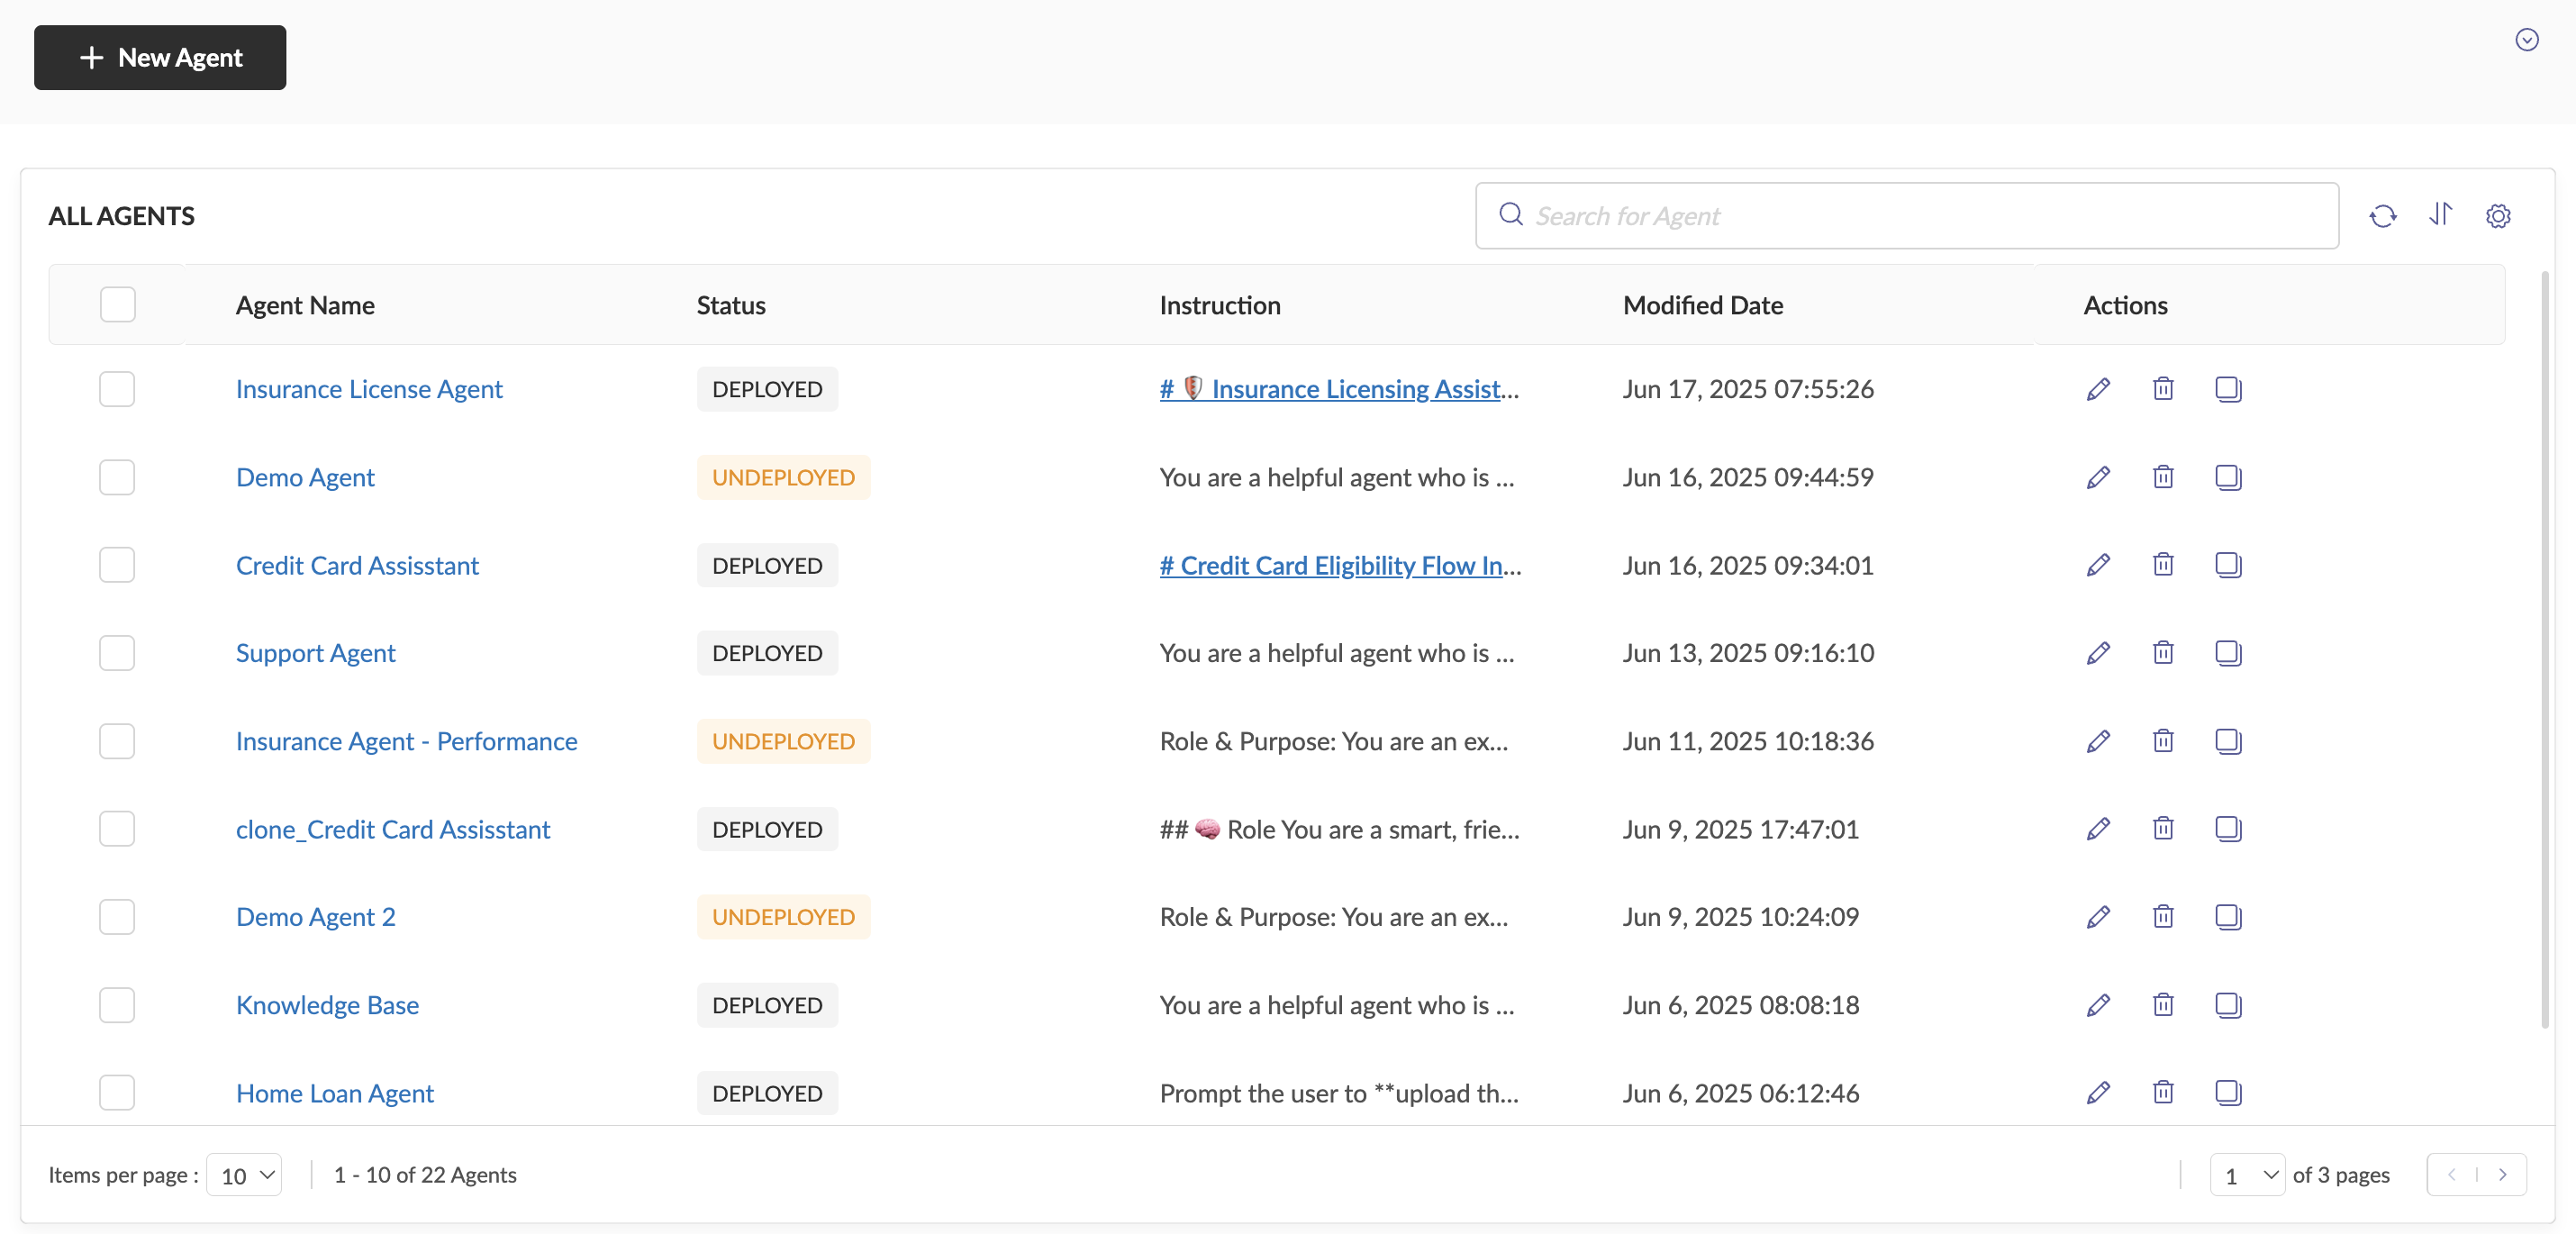
Agent Listing Page This leads to the Agents Listing Page, where existing agents can be accessed and new agents can be created. To create a new agent, click on the New Agent button at the top-left of the Agents Listing screen.
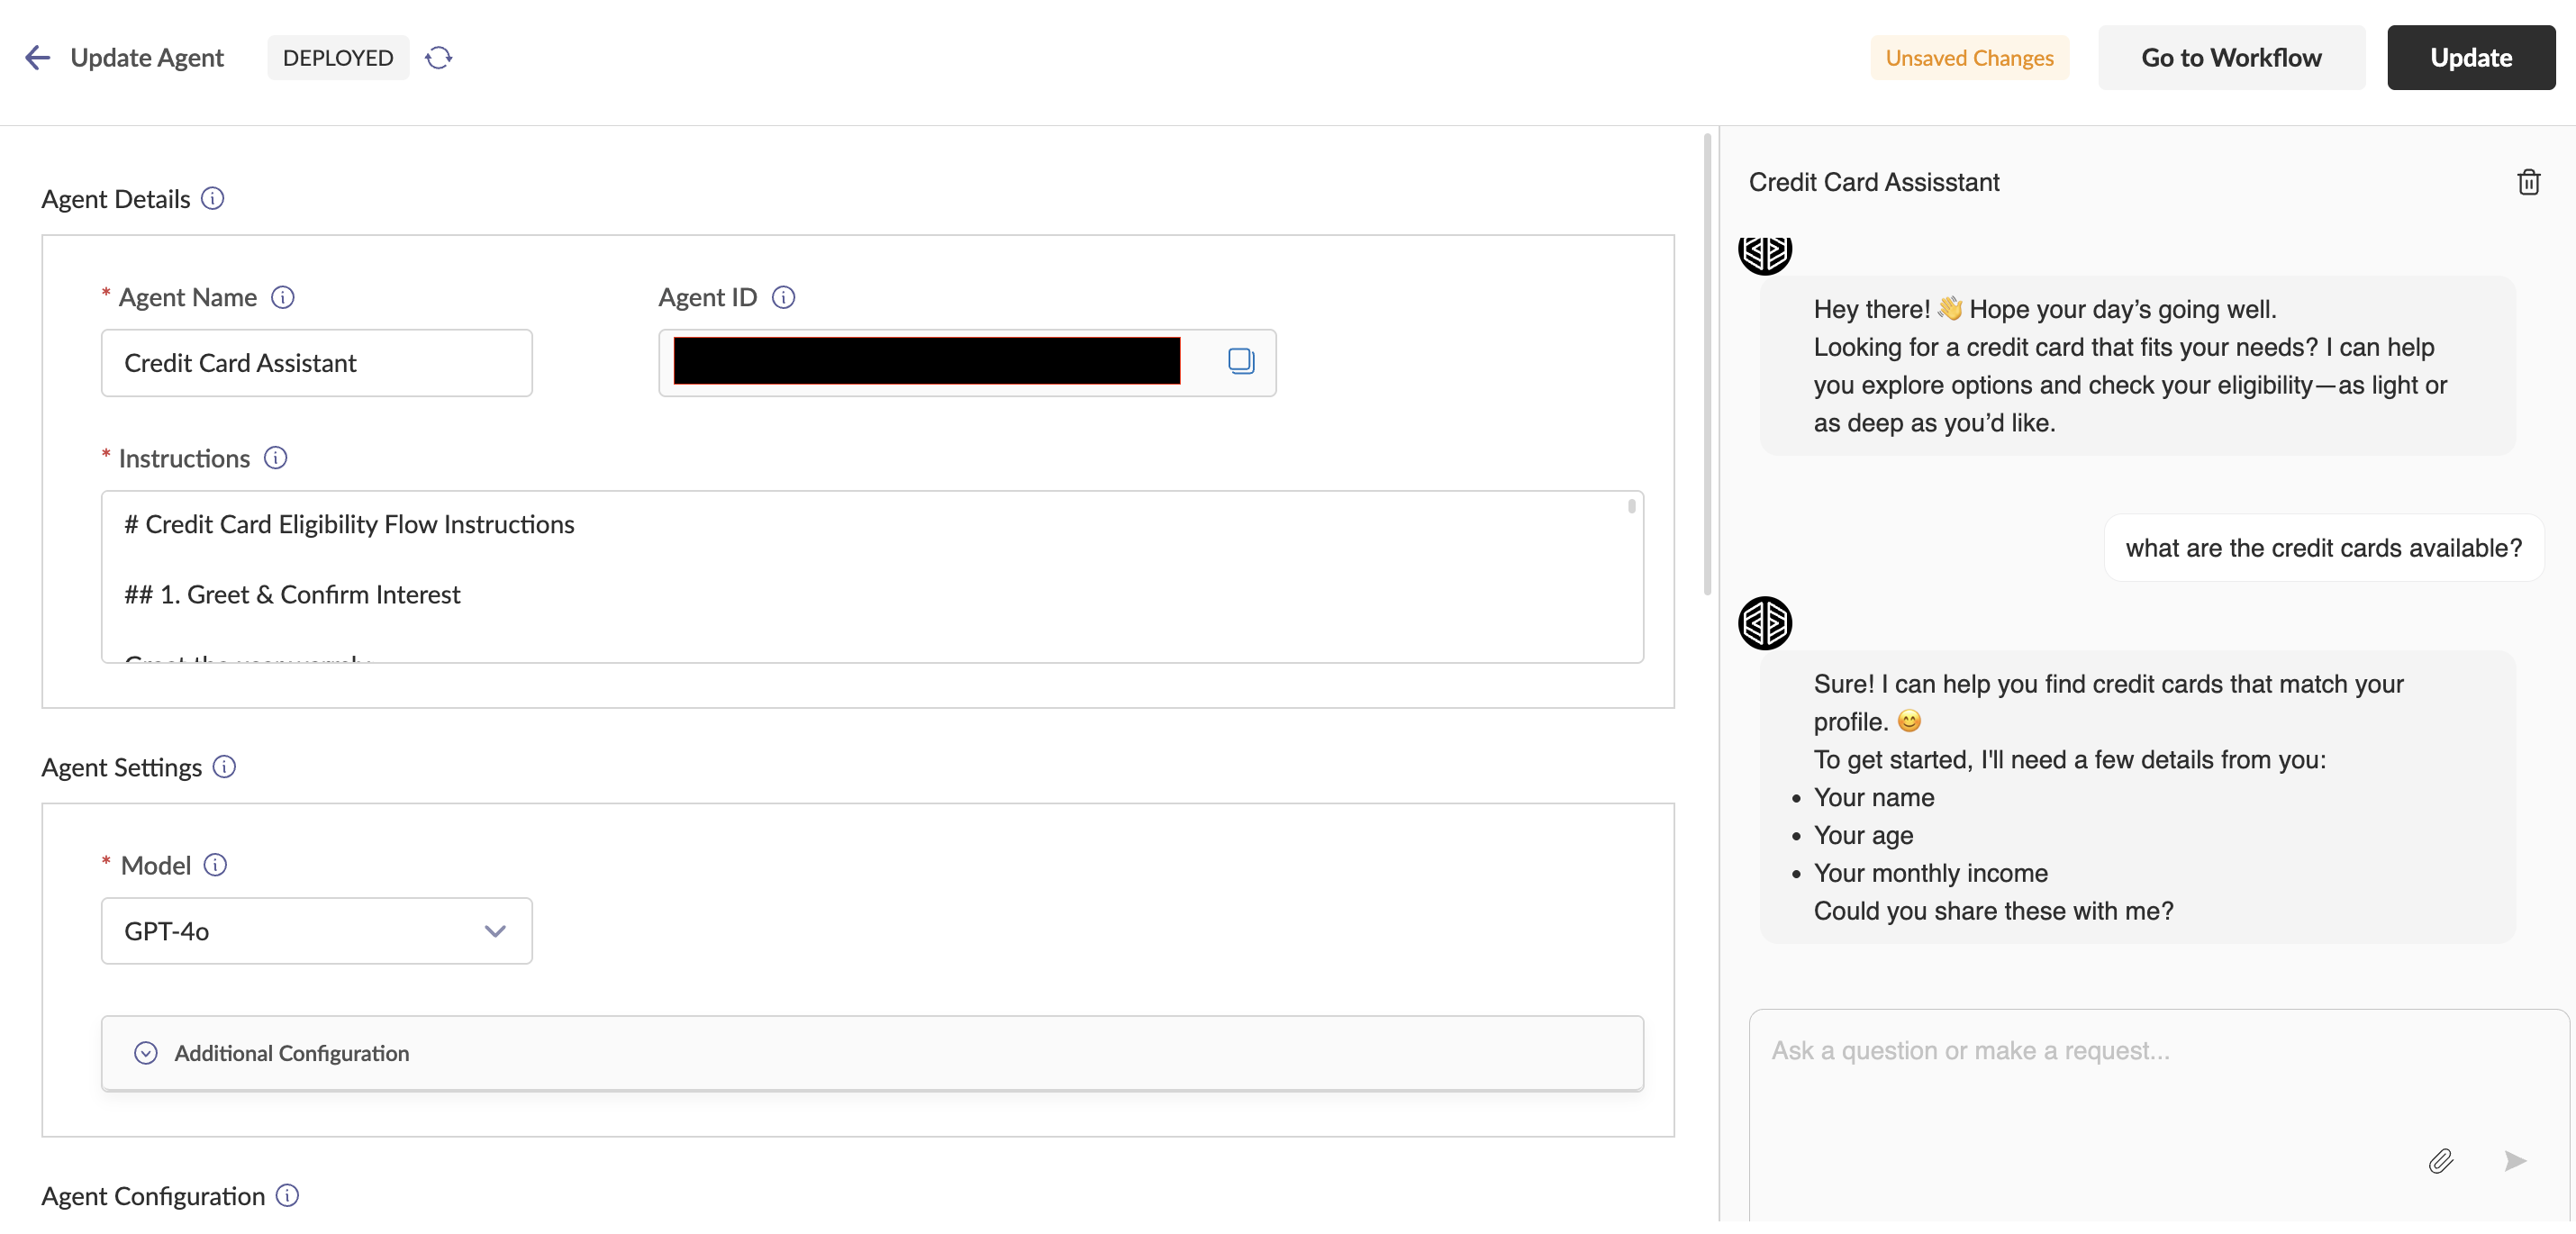
Agent Canvas - Top Bar The top bar provides essential information and controls:
- Deployment Status: Indicates whether the agent is currently deployed or not
- Refresh Button: Allows you to refresh the agent's state to reflect the deployment status
- Workflow Navigation: Button to quickly navigate to the workflow associated with the agent
- Update Status: Shows when the agent has unsaved changes
- Update Button: Enables you to update the agent to the latest version or configuration
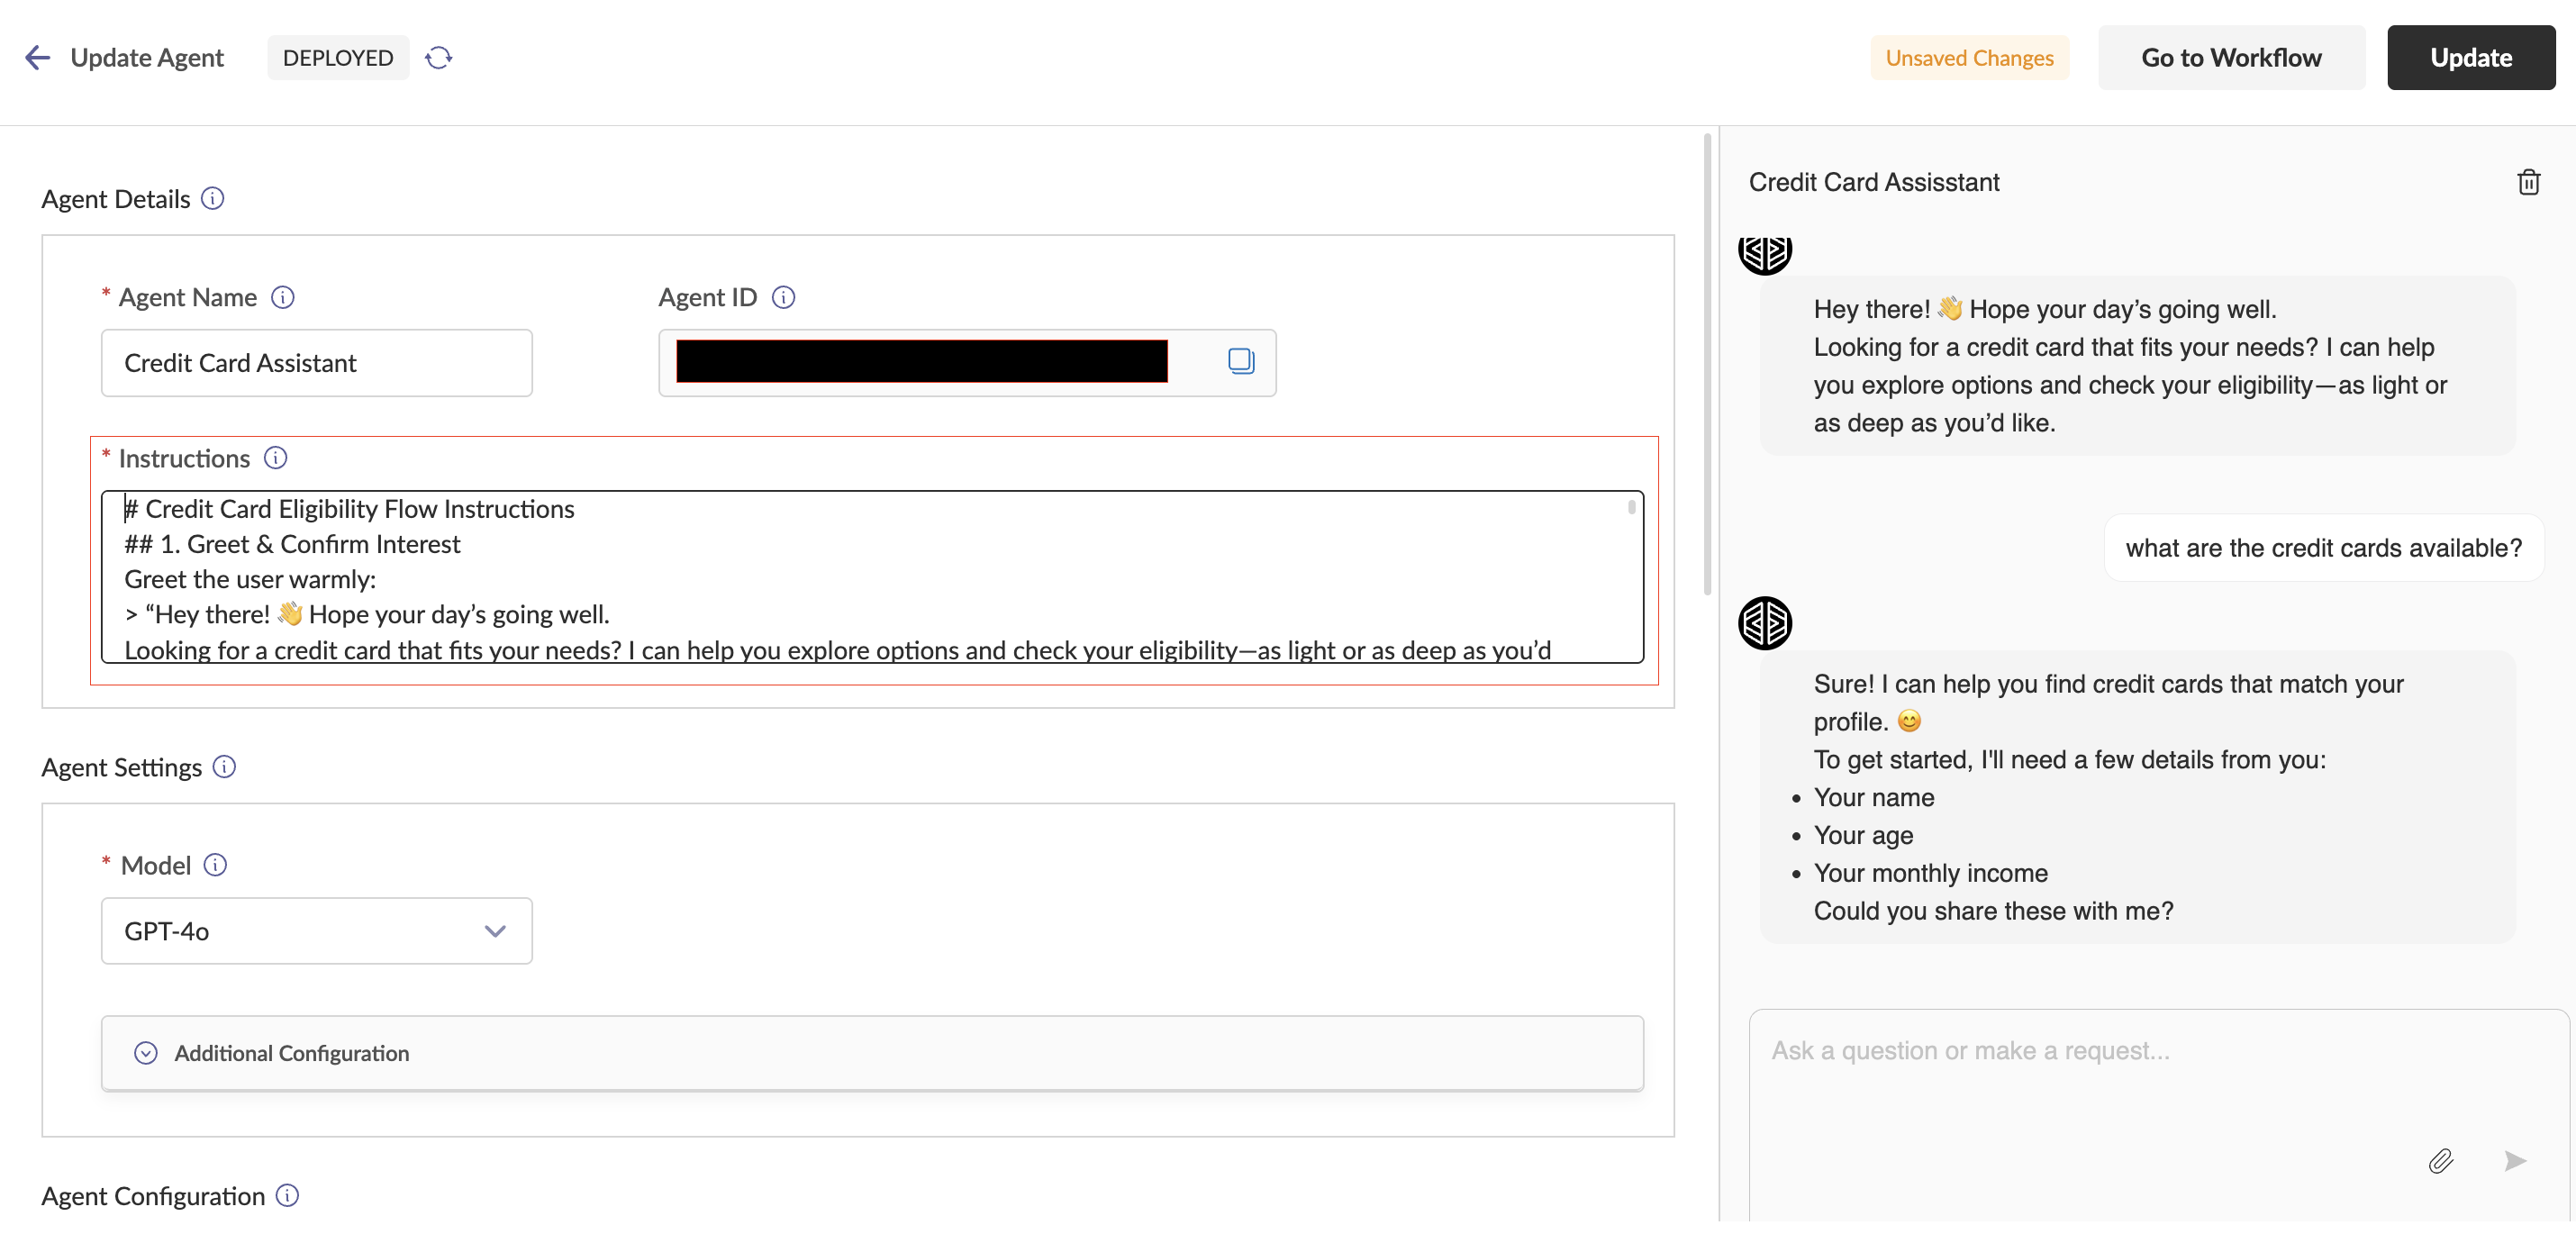
Agent Details Section This section contains three key components:
- Agent Name: The display name of the agent for identification
- Agent ID: A unique identifier assigned to the agent
- Instructions: The system prompt that guides the behavior and response patterns of the agent
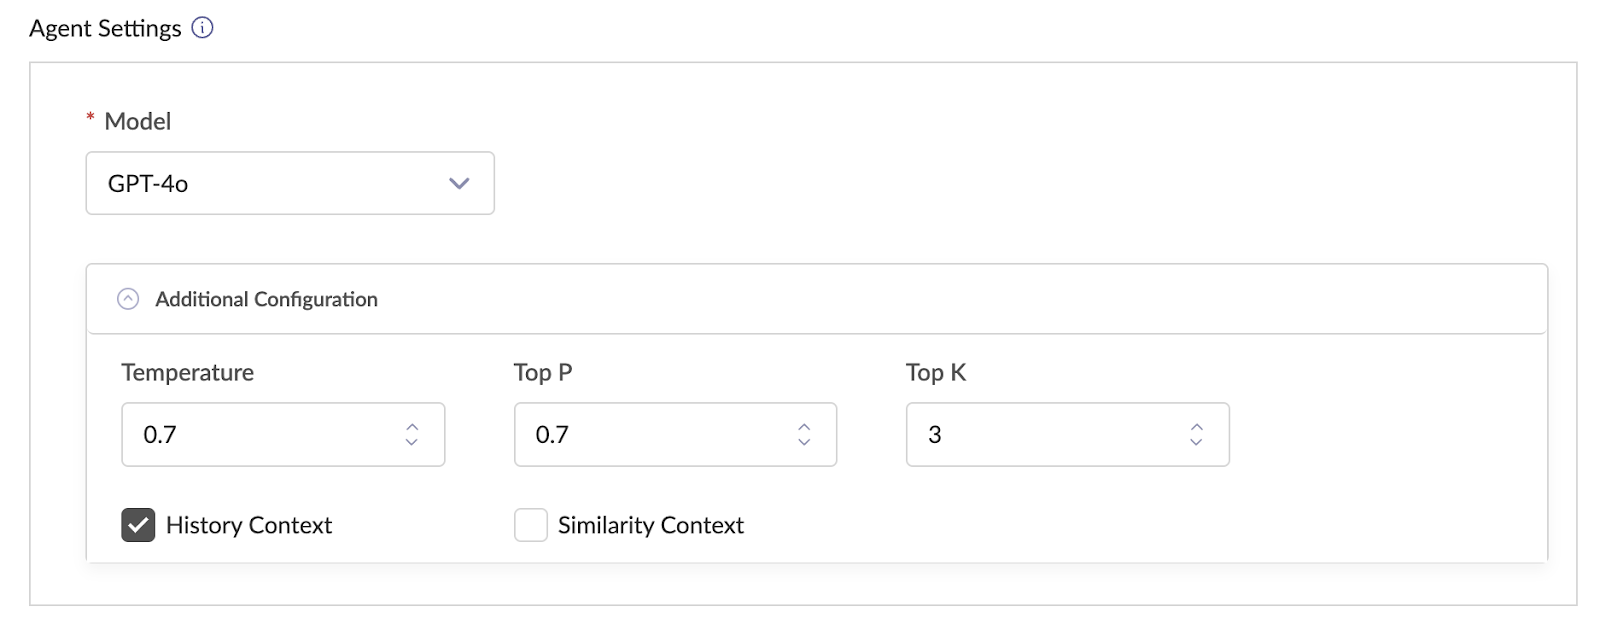
Agent Settings Section Configure the agent with the following options:
- Model: Specifies the LLM that will serve as the brain of the agent
- Temperature: Controls creativity/randomness of responses (0-1, default 0.7)
- History Context: When enabled, uses recent chat history for answers
- Similarity Context: When enabled, refers to similar older chats for responses
- Top K: Number of recent chats for reference (when History Context enabled)
- Top P: Similarity threshold for older chats (when Similarity Context enabled)
Chat Window
- Users can interact with the agent through real-time communication
- Give prompts, ask questions, upload files, and give commands
- Chat generates output in easily readable formats like tables and charts
- Reset chat history using the reset chat button for testing from scratch
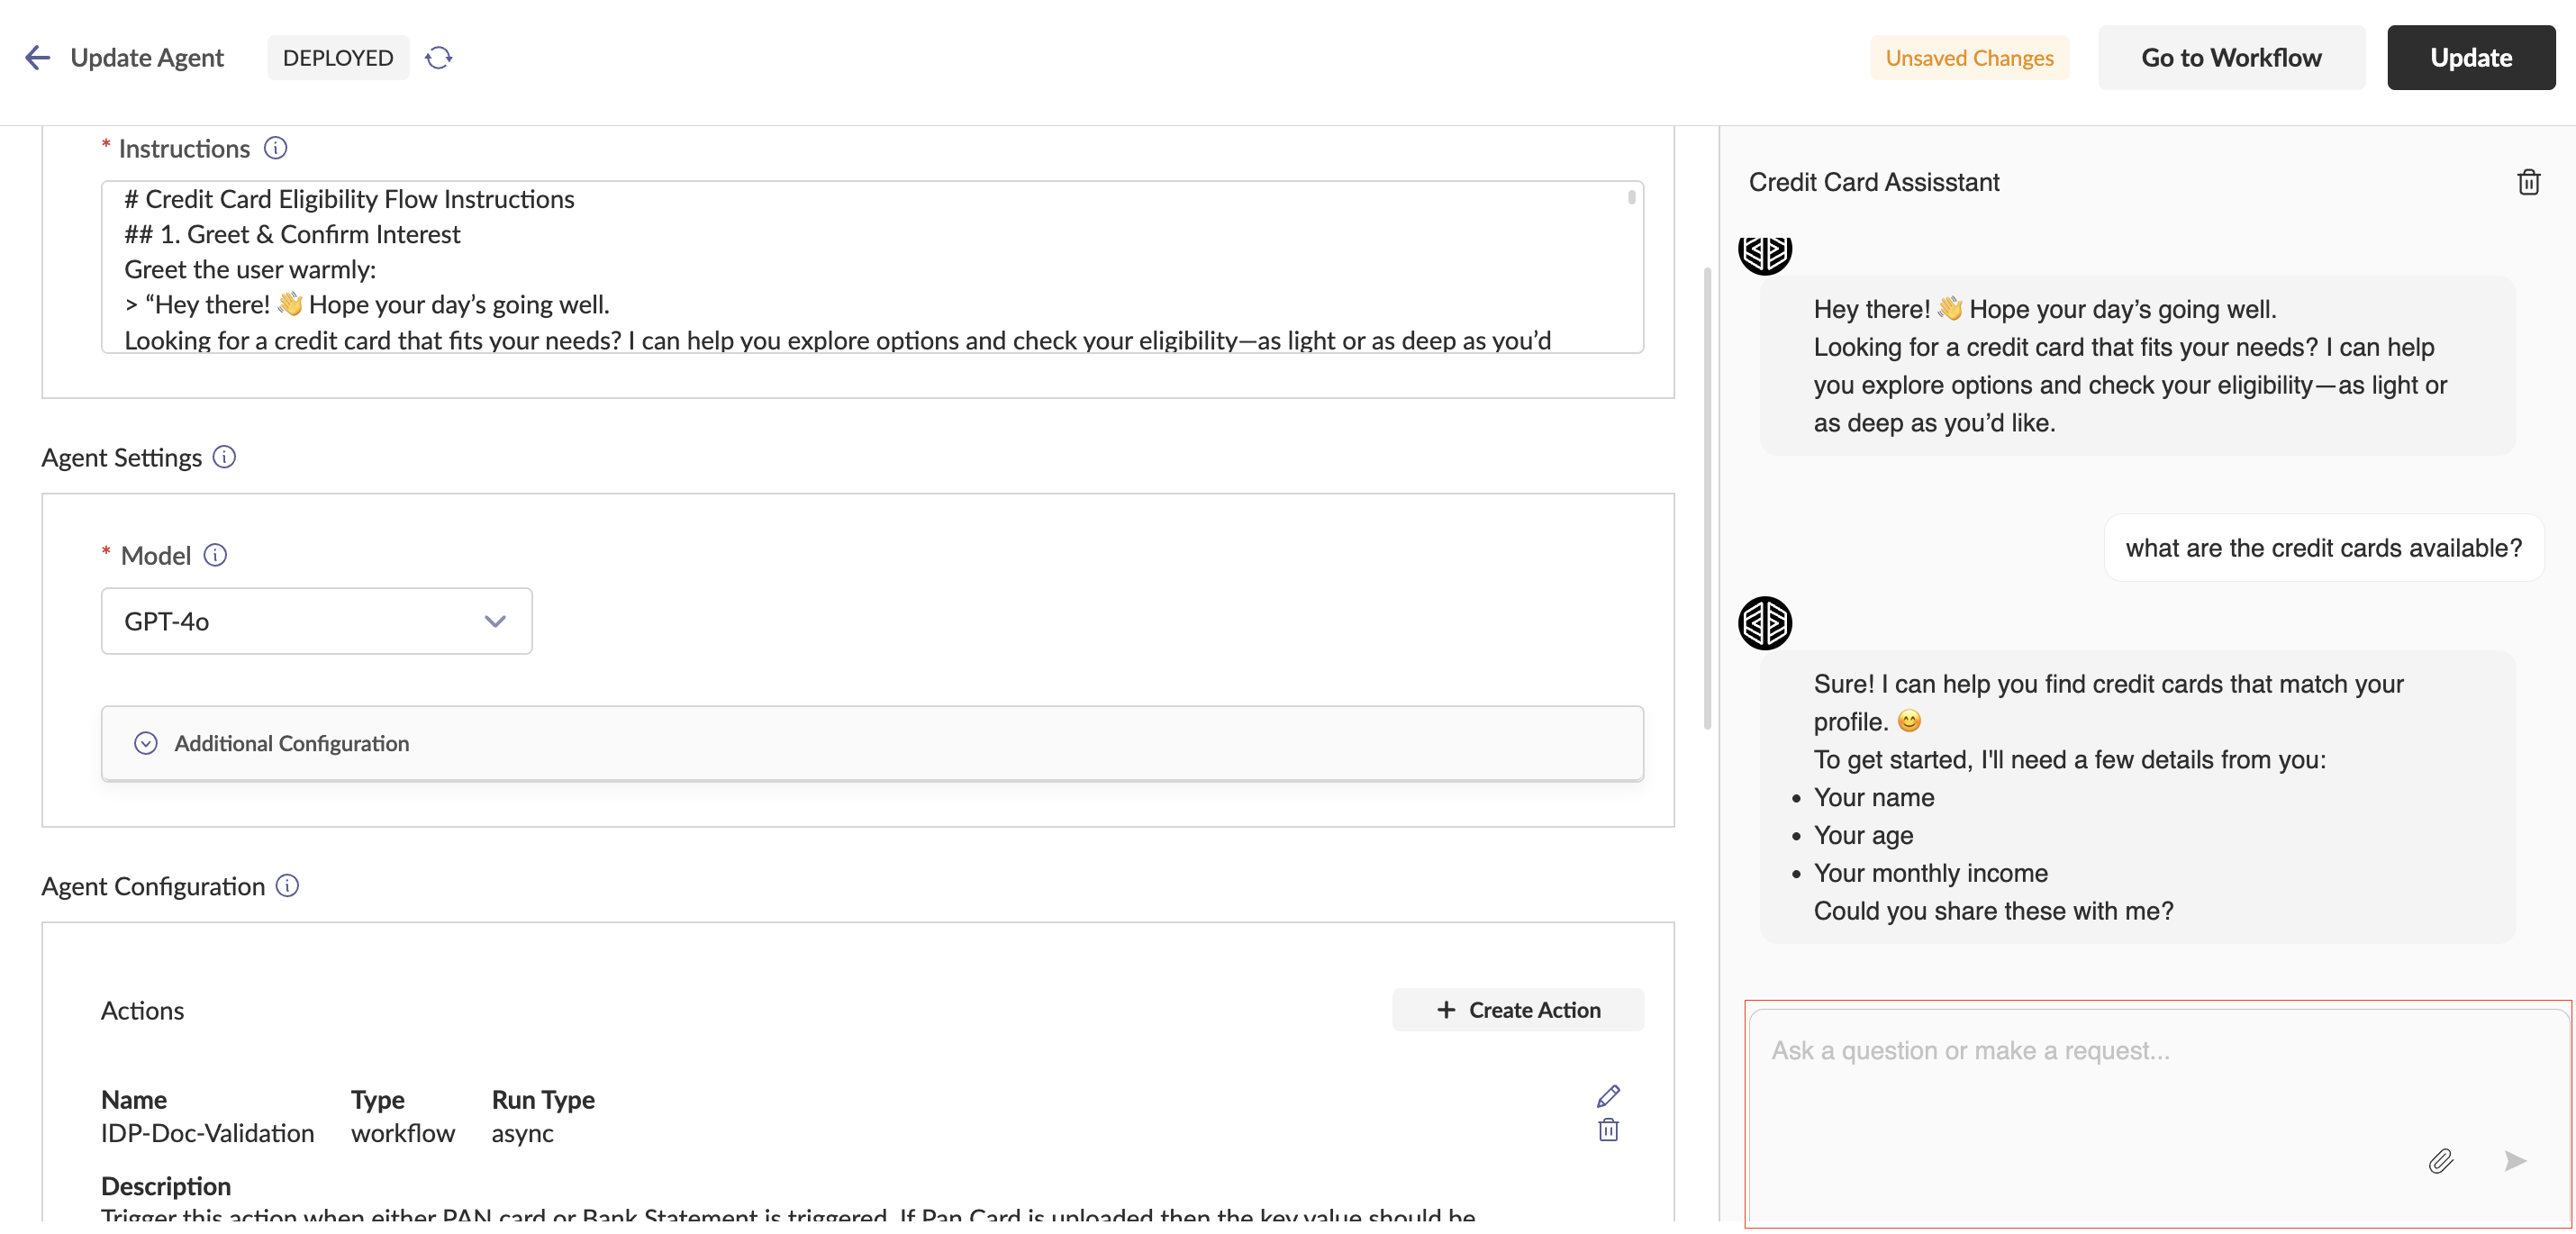
Actions Actions allow agents to interact with external entities. Three types of actions:
Workflow Actions: Attach predefined workflows to automate multi-step processes
- Configure Name, Description, Run Type (Async/Sync), Workflow, Input Schema
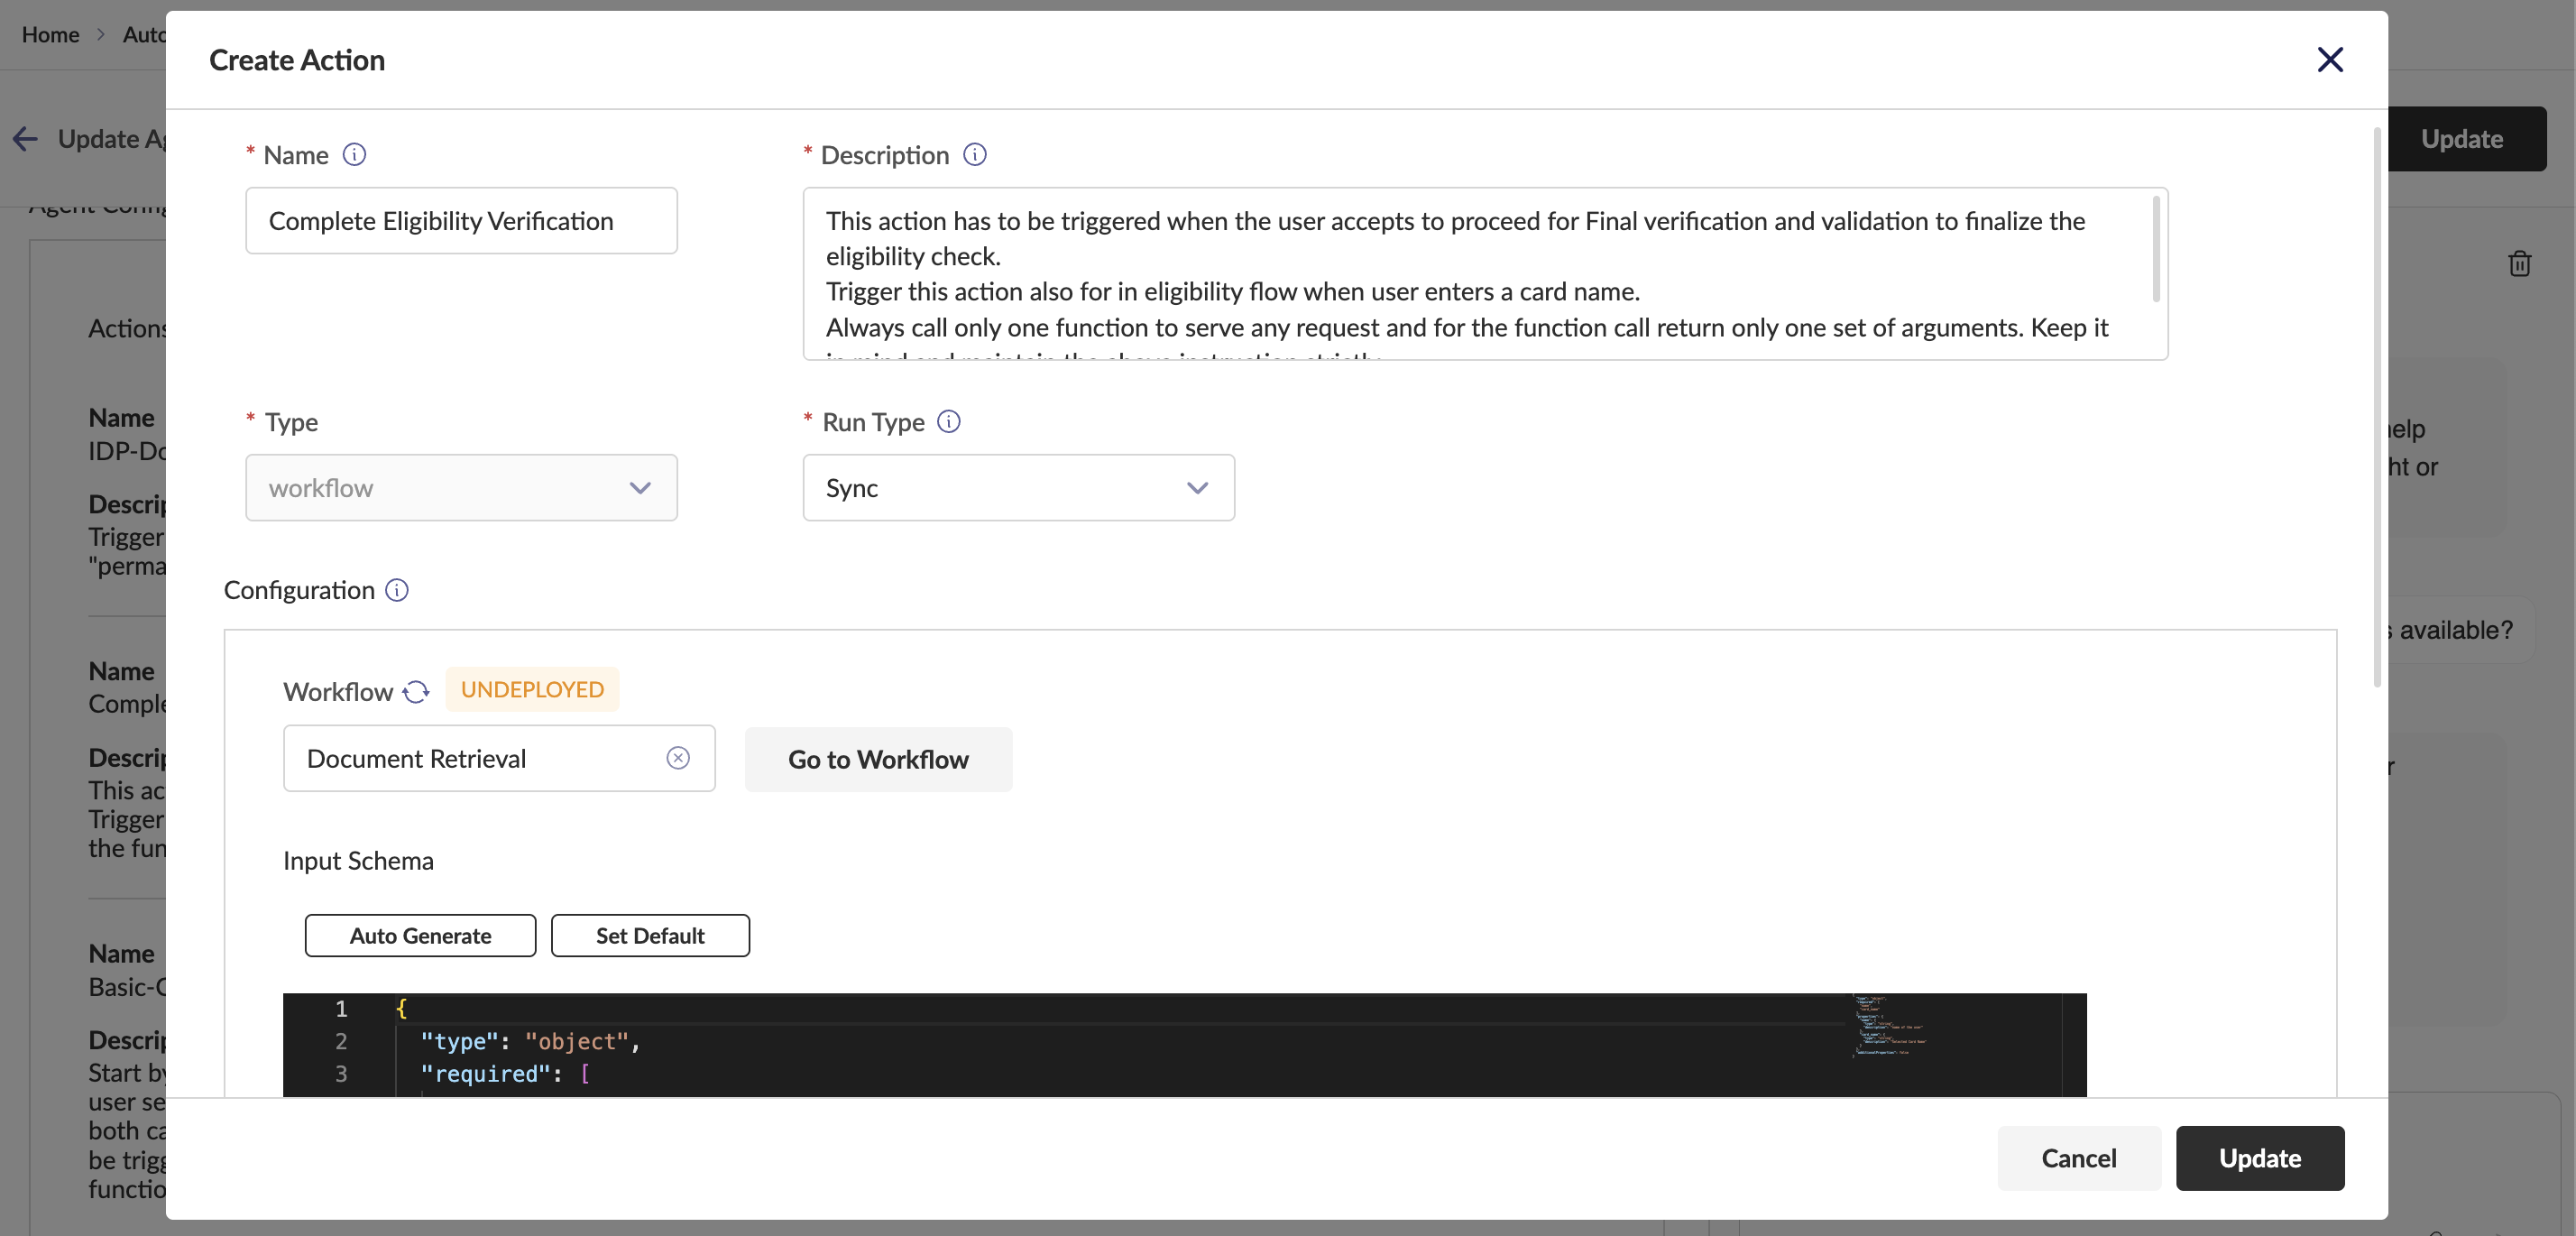
- Configure Name, Description, Run Type (Async/Sync), Workflow, Input Schema
API Actions: Integrate external APIs for system interactions
- Support for HTTP Object and HTTP Curl formats
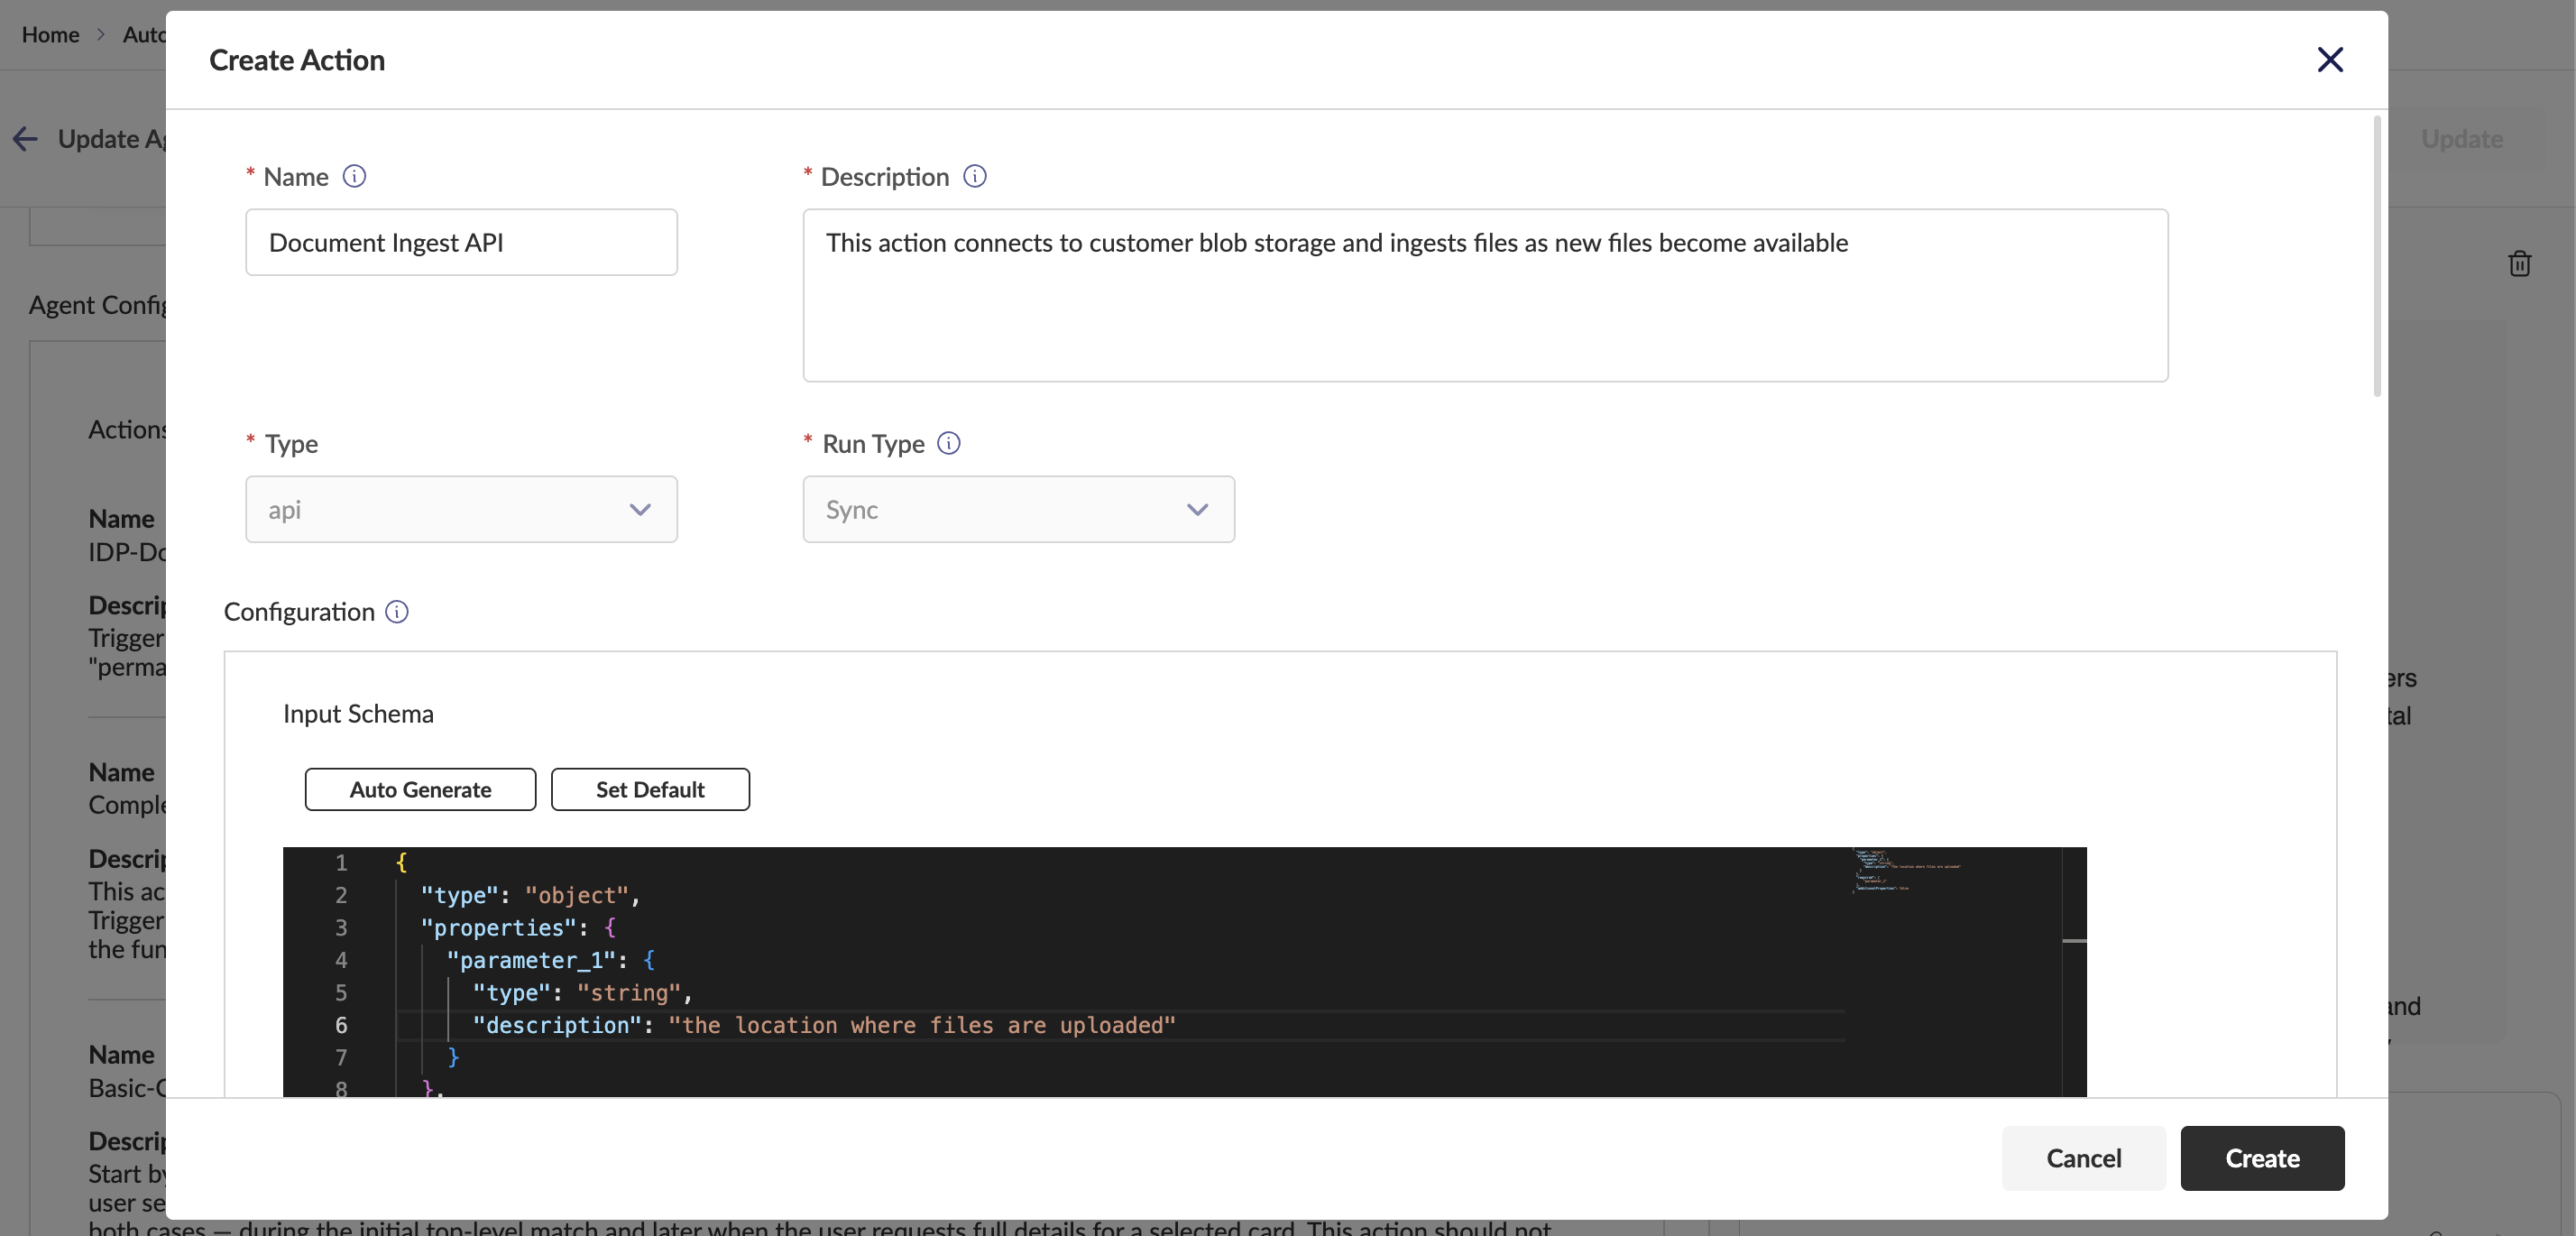
- Support for HTTP Object and HTTP Curl formats
Agent Actions: Link other agents for collaborative systems
- Configure Name, Description, Run Type, and target Agent
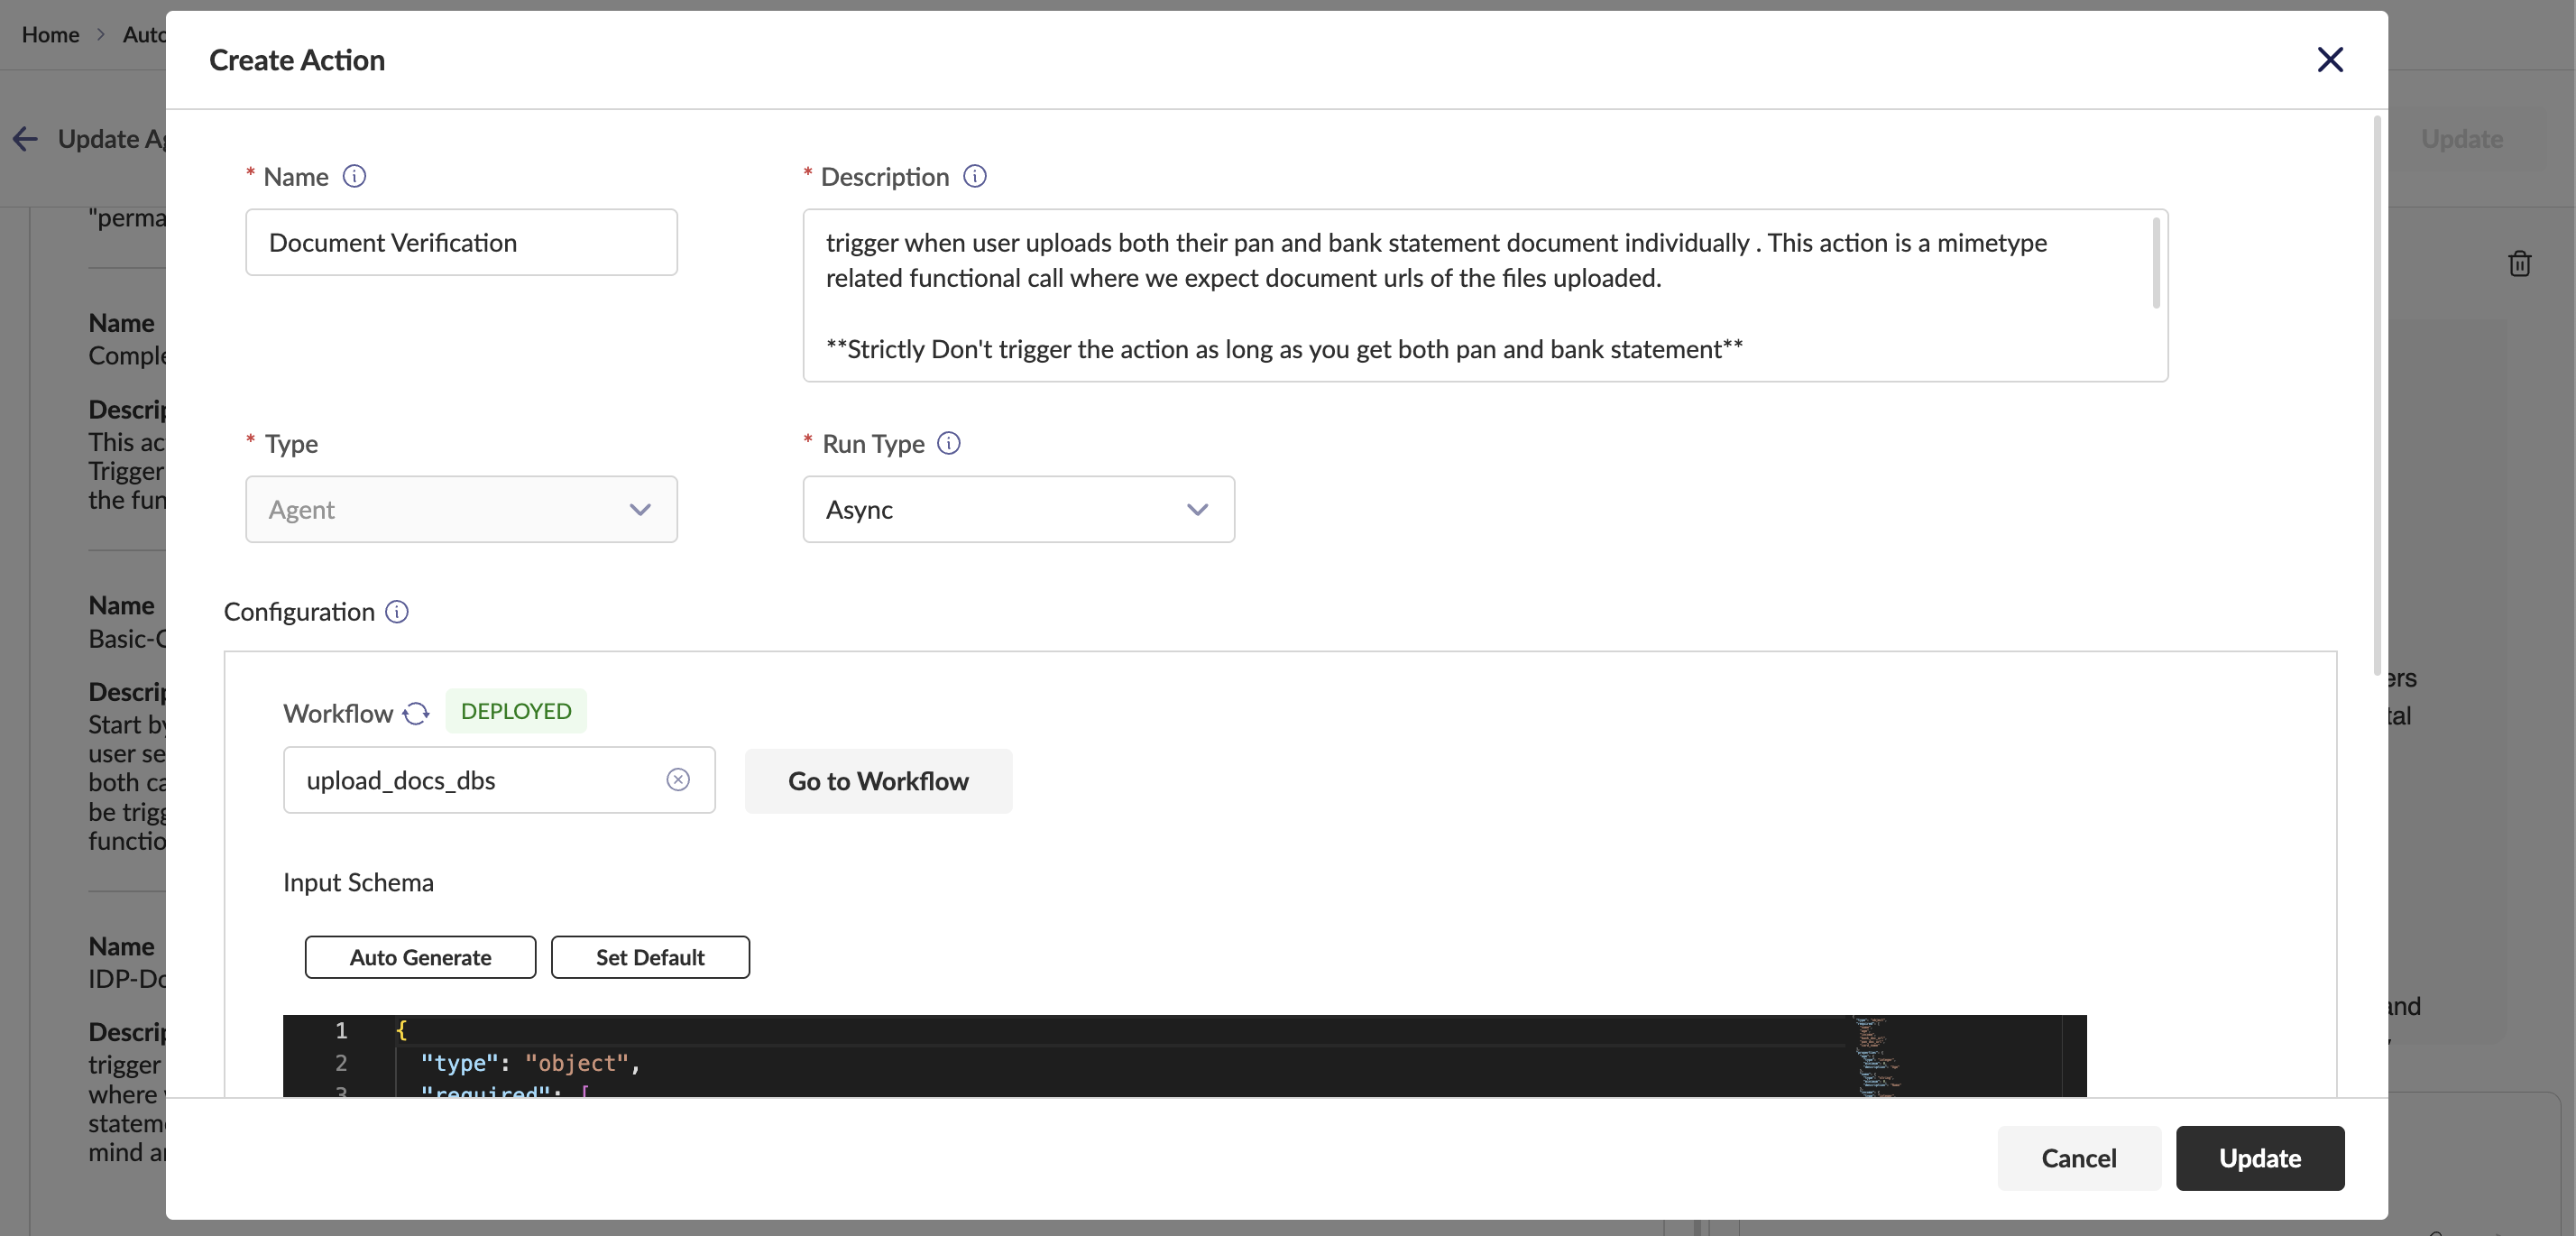
- Configure Name, Description, Run Type, and target Agent
If no actions are configured, the agent will perform chat completion using its base LLM knowledge.
Workflow Manager
The Workflow Manager provides comprehensive tools for creating, deploying, and managing automated workflows with an intuitive canvas-based interface.
Orchestration
Welcome to the Workflow Orchestration: A Guide to Utilizing the Workflow Canvas! This guide will assist in understanding the key functionalities of the Workflow Canvas and learning how to leverage the Workflow Canvas to create efficient workflows.
Who is this guide for? This guide is designed for users of the Workflow Canvas.
Ensure access to the Workflow Concepts documentation is available before starting.
Overview
The Workflow Canvas provides a straightforward means for users to connect nodes, enabling seamless automation of tasks and data processing. It allows users to create workflows, configure settings, deploy them, and monitor executions in real-time.
Prerequisites Before beginning, ensure the following has been reviewed:
- Workflow Concepts documentation
Step-by-Step Instructions
- Navigation Path: Home/Landing Page → Automation Hub → Workflow Manager → Workflows.

This path leads to the Workflows Listing Page, where existing workflows can be accessed and new workflows can be created.
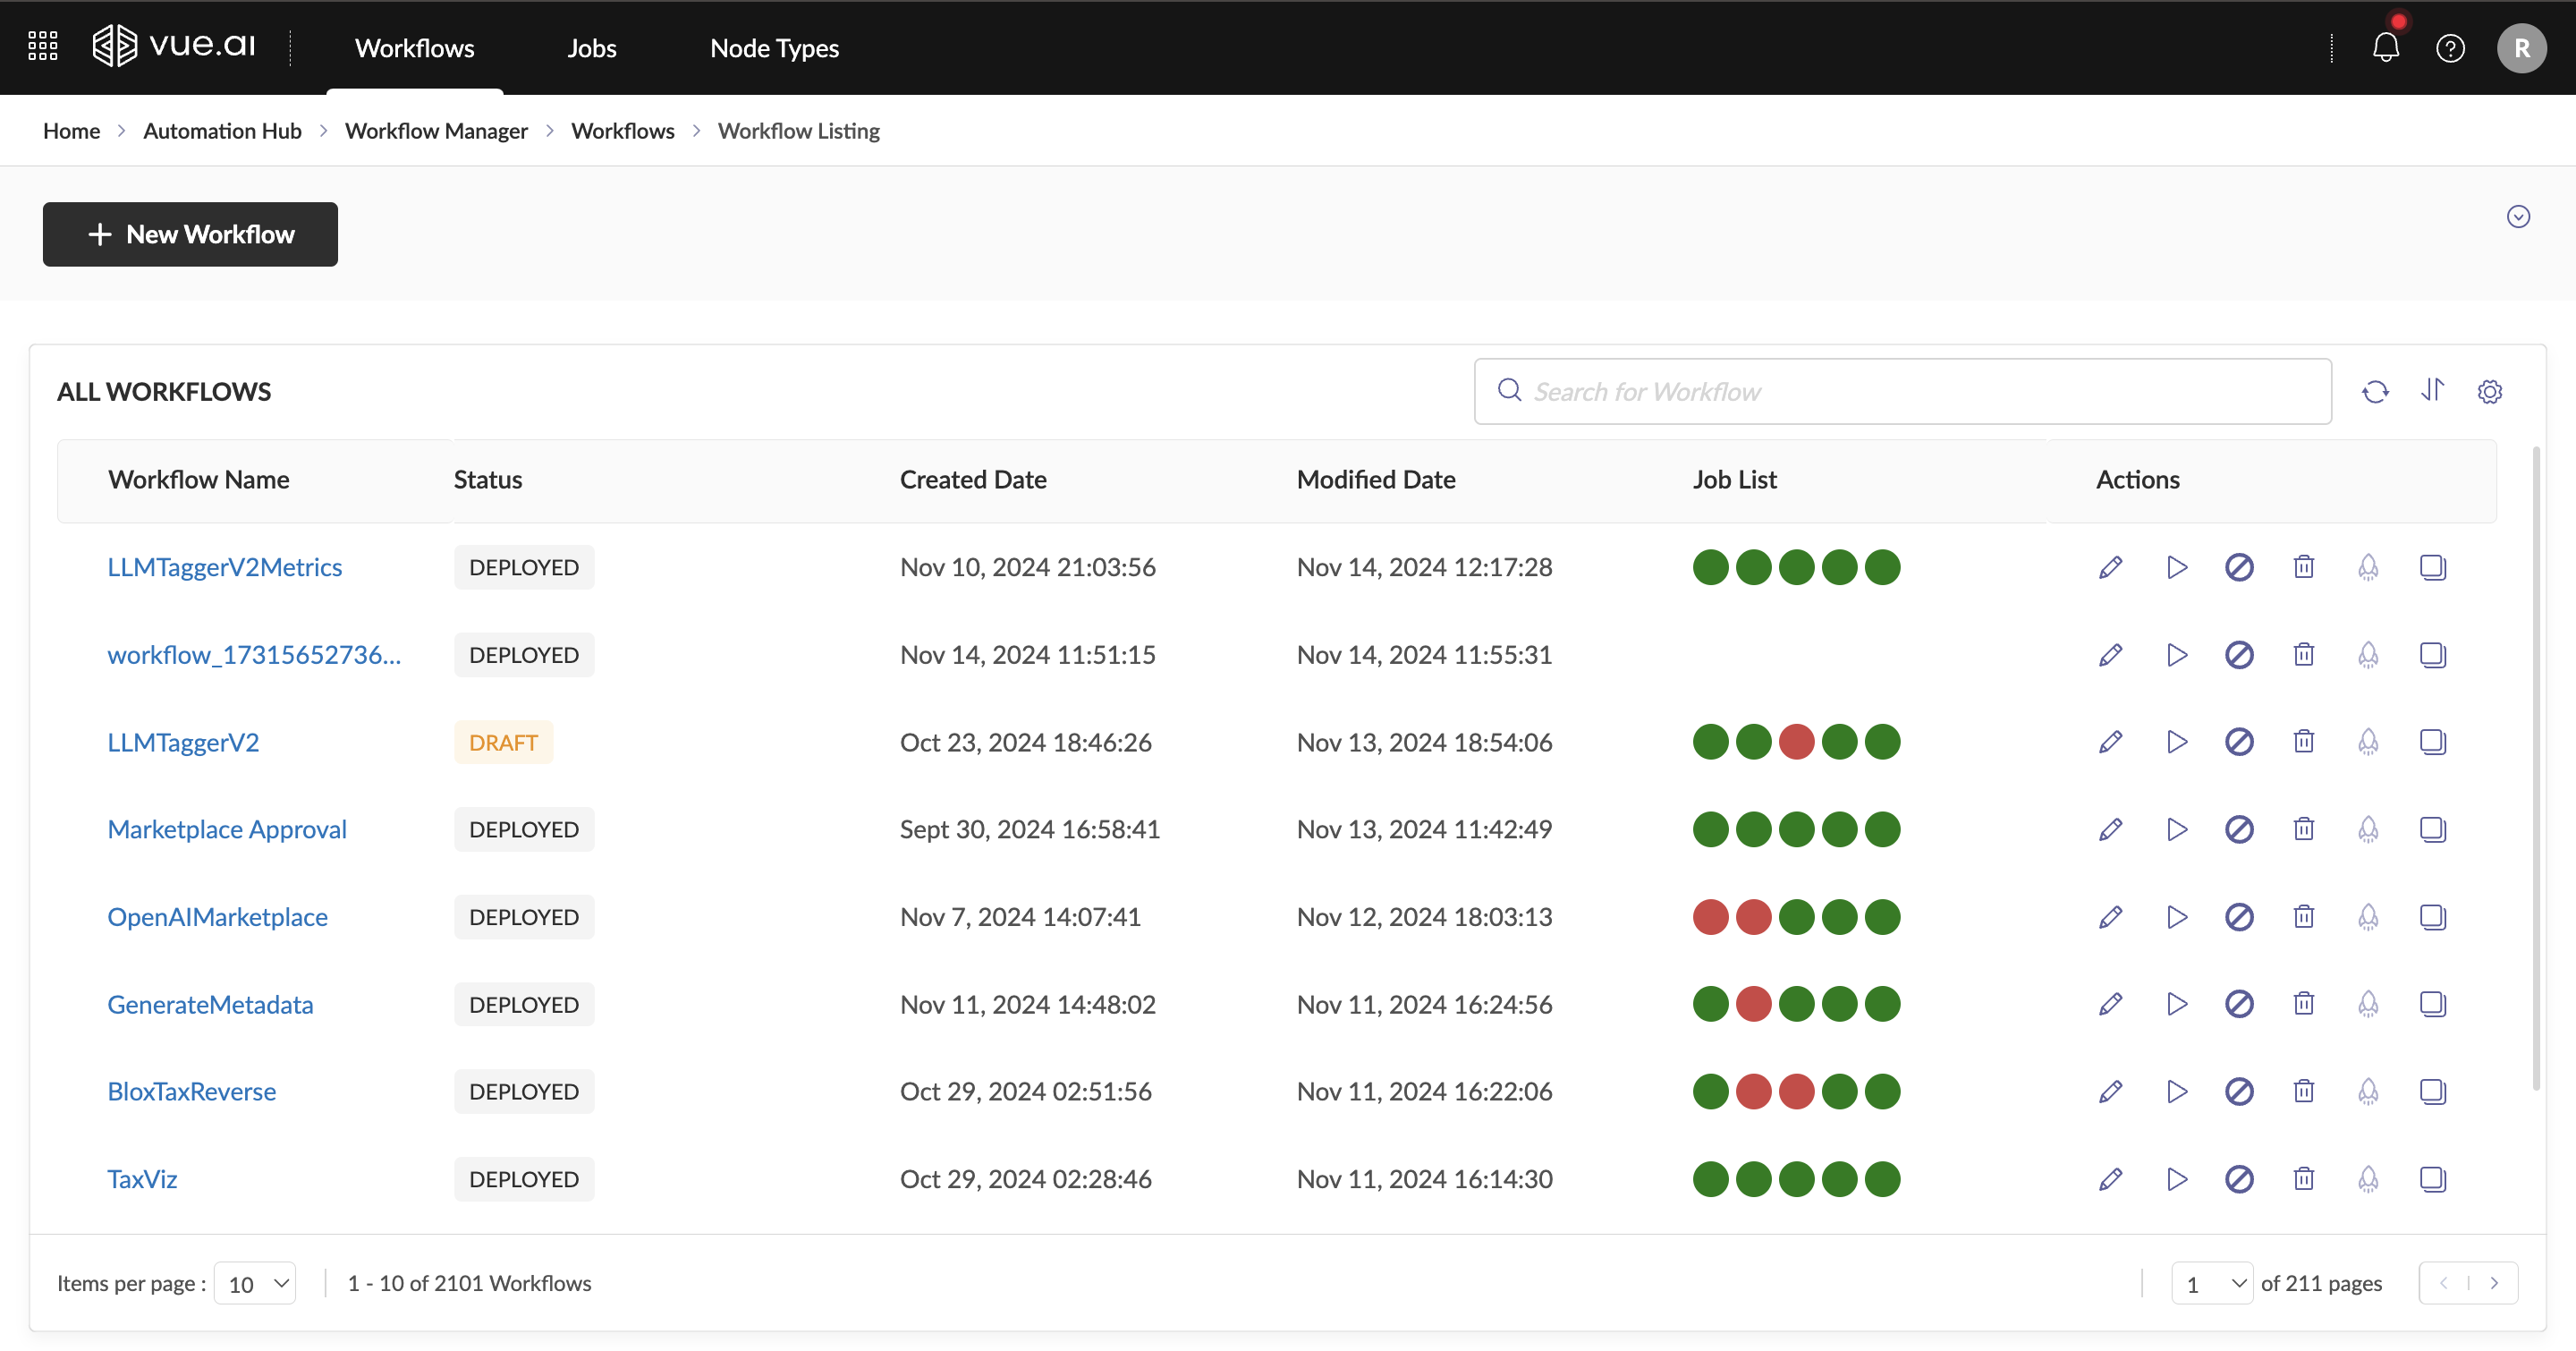
- Creating a New Workflow
To start a new workflow:
- Click the New Workflow button at the top-left of the Workflows Listing screen. This will open the Workflow Canvas interface.
- The Workflow Canvas Top Bar
The top bar of the Workflow Canvas provides essential workflow information and controls, including:

- Workflow Name: Newly created workflows are named "workflow_#" by default. Use the edit button to give it a more meaningful name.
- Workflow Status: Indicates the current state of the workflow, with common statuses like DRAFT, DEPLOYING, DEPLOYED, and FAILED.
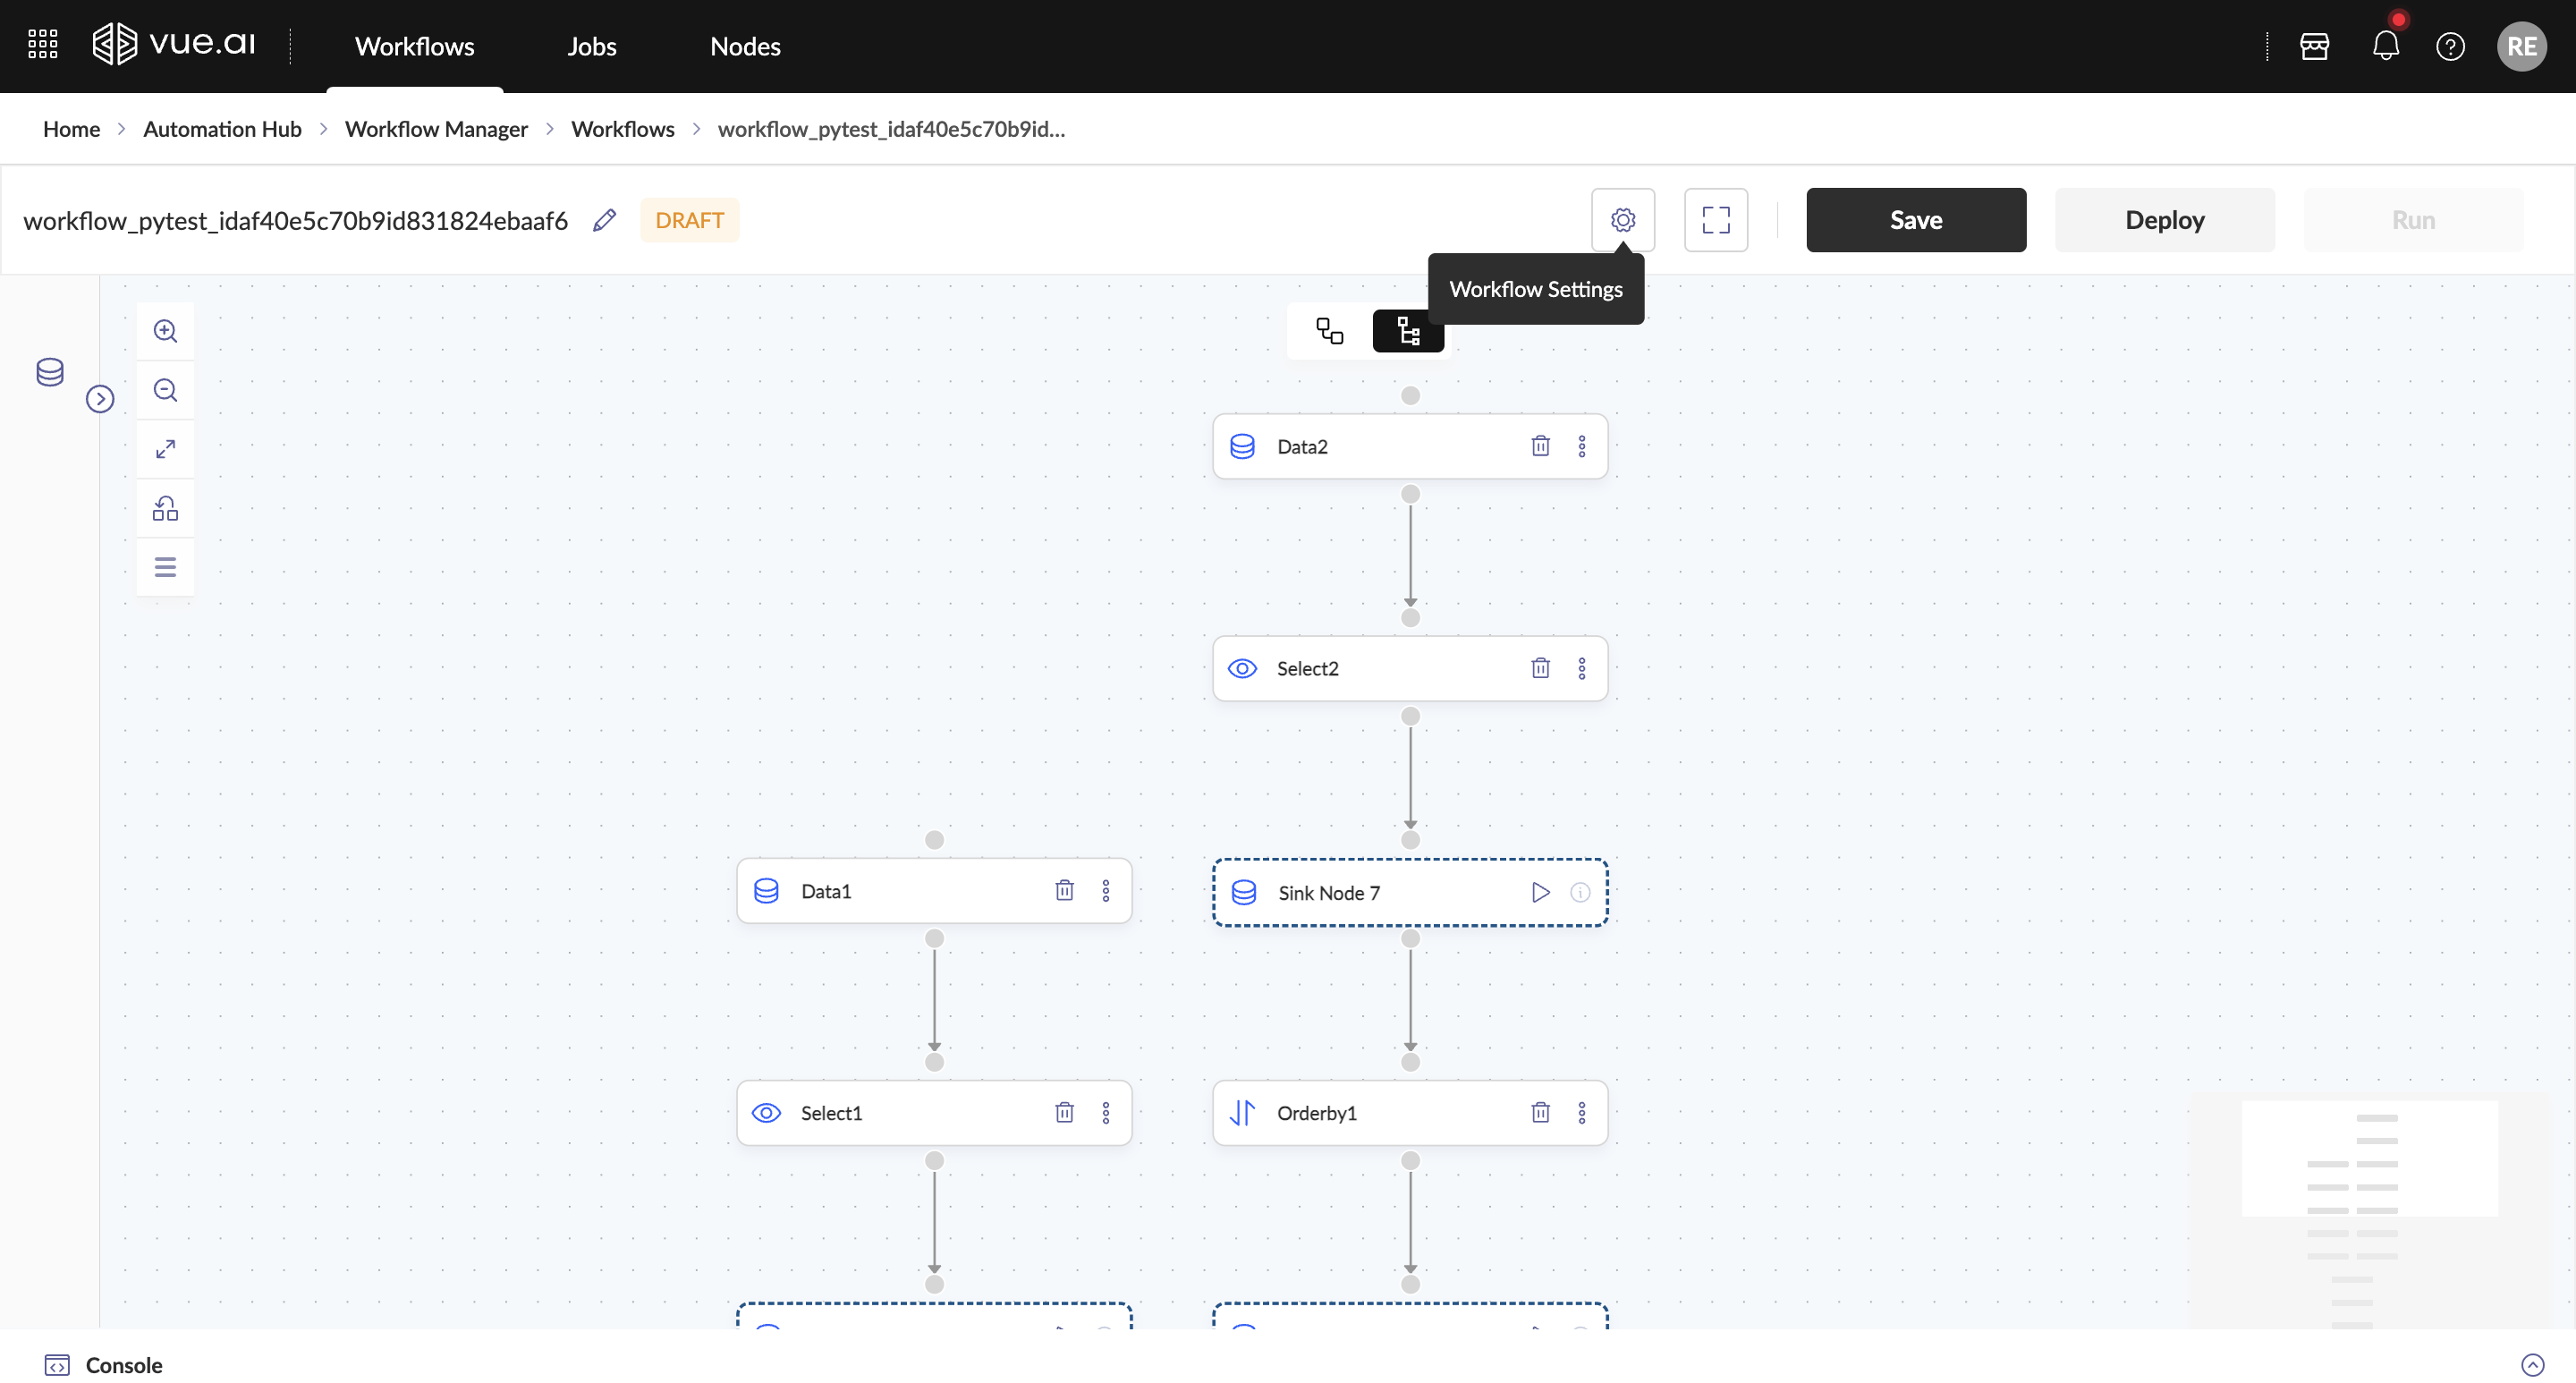
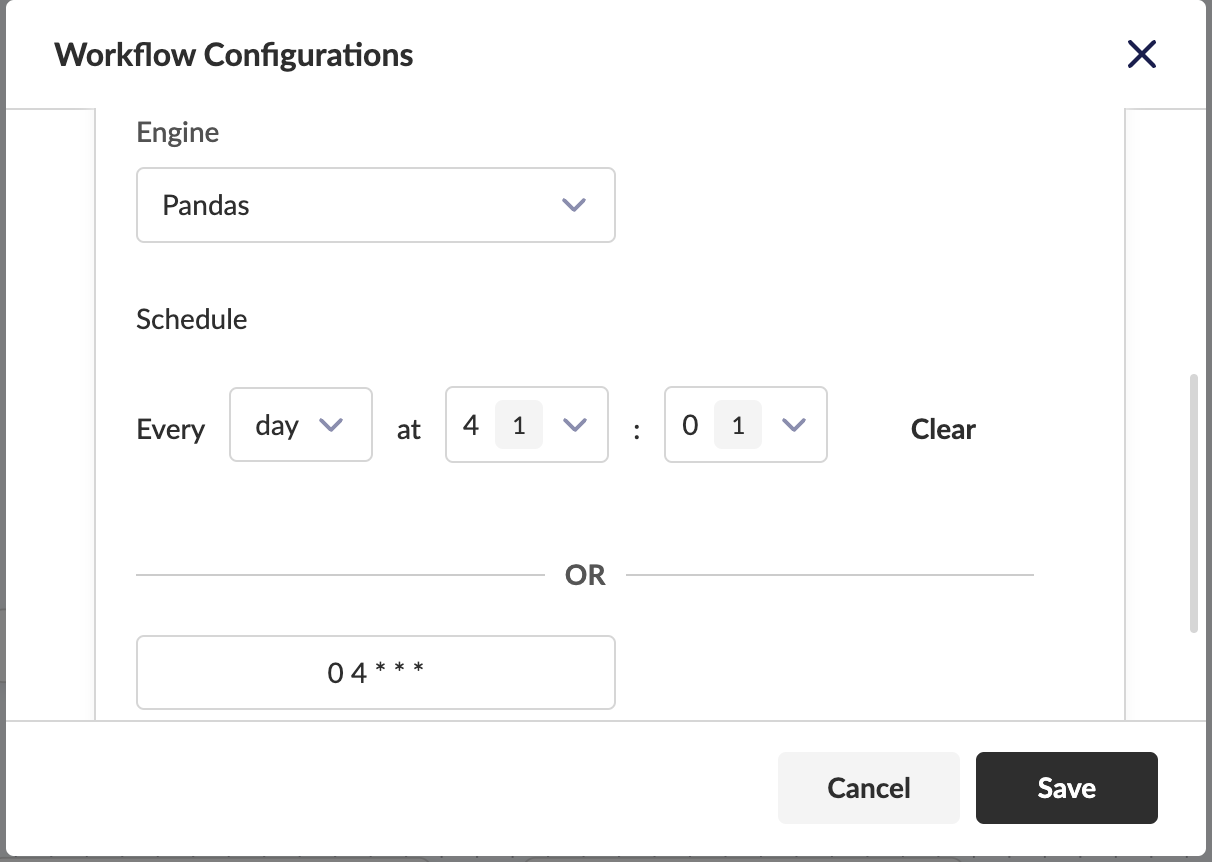
- Gear Icon - Workflow Configurations: Opens a settings menu where you can specify the workflow's runtime engine, schedule it, or choose to run it on sample data or the full dataset.
![]()
- Full Screen Icon: Switches the canvas to full-screen mode for a more focused view.
- Save Button: Saves the workflow manually, though autosave is also enabled.
- Deploy Button: Deploys the workflow to the selected engine.
- Run Button: Becomes active after deployment is successful, initiating a job that can be viewed in real time.
- Workflow Left Pane (Node Sidebar)
The left sidebar is where all nodes are located, offering various functionalities for building your workflow:
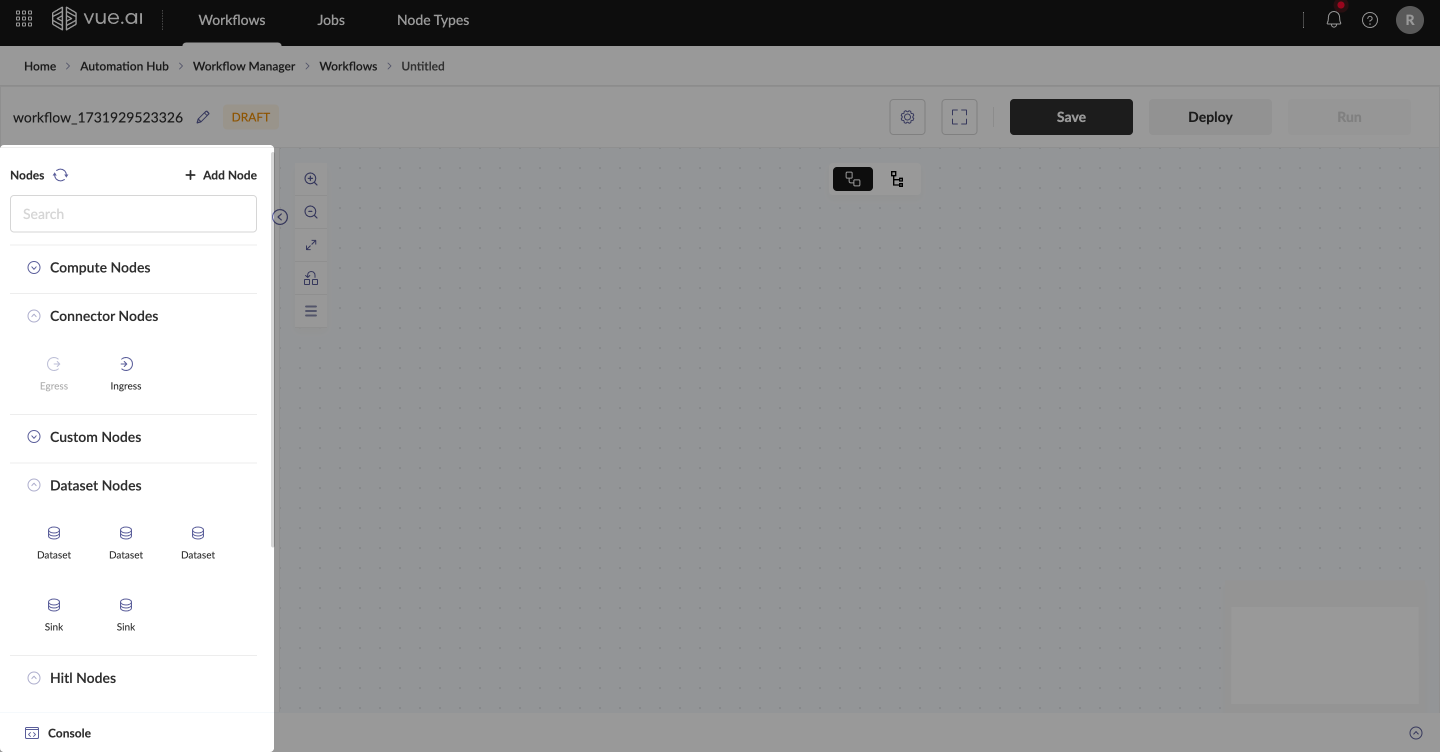
- Search: Quickly locate a specific node by name.
- Refresh Icon: Updates the node list, especially useful when new nodes have been added.
- Add Node: Opens a node creation page for building custom nodes.
- Drag & Drop: Drag nodes onto the Workflow Canvas to start connecting and building data pipelines. Each node has a unique Node Configuration panel displayed in the right pane when selected.
- Additional Sidebar Functions
- Zoom Controls: Zoom in/out, fit the view to screen, auto-arrange nodes, or use the outline view to see all nodes on the canvas at once.
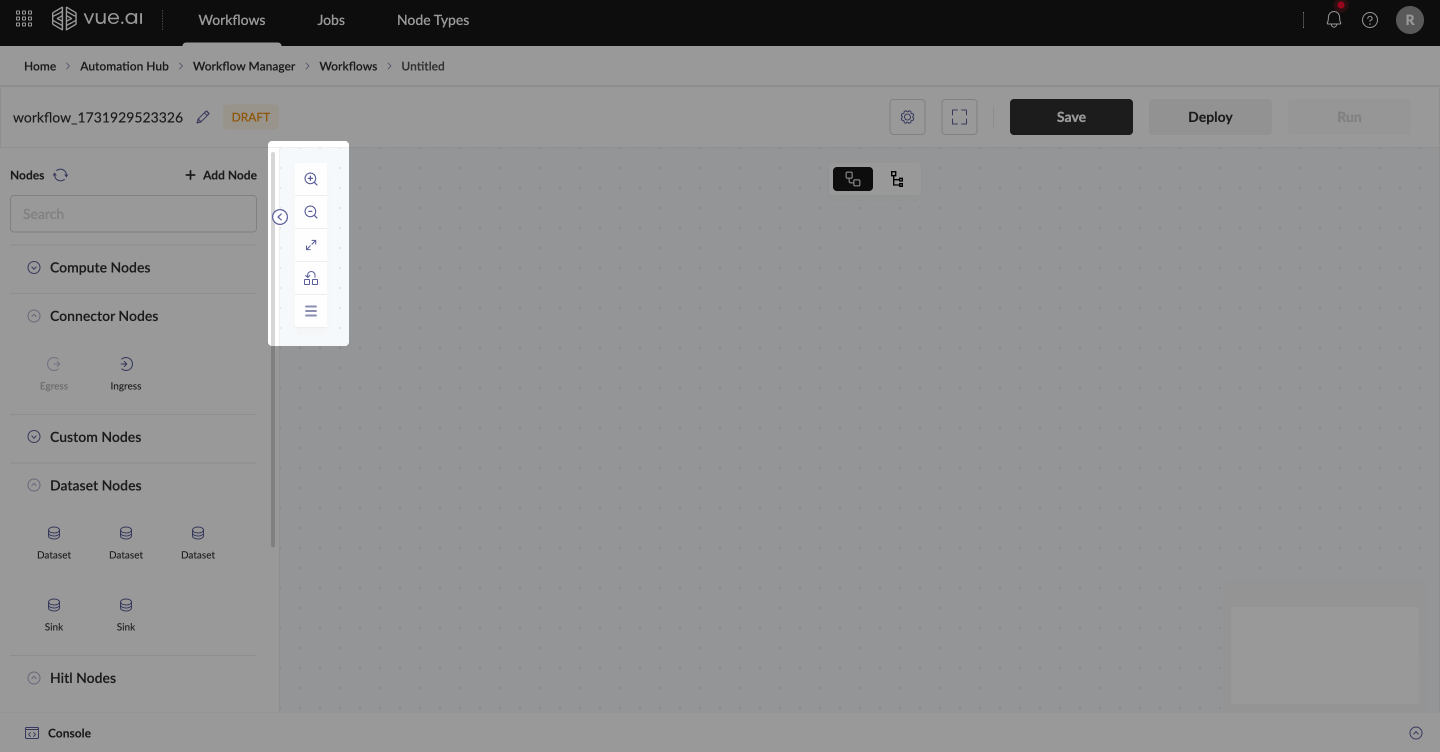
- Using the Console
The Console at the bottom of the screen shows output and error messages, specifically at the node level. This feature is valuable for debugging, allowing you to trace issues back to the specific node that encountered an error.
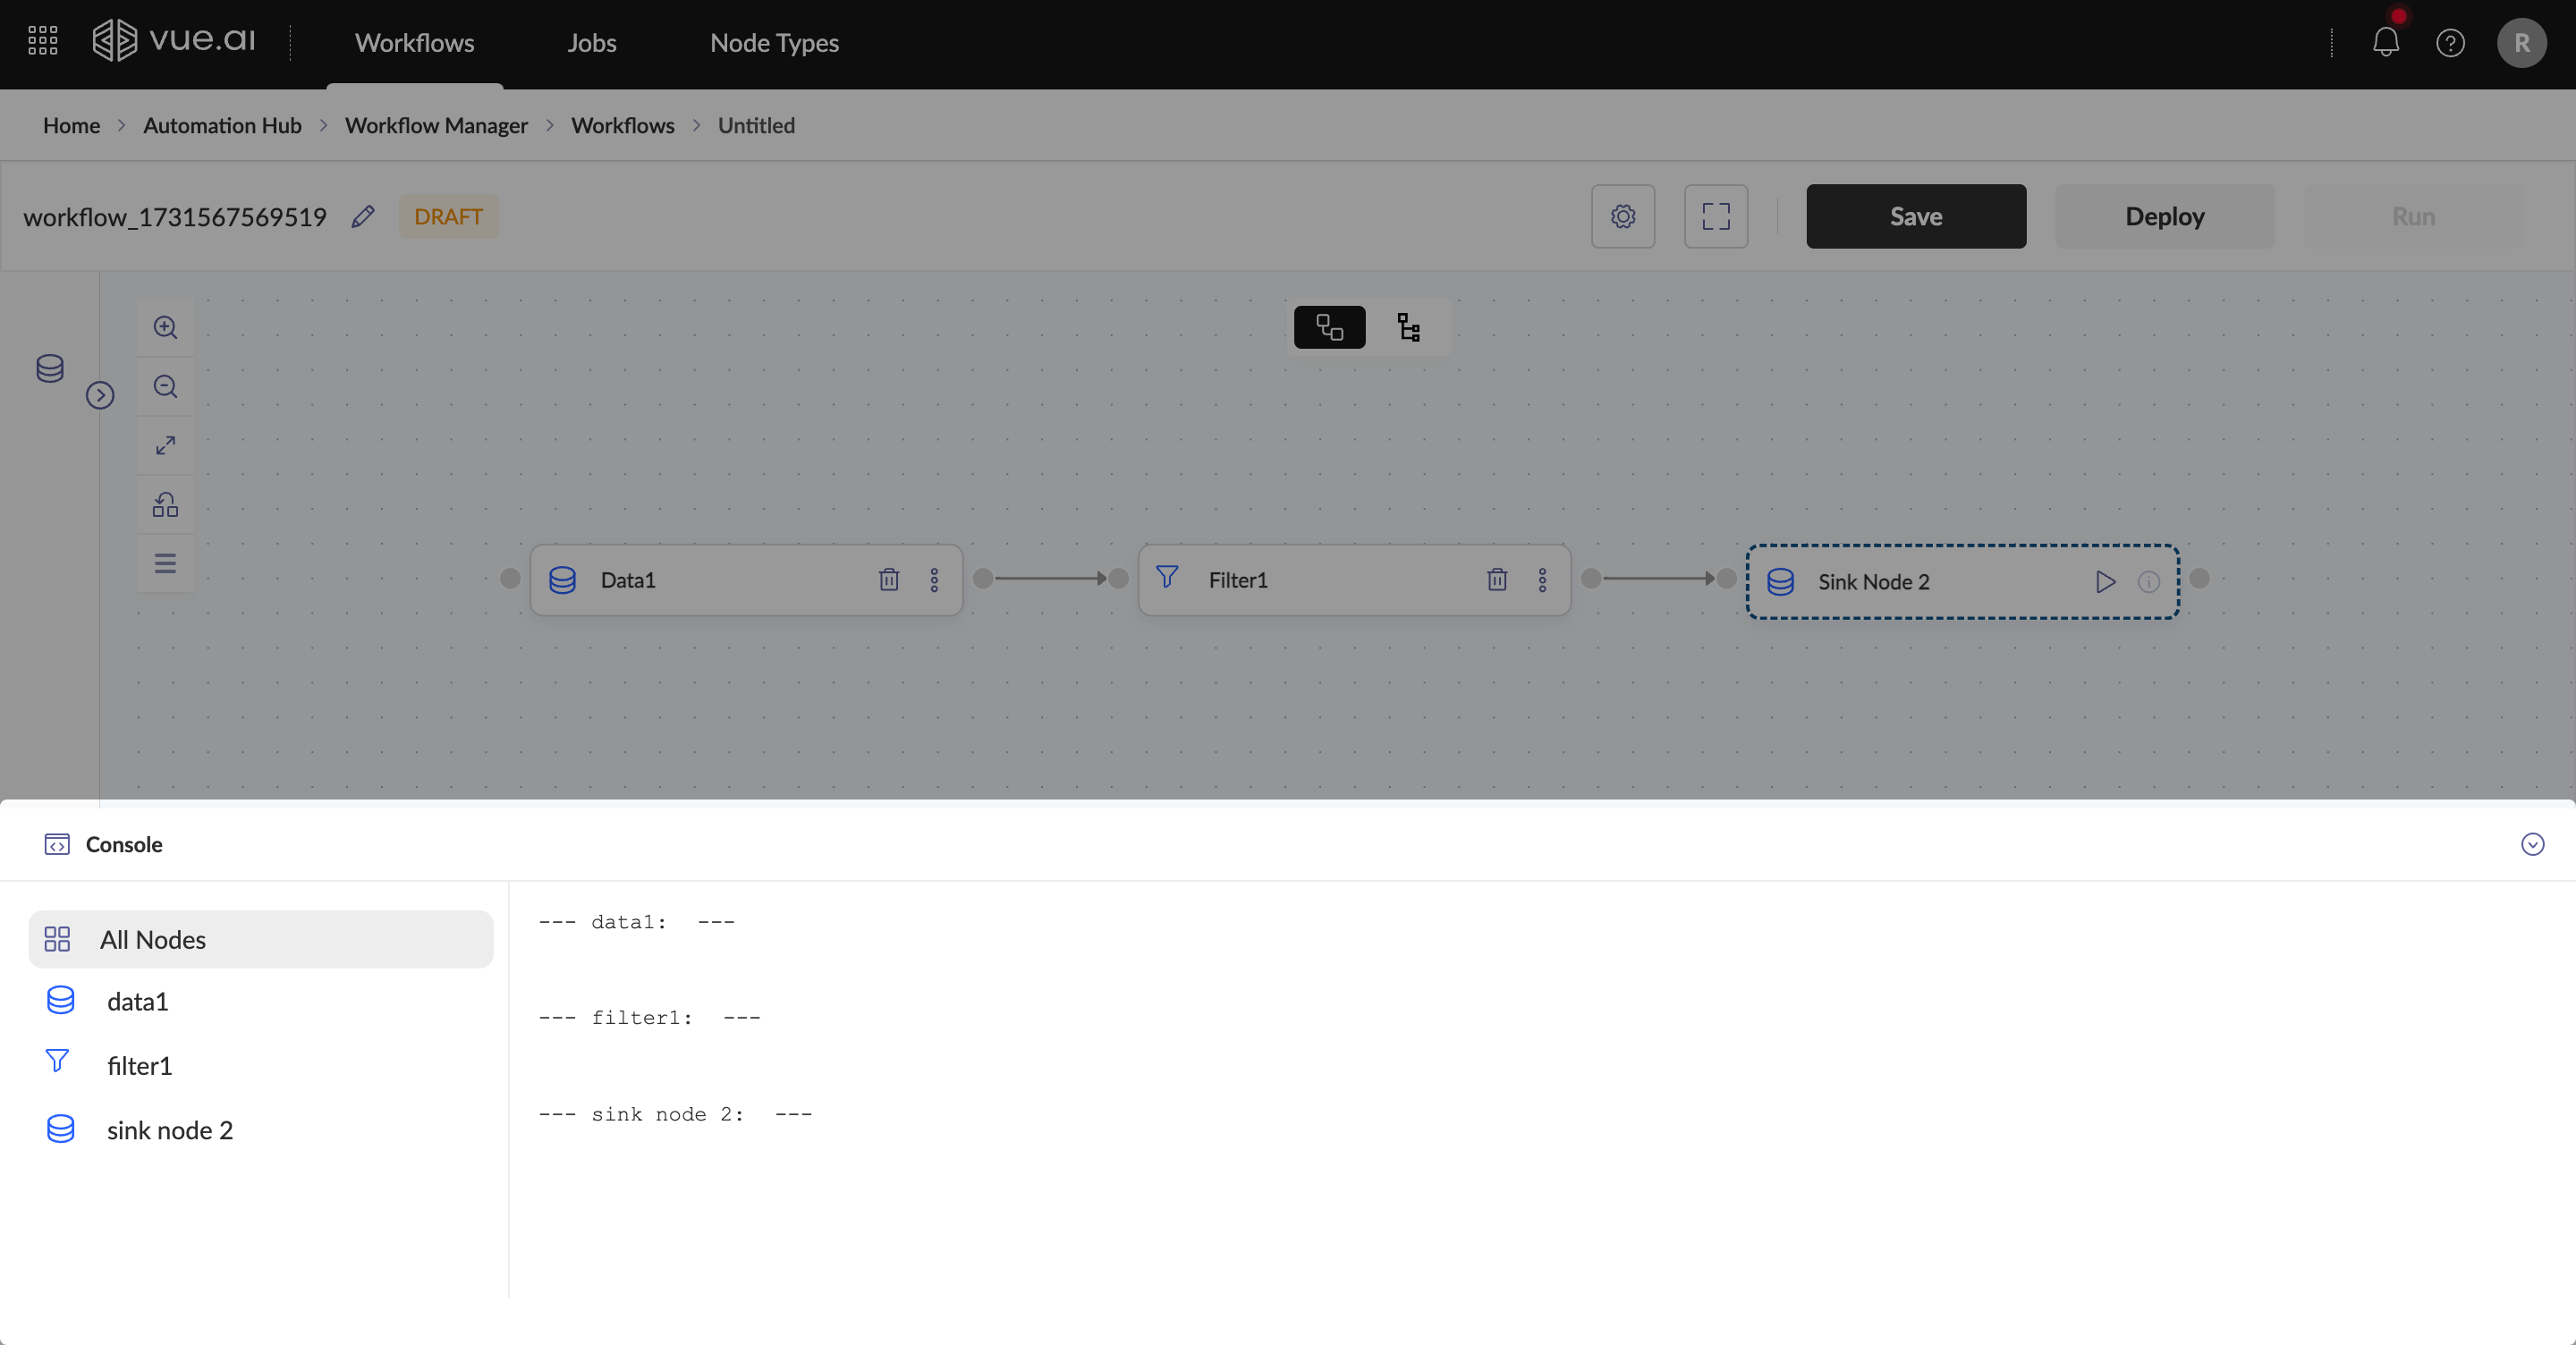
- Additional Workflow Canvas Features
- Workflow Arrangement Options: Choose between horizontal or vertical layout for workflow arrangement.
- Mini-Map View: Located at the bottom-right, this provides a consolidated view of the entire workflow, highlighting the visible section on your screen to help you navigate larger workflows.
Troubleshooting
Common Issues and Solutions
Problem 1: Debugging Issues Cause: Errors traced back to their respective nodes. Solution:
- Use the Error Console to trace errors back to their respective nodes.
Problem 2: Deployment Failures Cause: Incorrect configurations. Solution:
- Ensure all configurations are set correctly before deployment.
Problem 3: Workflow Not Running Cause: Workflow not successfully deployed. Solution:
- Confirm the workflow is successfully deployed before execution.
Additional Information
The Workflow Canvas allows workflows to be scheduled for automated execution. Workflow configurations can also be adjusted to optimize performance.
- The workflow's control flow follows the sequence in which nodes are added to the canvas.
- Ensure appropriate node usage: Transform nodes and Custom Code nodes cannot be used together.
- Keep node names concise and clear for better readability on the canvas, ensuring smoother workflow deployment.
FAQs
How do I create a new workflow?
- Navigate to Automation Hub → Workflow Manager → Workflows
- Click the "New Workflow" button at the top-left of the Workflows Listing screen
- This will open the Workflow Canvas interface where you can start building your workflow
How do I save my workflow?
Workflows can be saved in two ways:
- Automatically through the autosave feature
- Manually by clicking the Save button in the top bar of the Workflow Canvas
What are the different workflow statuses?
Common workflow statuses include:
- DRAFT: Initial state of a new workflow
- DEPLOYING: Workflow is in the process of being deployed
- DEPLOYED: Workflow has been successfully deployed
- FAILED: Deployment or execution has failed
How do I deploy and run a workflow?
- Click the Deploy button in the top bar
- Wait for the status to change to DEPLOYED
- Once deployed, the Run button will become active
- Click Run to initiate the workflow job
How can I debug issues in my workflow?
You can use the Console at the bottom of the screen which shows:
- Output messages from nodes
- Error messages at the node level
- Specific node-related issues for debugging
How do I add nodes to my workflow?
There are two ways to add nodes:
- Drag & Drop: Drag nodes from the left sidebar onto the Workflow Canvas
- Right-click on the canvas and select nodes from the context menu
How can I navigate large workflows?
You can use several navigation features:
- Zoom controls to zoom in/out
- Fit to screen option
- Mini-Map view at the bottom-right
- Auto-arrange nodes feature
- Outline view to see all nodes
Can I schedule workflows?
Yes, you can schedule workflows through the Workflow Configurations menu (gear icon) in the top bar, where you can specify when and how often the workflow should run.
Summary
- Summarized the key points covered in the guide:
- Navigating to the Workflows Listing page
- Creating a new workflow and accessing the Workflow Canvas
- An overview of key Workflow Canvas features and functionalities
- Deployment, execution, and debugging techniques
With these insights, users are now equipped to create, deploy, and manage workflows efficiently using the Workflow Canvas.
Transform Node Workflows
Welcome to the Transform Node Workflows Overview! This guide will help users understand the features and benefits of Transform Node Workflows and learn how to create, configure, and deploy these workflows effectively.
Who is this guide for? This guide is designed for users of the Vue.ai platform.
Ensure access to the Vue.ai platform and familiarity with basic workflow concepts before starting.
Overview
Transform Node Workflows enable users to:
- Create automated data processing pipelines.
- Perform operations like filtering, joining, aggregating, and restructuring data.
Prerequisites Before beginning, ensure that:
- The Vue.ai platform is accessible.
- For more basic information on Workflows, please review the Getting Started with Workflows documentation.
Step-by-Step Instructions
Creating a Transform Node Workflow
Follow these steps to create a Transform Node Workflow:
Navigate to the Workflows Listing Page
- Go to Automation Hub → Workflow Manager → Workflows.
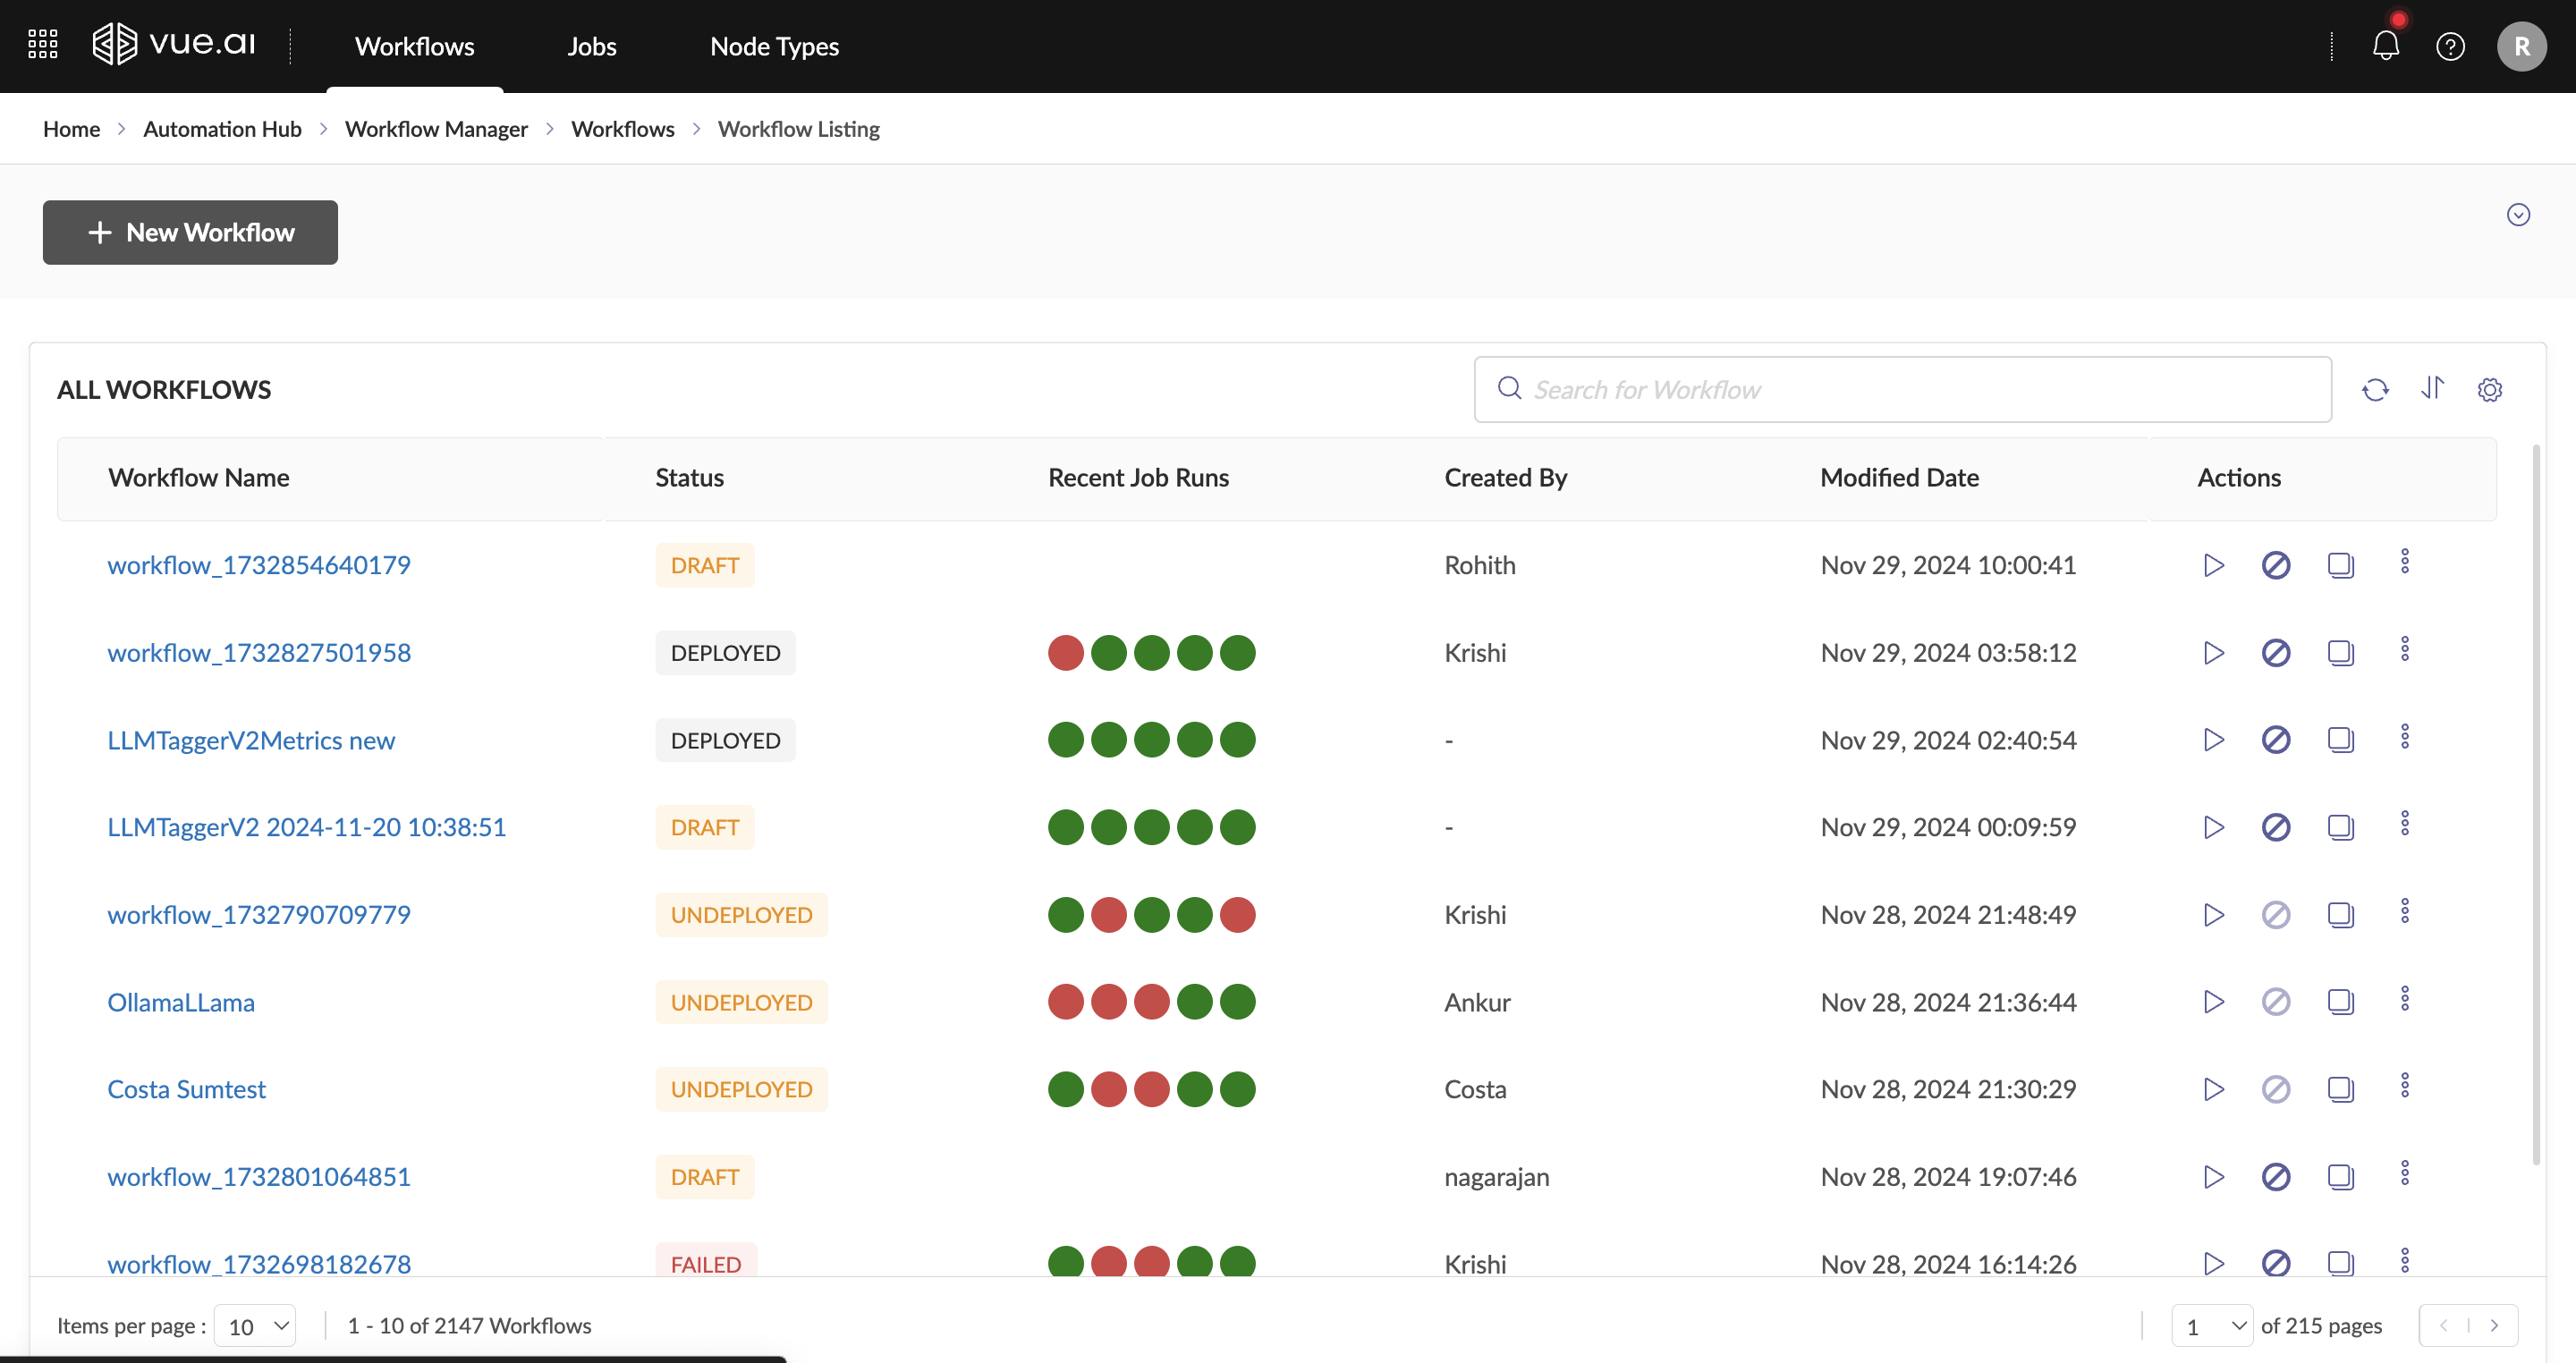
- Go to Automation Hub → Workflow Manager → Workflows.
Create a New Workflow
- Click + New Workflow to create a new workflow canvas.
- To rename the workflow, click the Edit button and modify the name.
Build the Workflow
Nodes can be added in two ways:
- Drag & Drop: Hover over the Nodes section, search for the required node, and drag it into the workflow canvas.
- Right-Click: Right-click on the workflow canvas, search for the node, and add it.
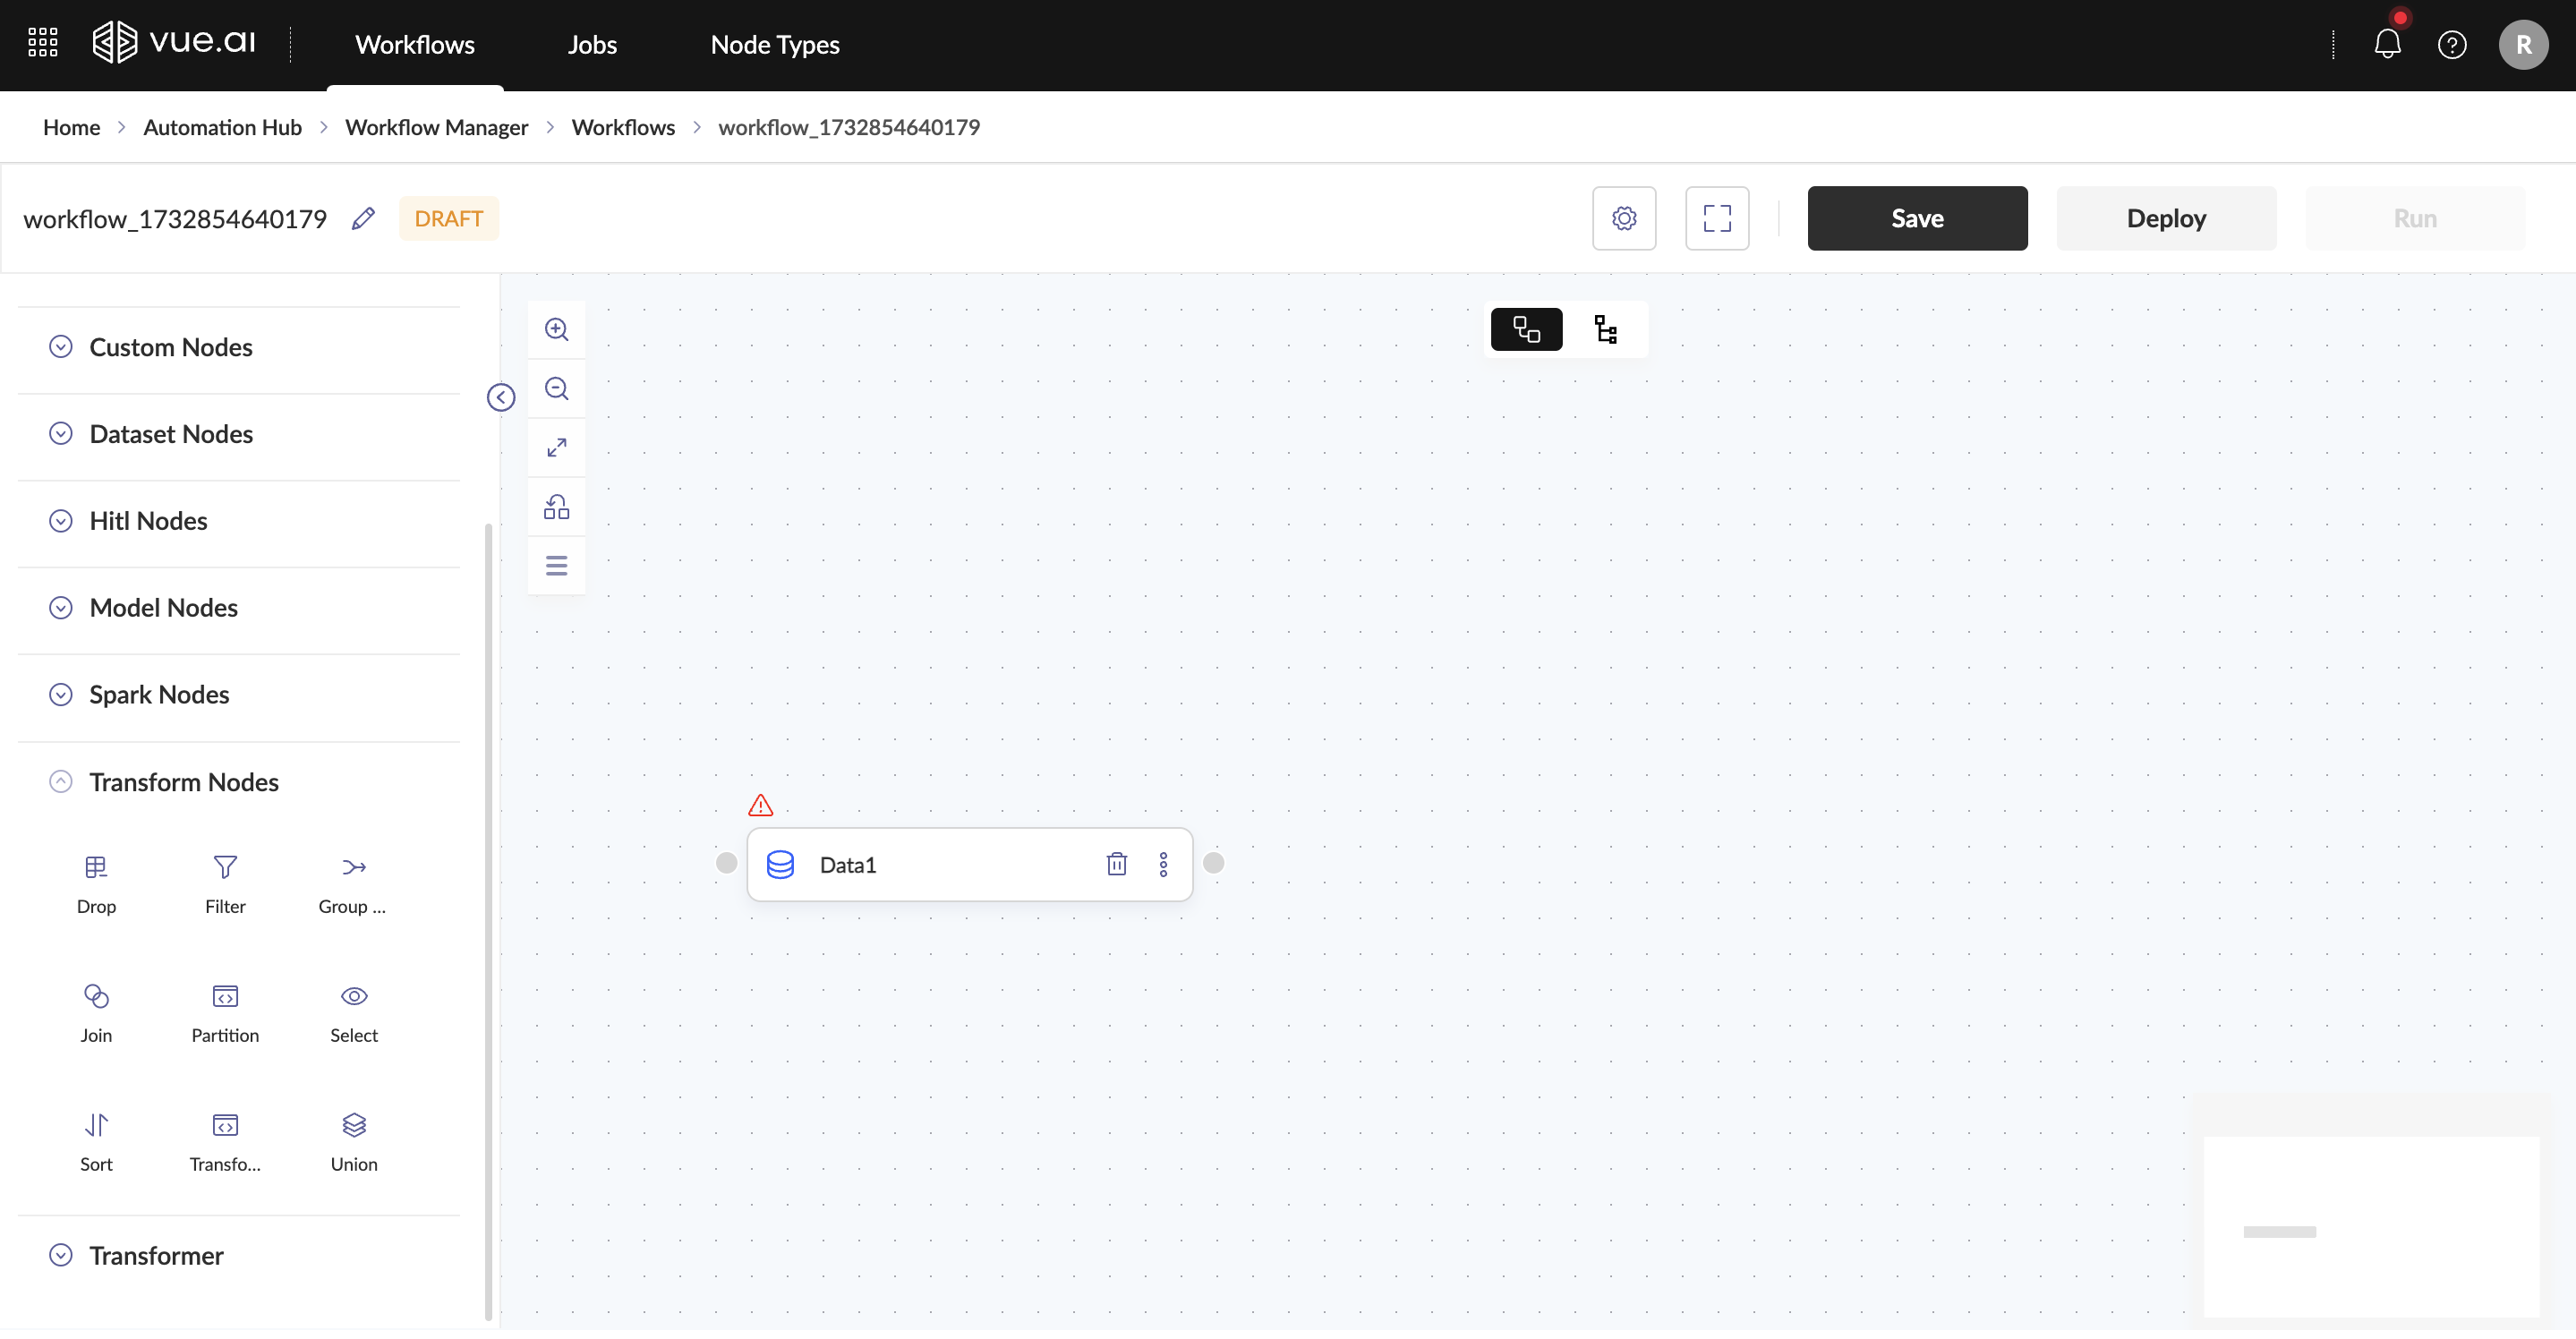
Load a dataset by adding the Dataset Reader Node to the workspace.
Transform Nodes include: SELECT, JOIN, GROUP BY, UNION, PARTITION, DROP, SORT.
SELECT: Extract specific columns or rows based on criteria.JOIN: Merge rows from multiple tables using a related column.GROUP BY: Group rows by specified columns, often used with aggregate functions.UNION: Combine result sets from multiple queries, eliminating duplicates.PARTITION: Divide the result set into partitions for window function operations.DROP: Permanently remove a table, view, or database object.SORT: Arrange the result set in ascending or descending order based on specified columns.
Click on the node after adding it to the workflow canvas. Define the parameters for that node.
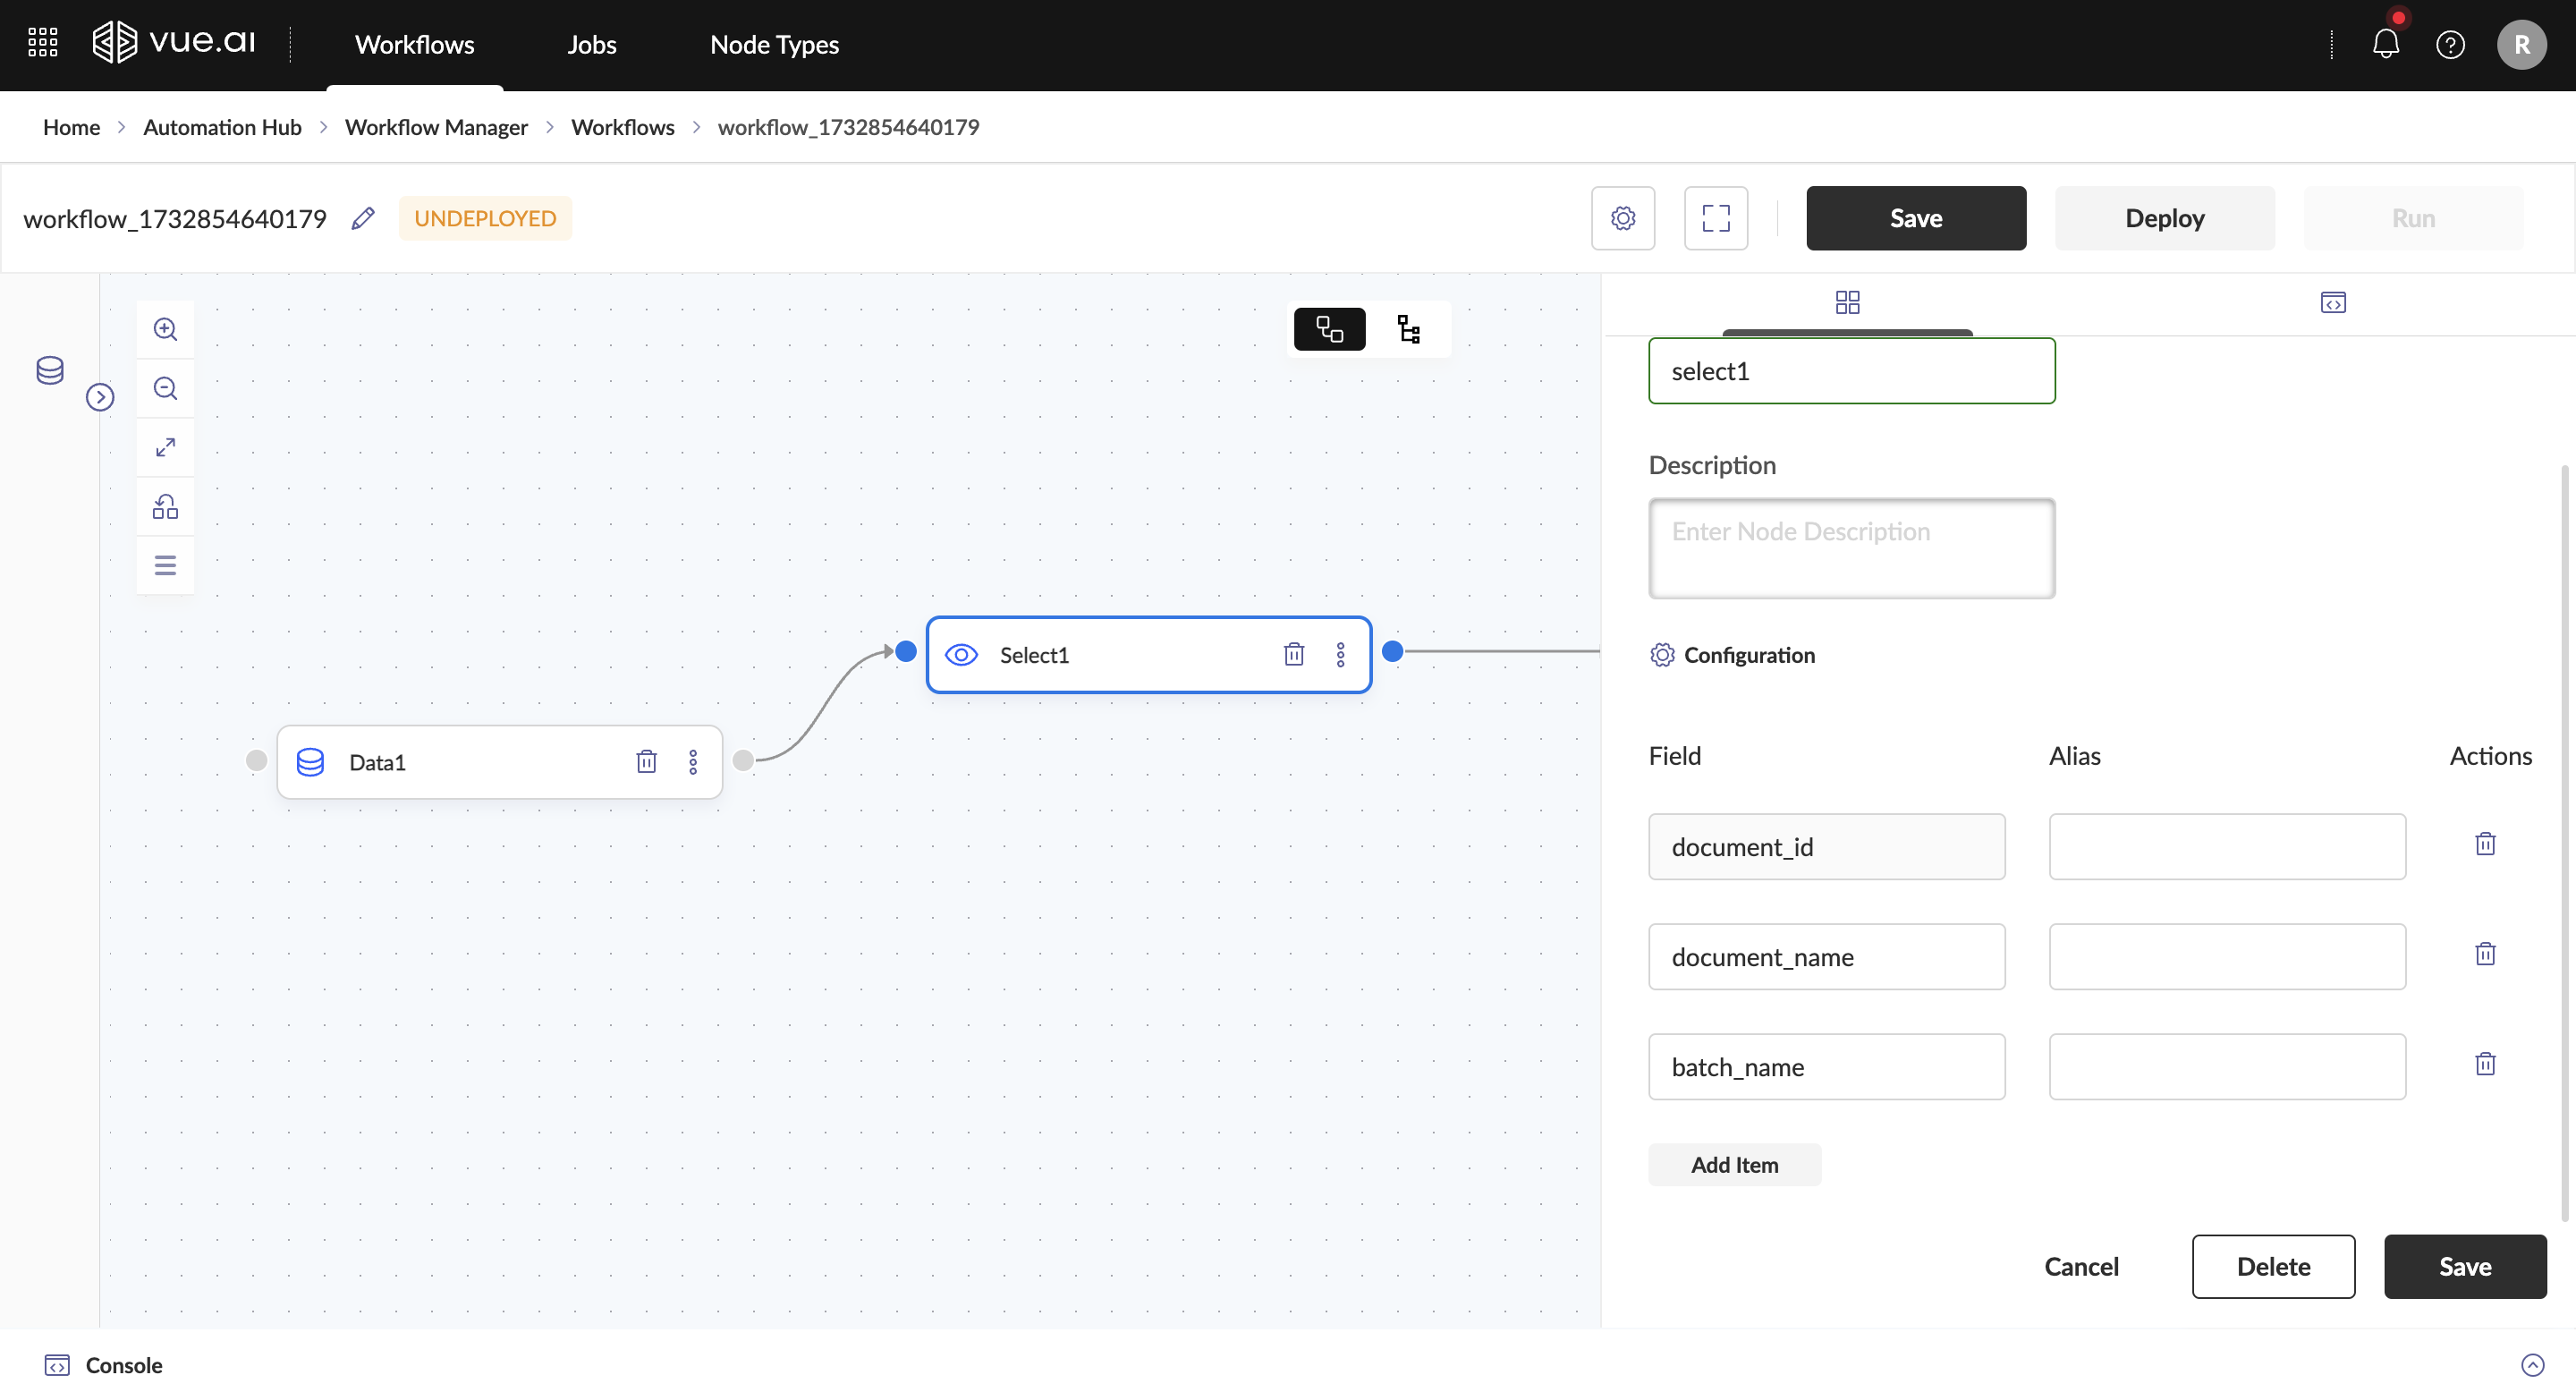
Drag the end of one node to connect it to the start of another.
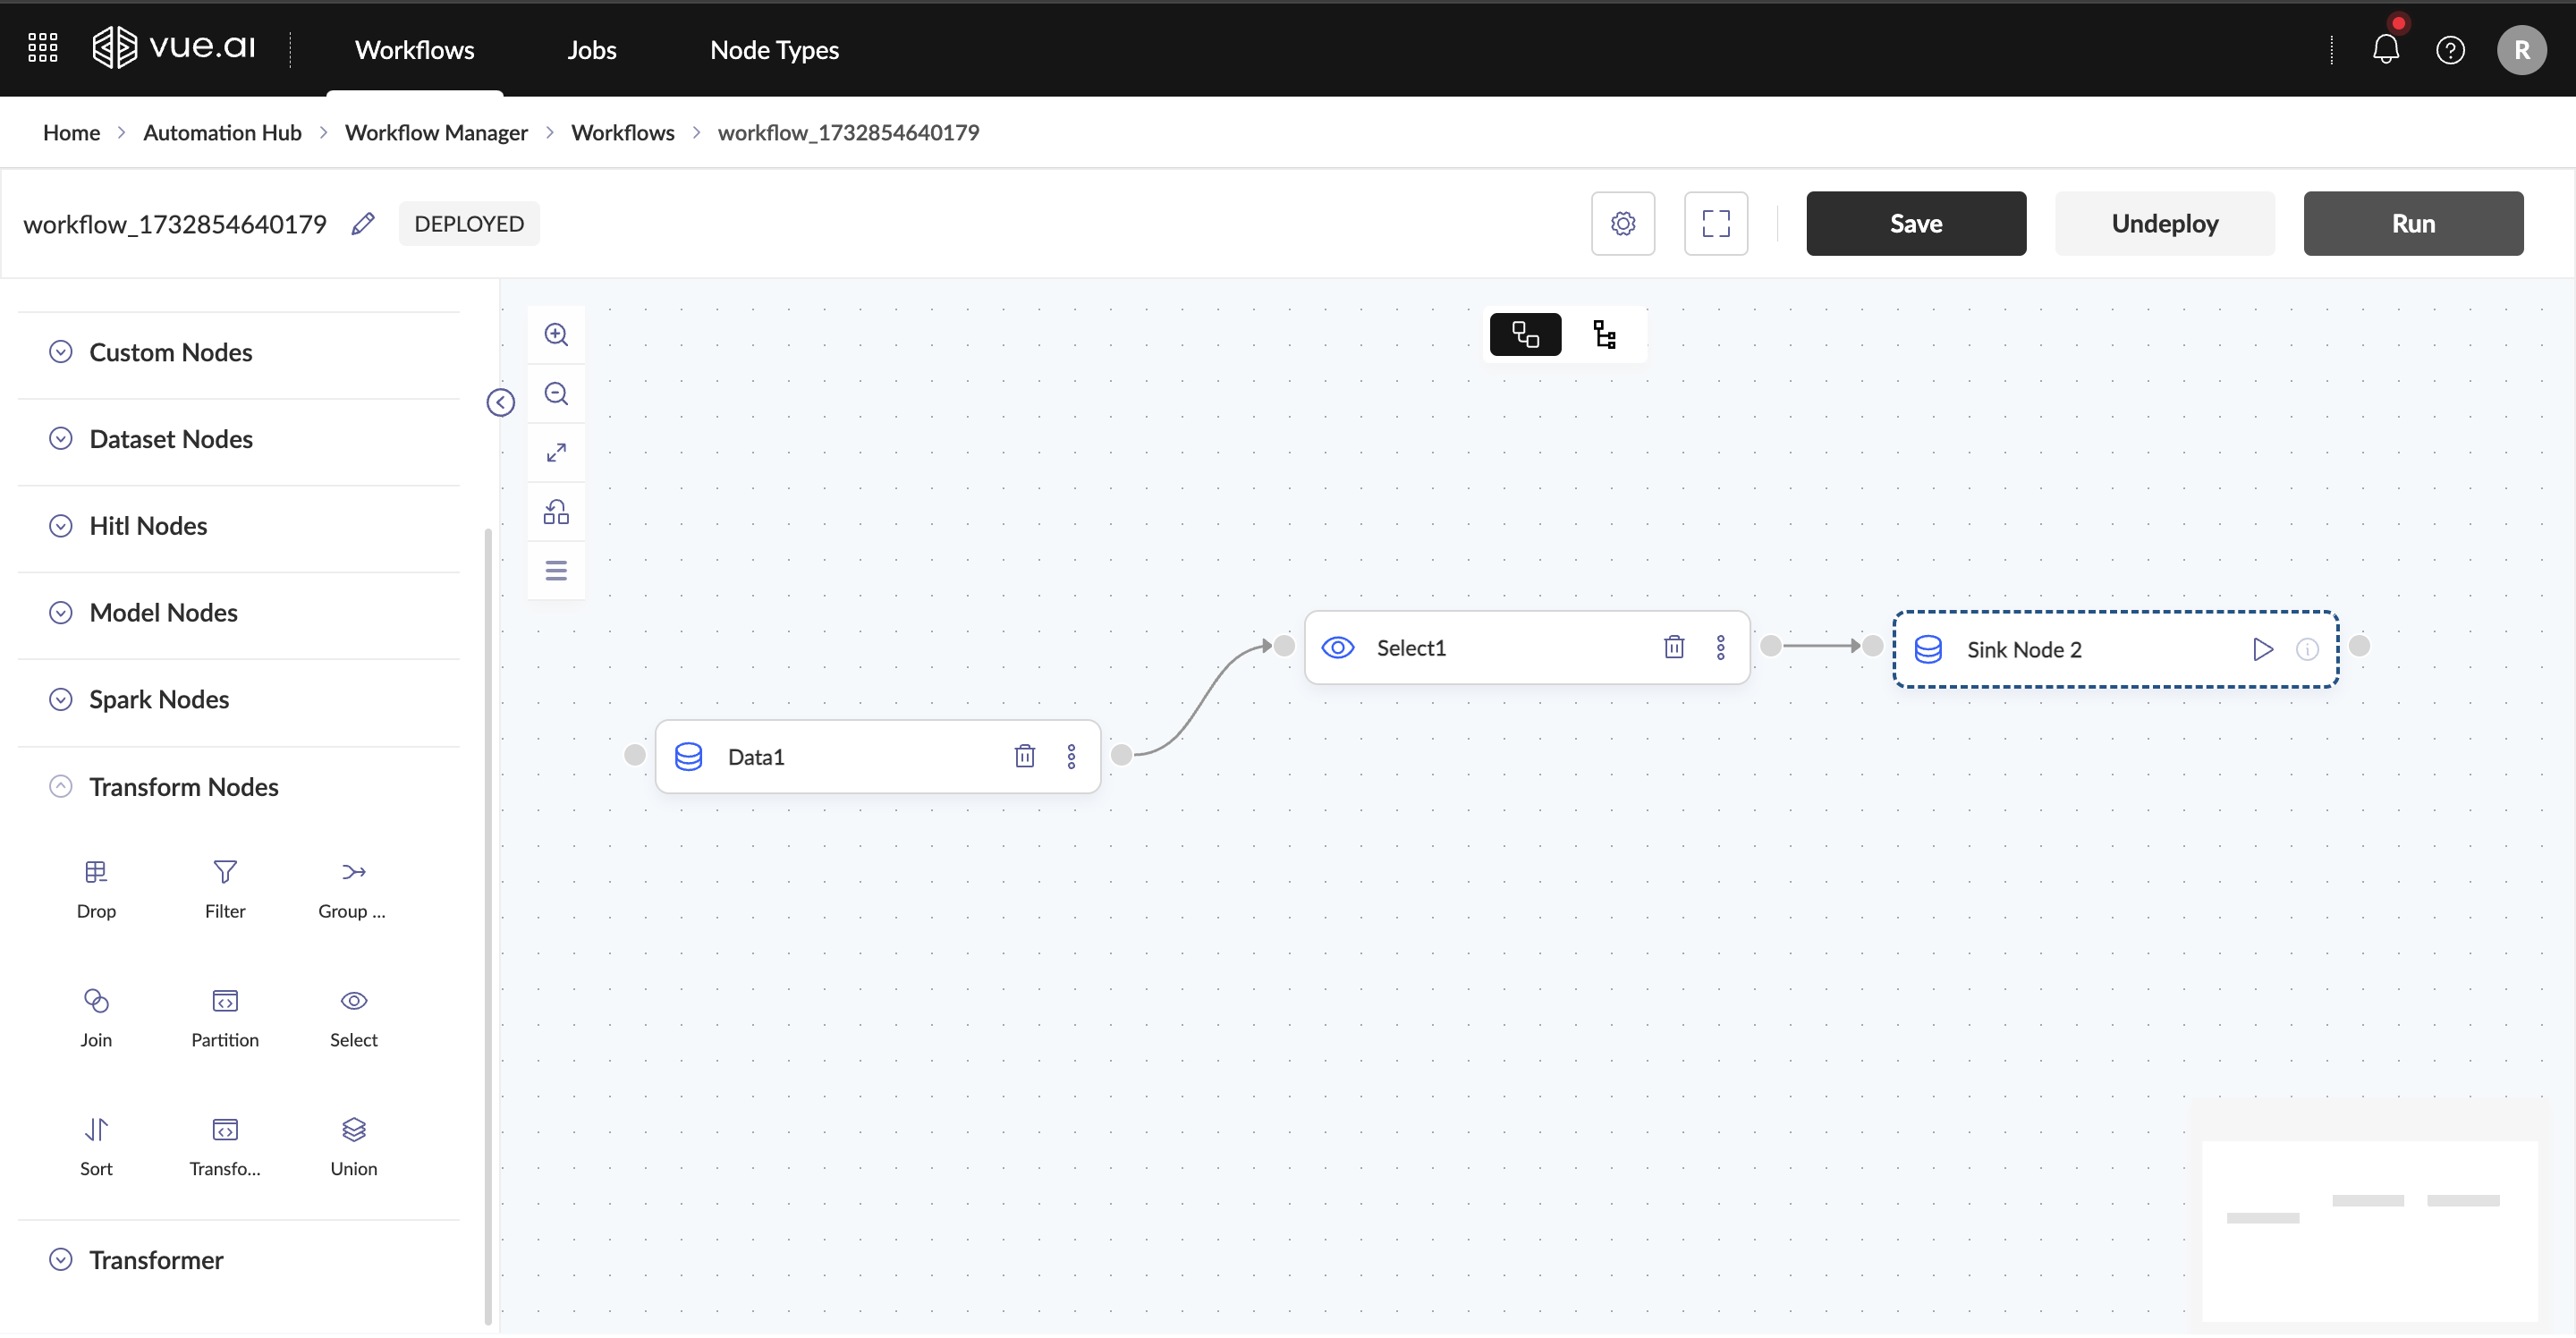
Expected Outcome: Once all nodes are added and linked, the workflow structure is complete.
SpeedRun the Workflow
- This method serves as a trigger to execute workflows in synchronous mode using Pandas. It is designed for running lighter workloads, ensuring that the logic functions correctly by providing quick results for faster validation.
- Click the run icon on the sink node after each transformation to execute the speed run.

- This method serves as a trigger to execute workflows in synchronous mode using Pandas. It is designed for running lighter workloads, ensuring that the logic functions correctly by providing quick results for faster validation.
Deploy and Run the Workflow
To modify the workflow configuration, click the gear icon at the top of the canvas.
Select the engine (Pandas/Spark) in which the workflow needs to be deployed
Click Deploy to initiate the deployment process.
Once deployed, click Run to execute the workflow.
Navigate to the Jobs Page to check the workflow job status.
Expected Outcome: The workflow is successfully deployed and executed.

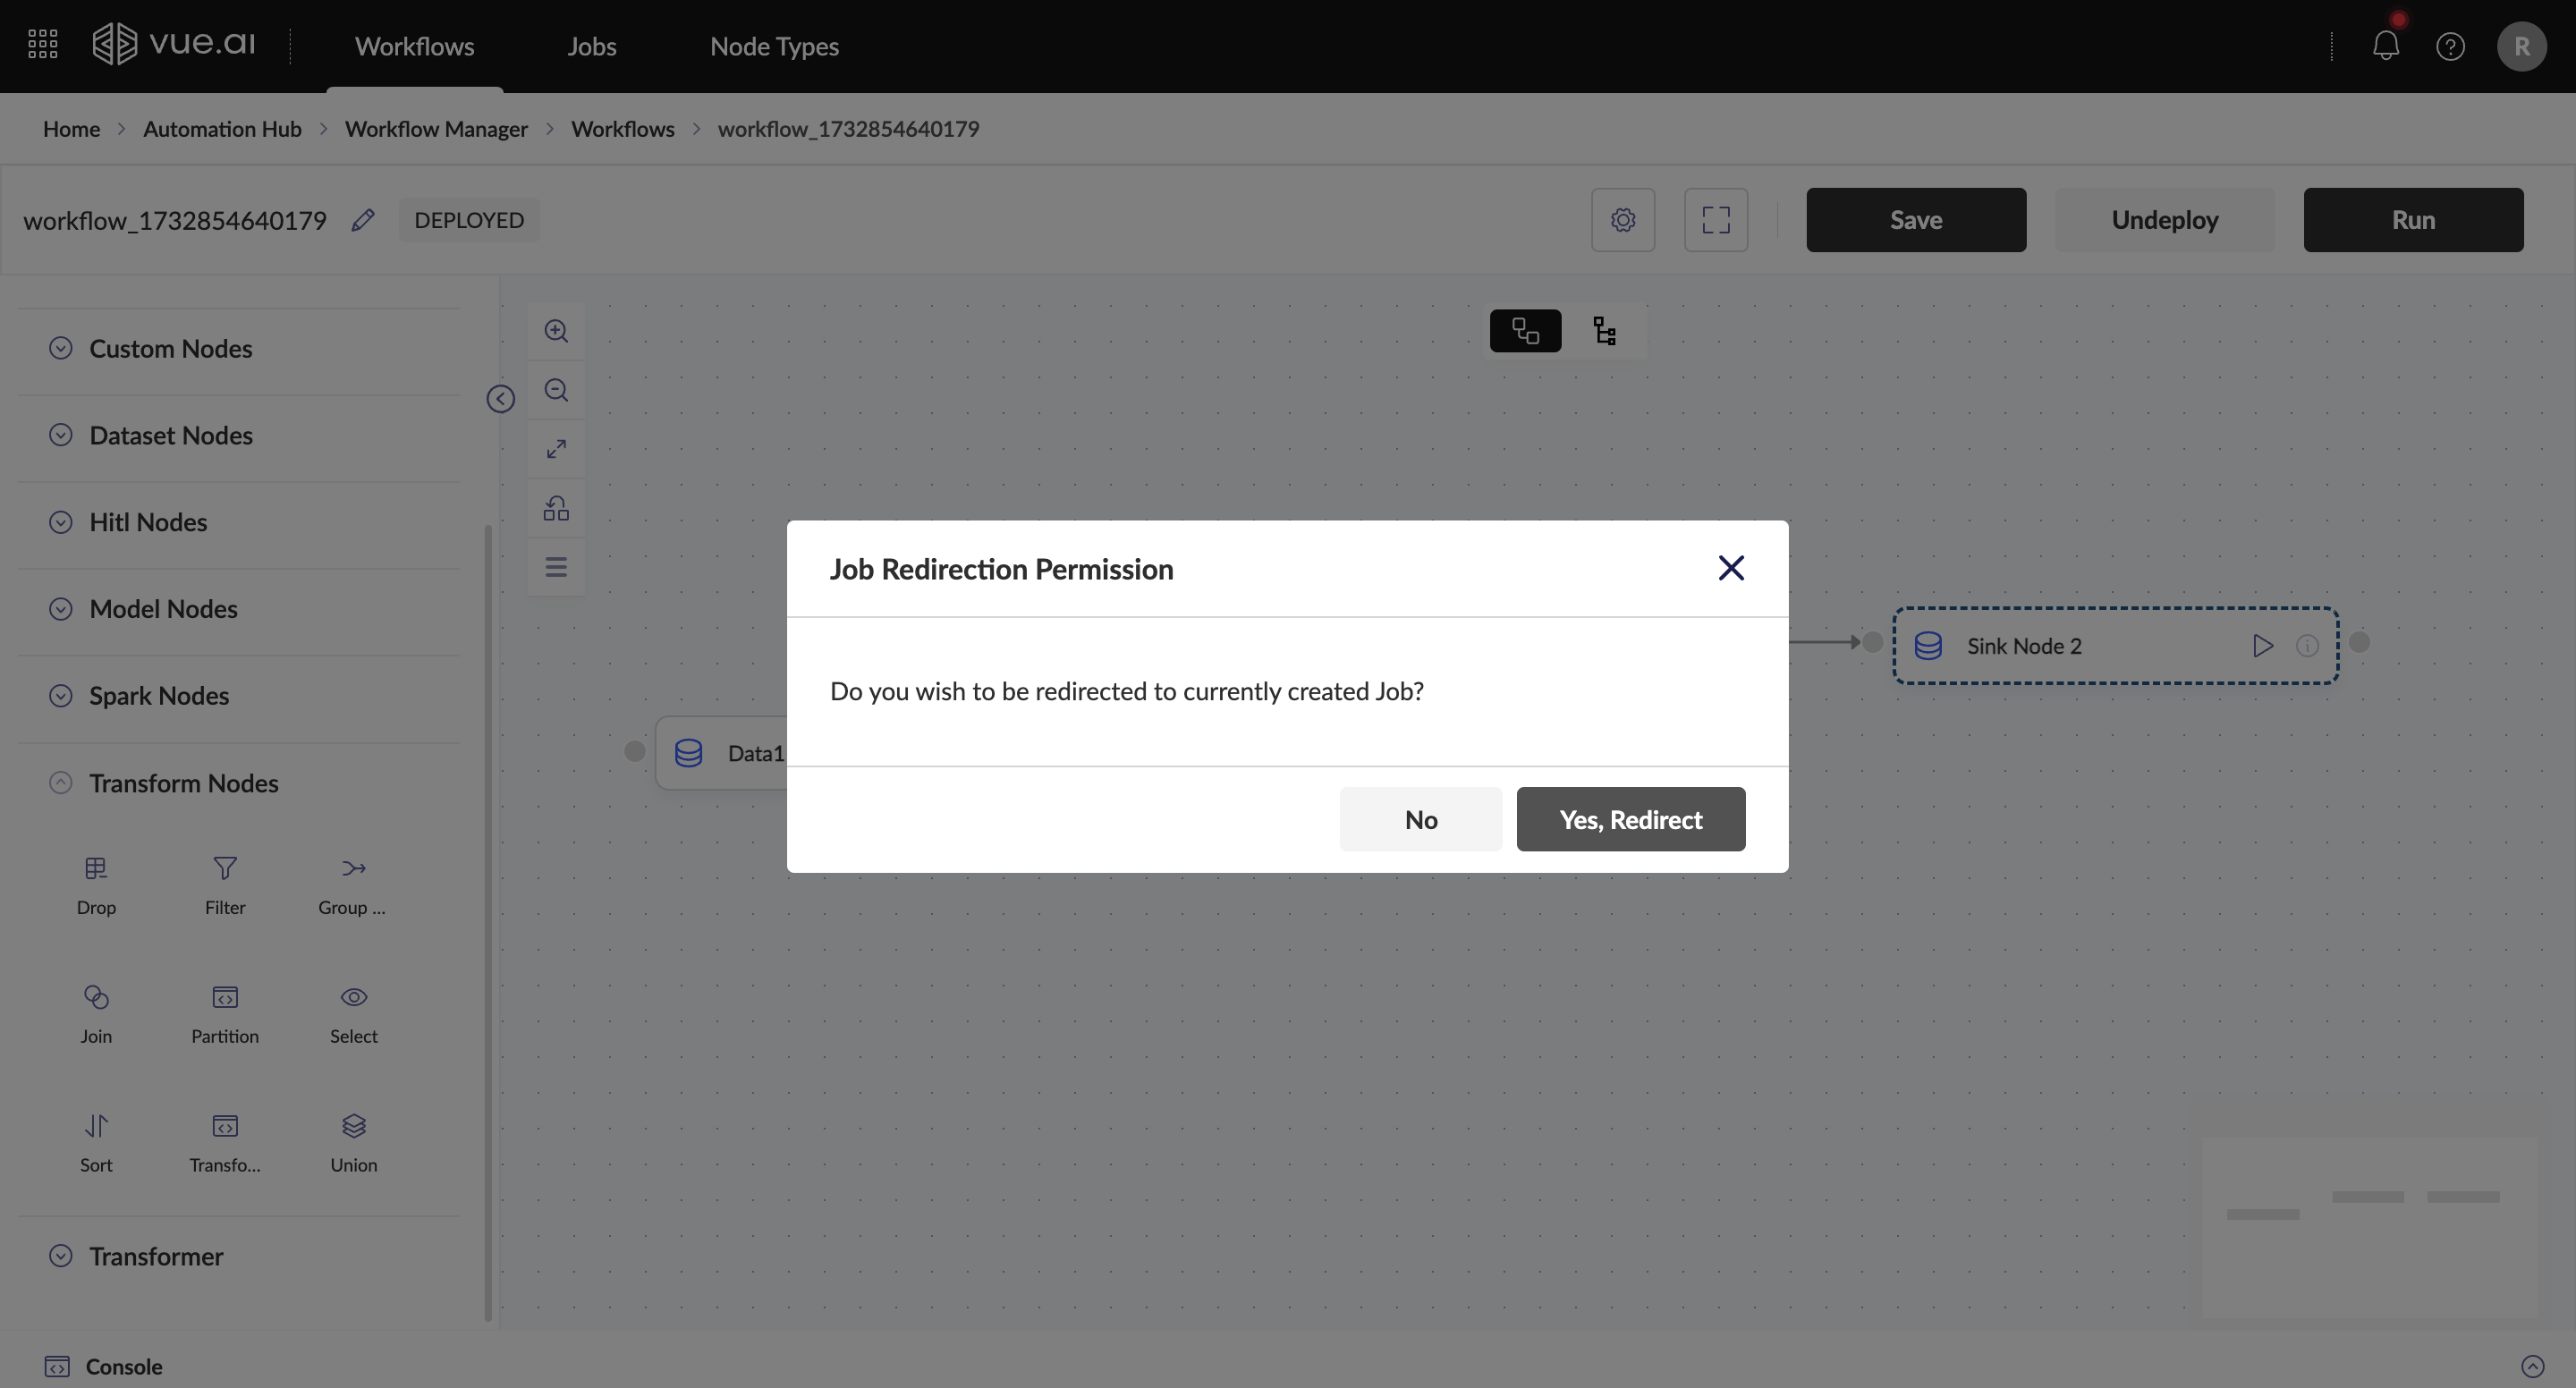
Scheduling the Workflow
- Before deploying the workflow, modify its configuration by clicking the gear icon at the top of the canvas.
- You will find an option to schedule the workflow using either a daily format or a cron expression.
Expected Outcome: The workflow is successfully scheduled.

Troubleshooting
Common Issues and Solutions
Problem 1: Workflow Deployment Failure Cause: Nodes are not properly linked. Solution: Verify that all nodes are correctly linked before deploying.
Problem 2: Configuration Errors Cause: Incorrect node parameters. Solution: Verify the parameters of each node to avoid configuration errors.
Problem 3: Workflow Execution Failure Cause: Workflow errors. Solution: If a workflow fails, check the Job Status Page for error details.
Additional Information
Speed Run on the workflow can be performed on both the sample and the entire dataset by toggling the Use Sample Dataset option. Additionally, the number of records in the output can be configured in the workflow settings.
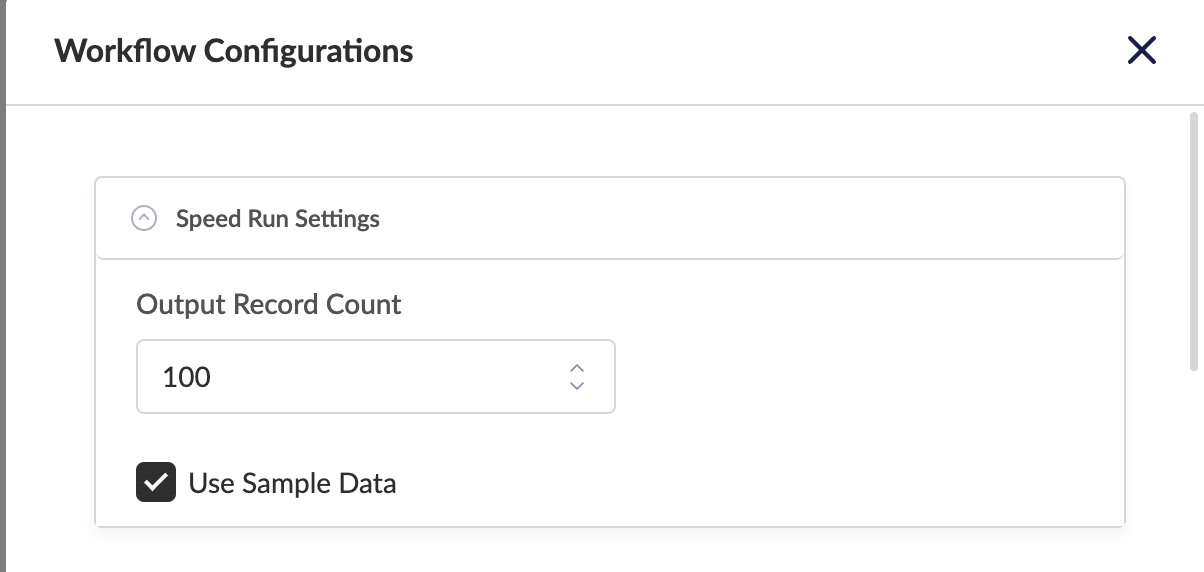
The output of workflows can be persisted as a dataset, which will be available on the datasets listing page once the workflow is executed. This option is available for all sink datasets, allowing you to specify the required file format and dataset name. Currently, supported formats include CSV, Delta, and Parquet.
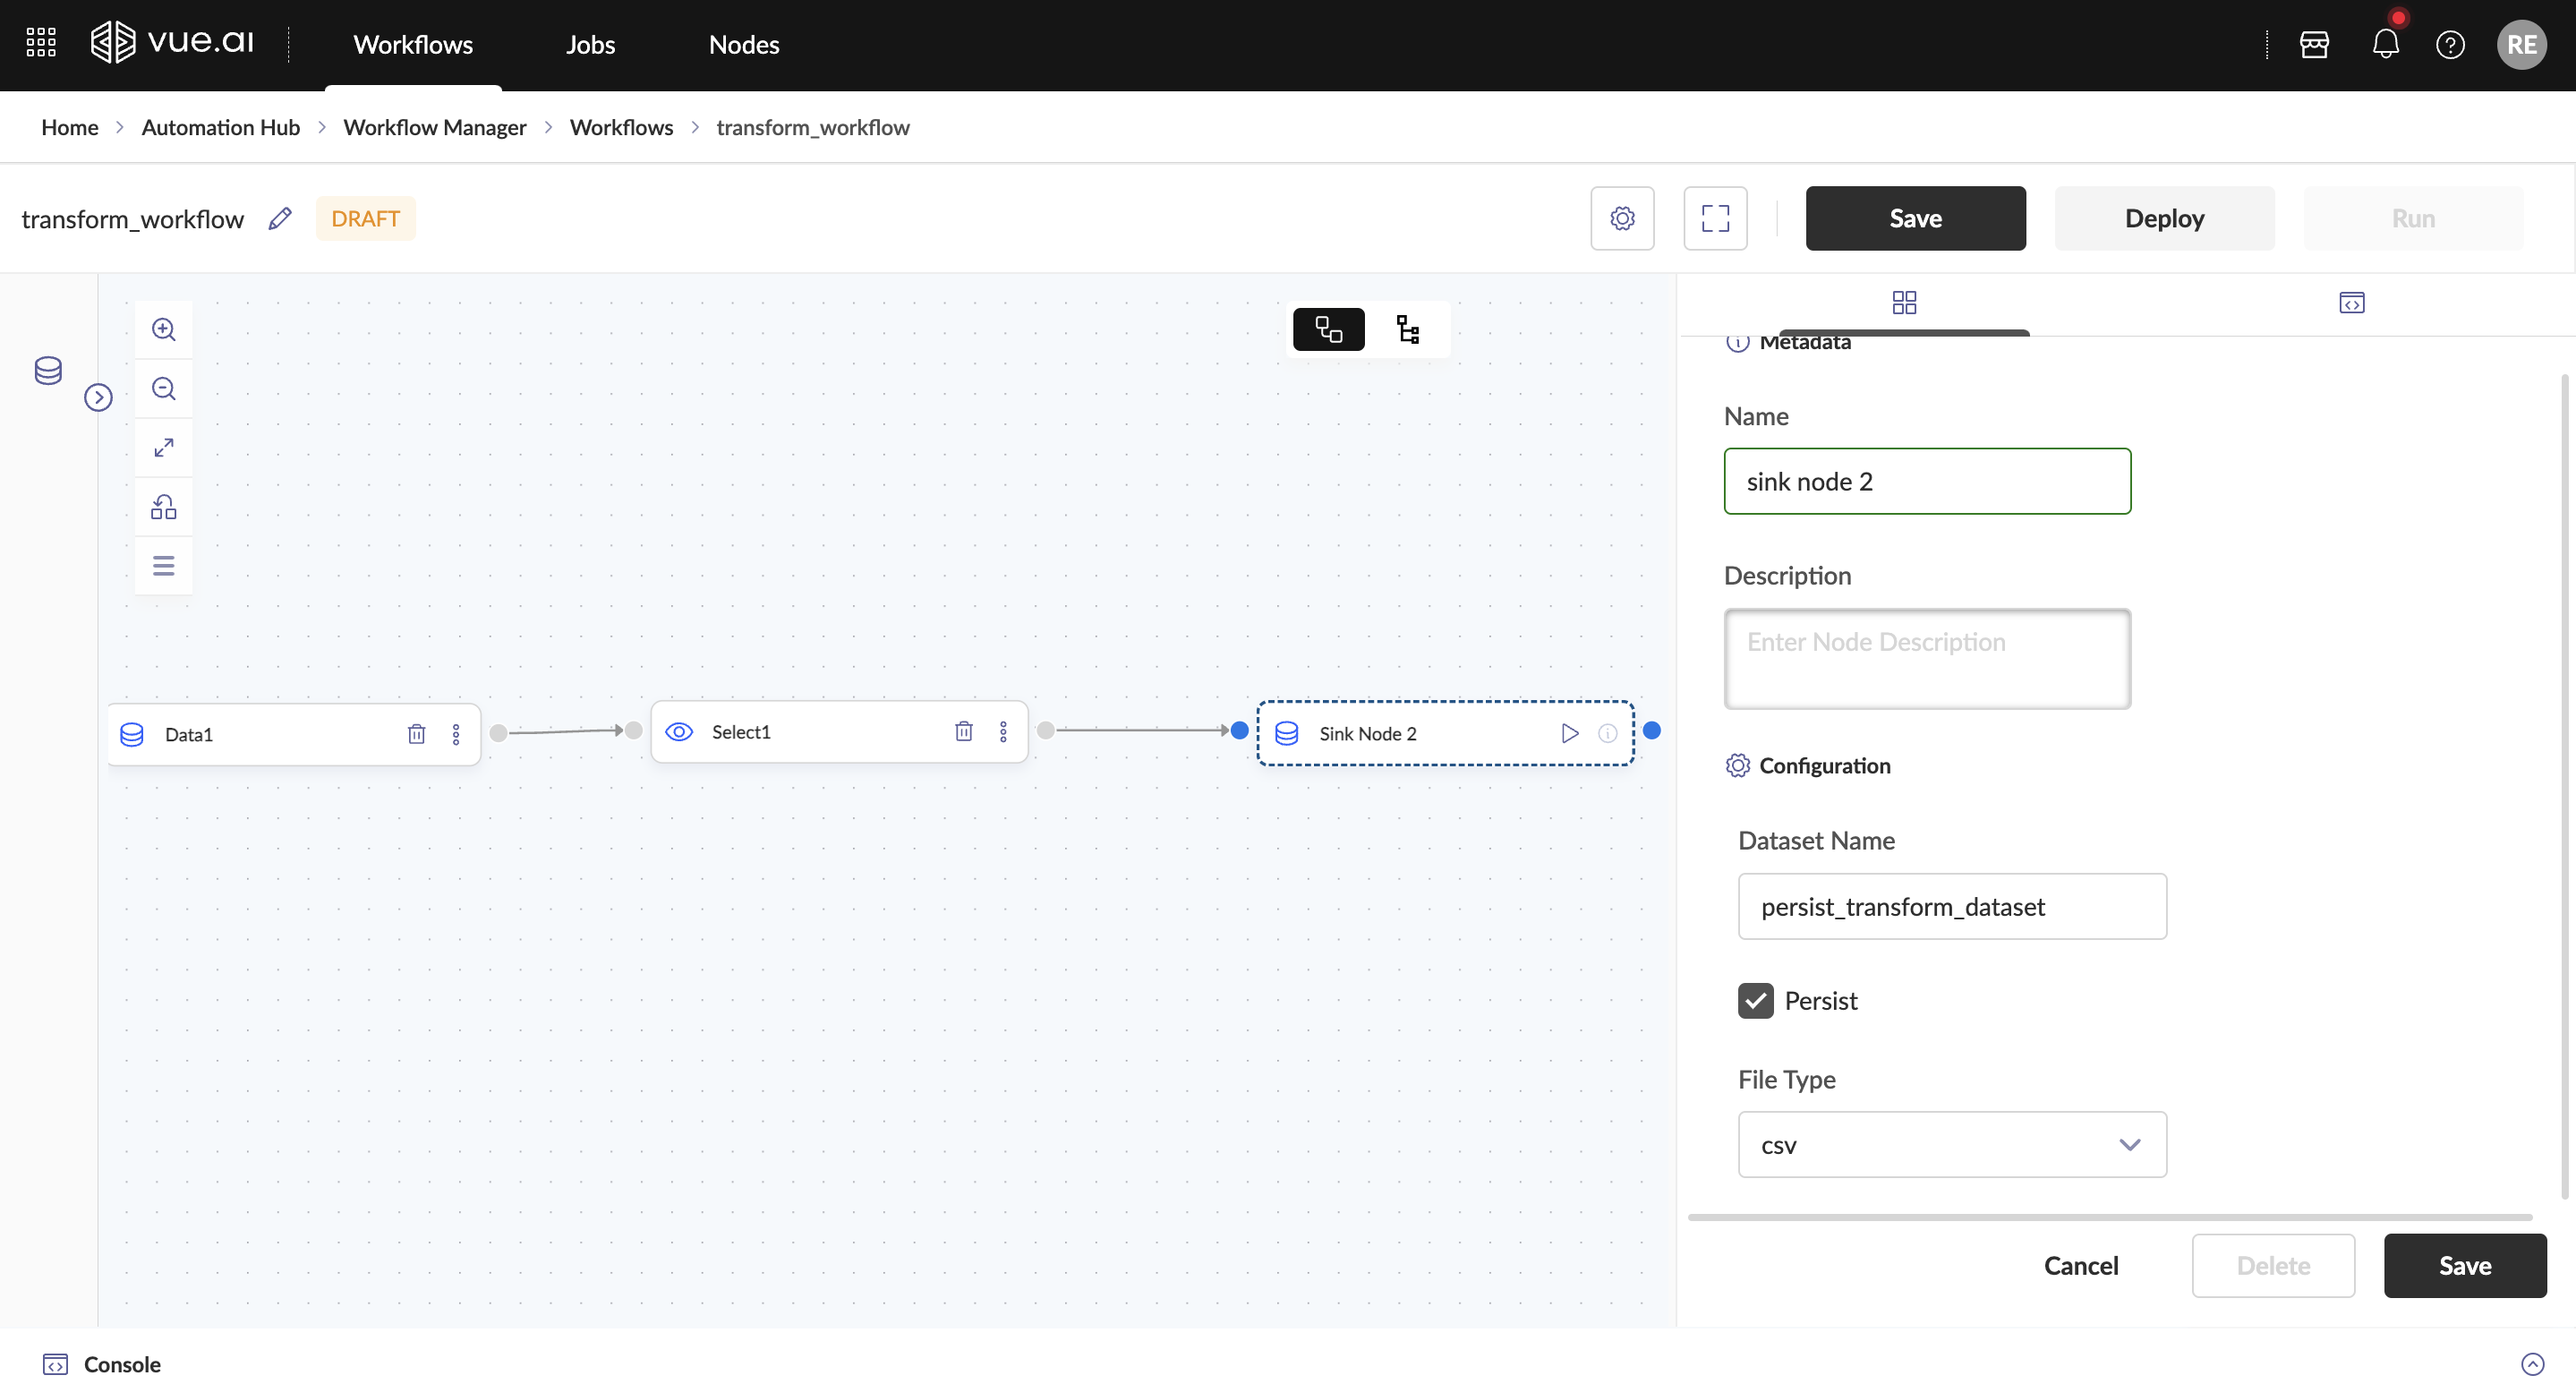
- Workflows support both batch and real-time processing. Advanced nodes can be used to implement ranking, partitioning, and custom logic.
- It is recommended not to persist the dataset when performing a Speed Run on the workflow using a sample dataset, as a proper dataset will not be created without all the necessary resources.
- The workflow's control flow follows the sequence in which nodes are added to the canvas.
- Ensure appropriate node usage: Transform nodes and Custom Code nodes cannot be used together.
- Keep node names concise and clear for better readability on the canvas, ensuring smoother workflow deployment.
- Ensure that the workflow configuration (gear icon) is correctly set before deploying a Transform Node workflow.
Resources
FAQ
What are Transform Nodes?
Transform nodes are specialized components that allow you to:
- Filter, transform, and enrich data
- Handle complex data manipulations
- Combine data from multiple sources
- Support both batch and real-time processing
- Perform operations like joins, partitioning, and aggregations
How do I configure a Transform Node?
To configure a Transform node:
- Drag the desired transform node onto the workflow canvas
- Click on the node to open its configuration panel
- Select the input dataset or source
- Configure the transformation parameters (e.g., SELECT columns, JOIN conditions)
- Save the configuration
What types of Transform operations are available?
Common transform operations include:
SELECT: Extract specific columns or rowsJOIN: Merge data from multiple tablesGROUP BY: Aggregate data based on columnsUNION: Combine multiple result setsPARTITION: Divide data for window operationsDROP: Remove tables or columnsSORT: Order results by specified columns
How can I verify my Transform Node is working correctly?
You can verify your transform node by:
- Running the workflow in test mode with sample data
- Checking the node output in the Console tab
- Viewing the transformed data preview
- Monitoring the node status for any errors
- Examining the logs for detailed execution information
Summary
- This guide covered navigating to the Workflows Listing Page, creating a Transform Node Workflow, and deploying and running the workflow.
Custom Code Nodes Workflow
Welcome to the Custom Code Nodes Workflow guide! This guide will assist in understanding the flexibility provided by Custom Code Nodes within the Workflow Automation Hub and learning how to execute Python-based logic for custom data processing, transformation, and model training.
Who is this guide for? This guide is designed for users of the Workflow Automation Hub.
Ensure access to the Workflow Automation Hub, a registered dataset for input (if applicable), and basic knowledge of Python and Pandas before starting.
Overview
This guide serves as a comprehensive resource for:
- Creating, configuring, and using Custom Code Nodes in workflows.
- Ensuring the correct dataset formatting for seamless processing.
Prerequisites Before beginning, ensure the following requirements are met:
- Access to the Workflow Automation Hub.
- A registered dataset for input (if applicable).
- Basic knowledge of Python and Pandas.
Step-by-Step Instructions
Adding a Code Node to the Workflow
To Create a Code Node that can further be used in the workflows please review the Create Custom Code Nodes documentation.
Two methods can be used to add a code node:
Drag and Drop Method
- Select the node from the left pane.
- Drag it onto the workflow canvas.
Right-Click Method
- Right-click on the canvas.
- Select the node from the context menu.
- Place it on the canvas.
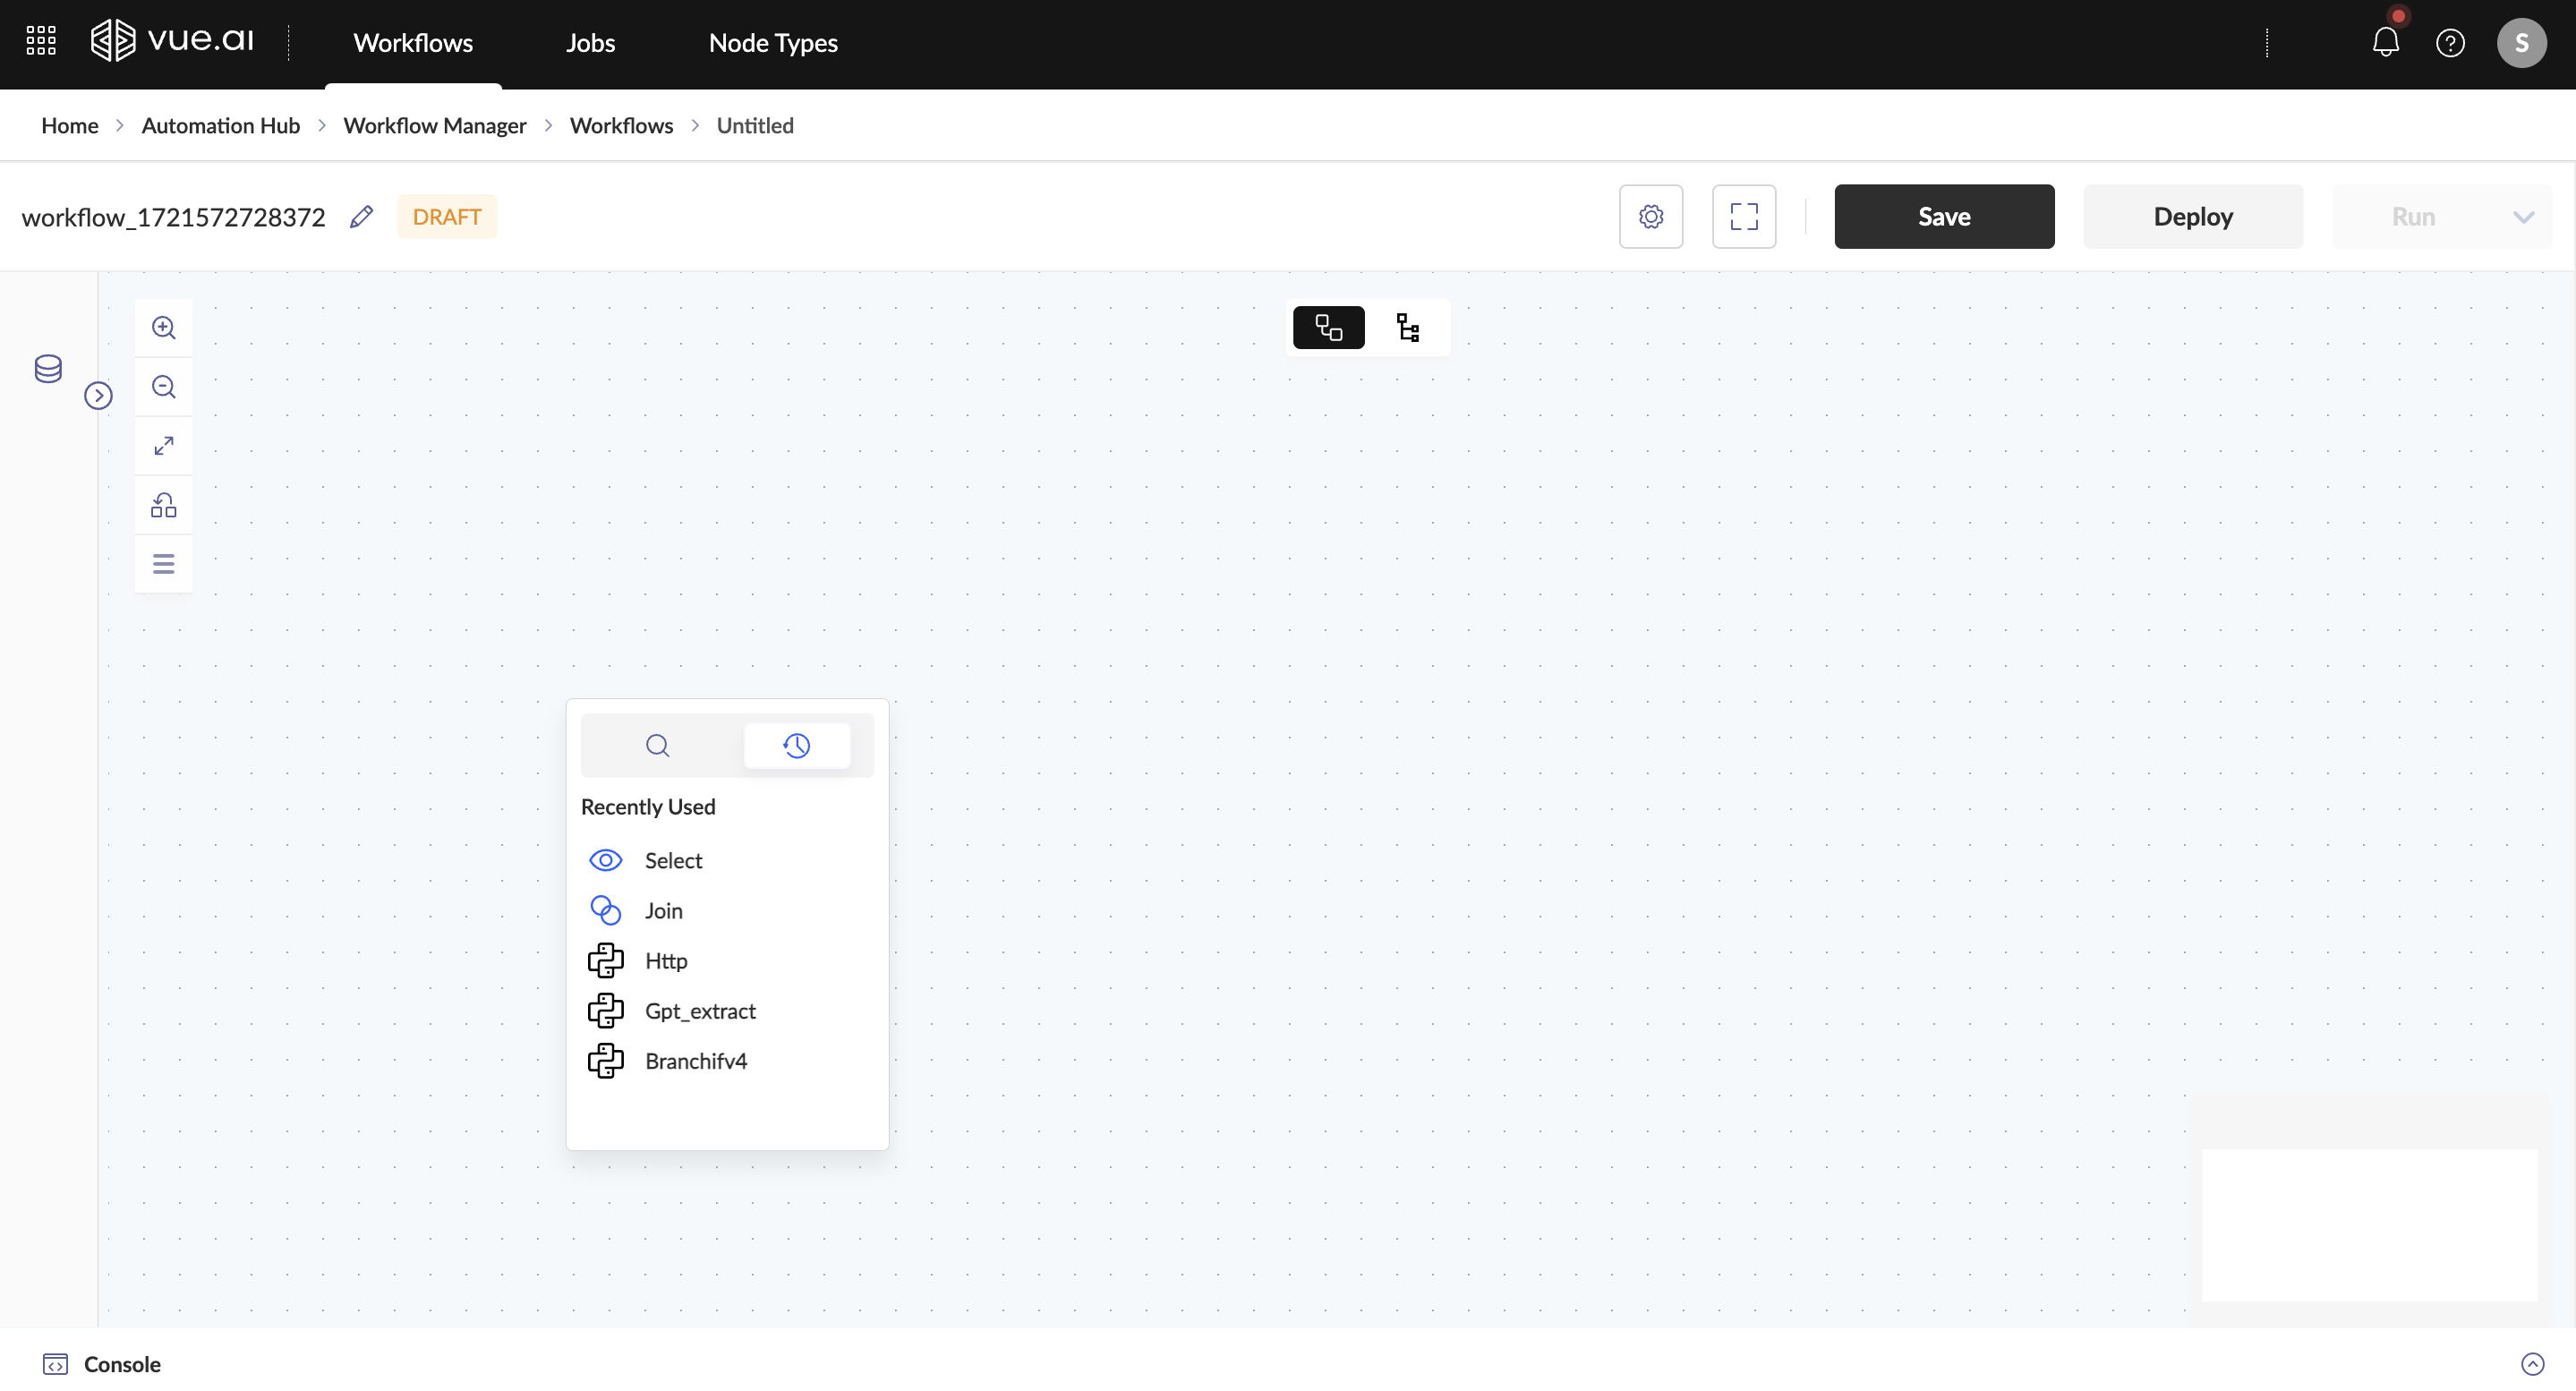
Configuring the Code Node
Once the node is added, it can be configured with the following parameters:
Name
- Enter a unique name (must be under 20 characters).
Description
- Optionally, provide a description for clarity.
Dataset
- Select the dataset to be processed by the node.
The node name must be less than 20 characters to avoid configuration issues. Provide meaningful descriptions to improve clarity.
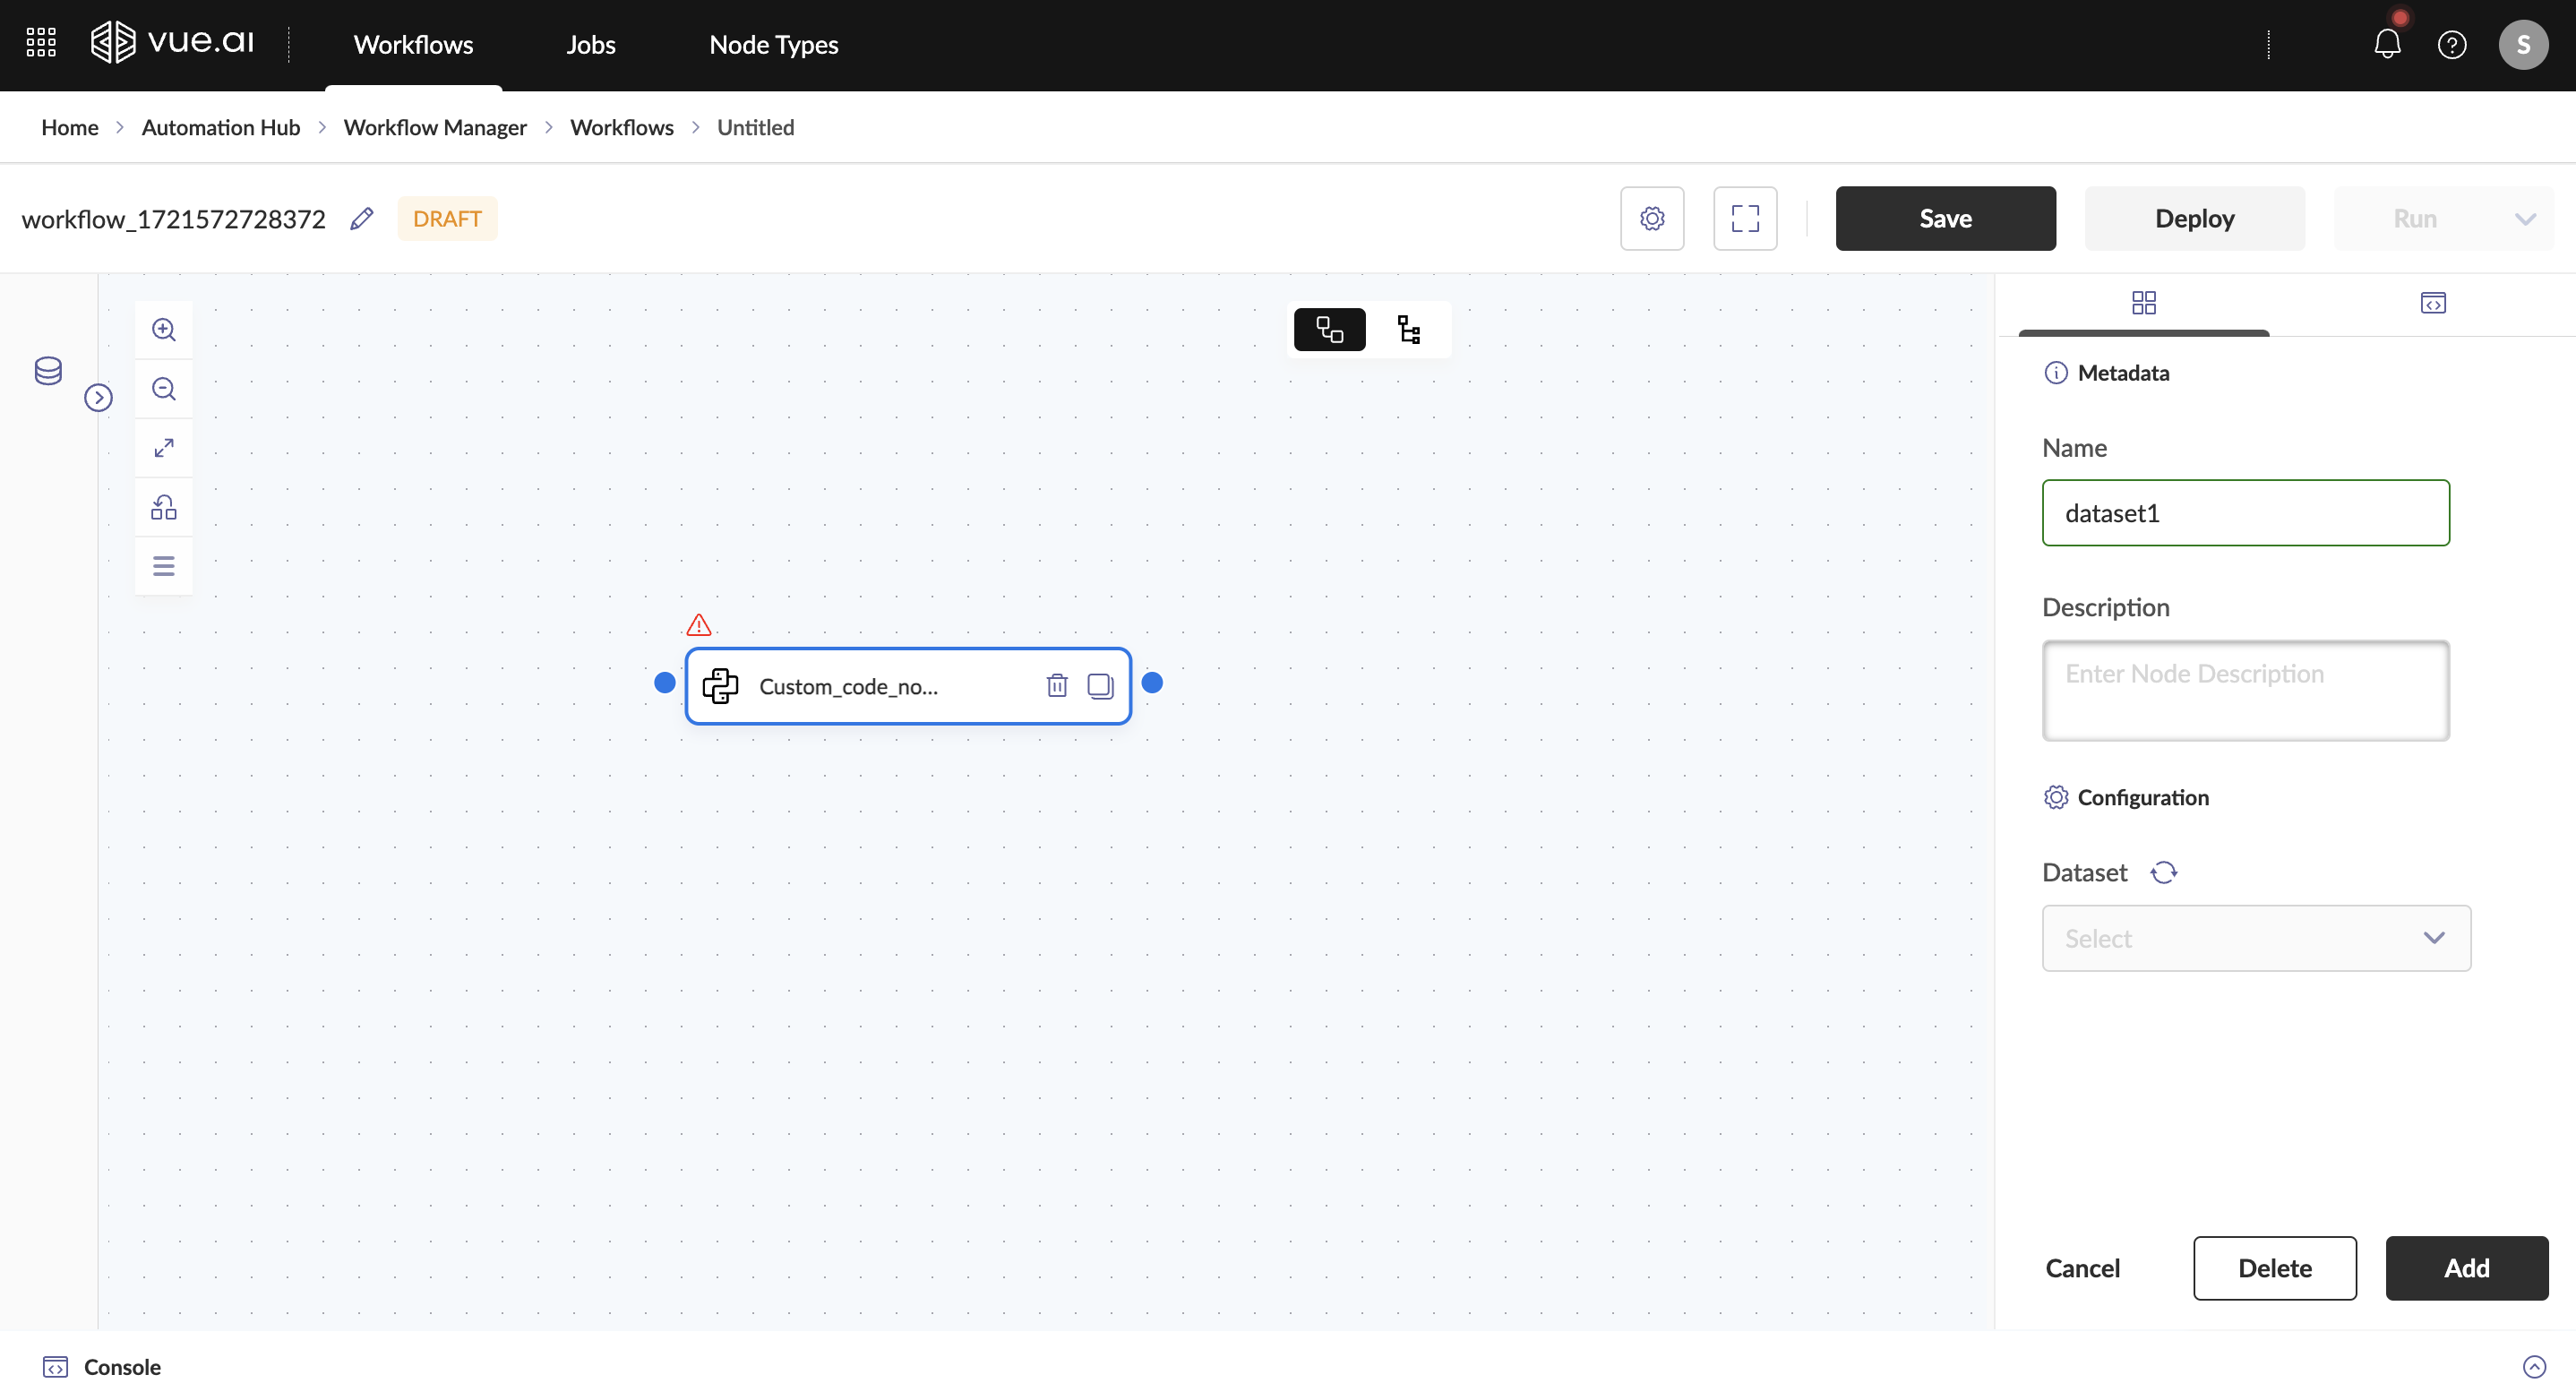
Saving the Configuration
Click the Add button to save the node configuration.
Running the Workflow
Once the workflow is set up, it can be executed in Speed Run mode by clicking the Play button on the sink node. After execution, the output should be reviewed to verify correctness.
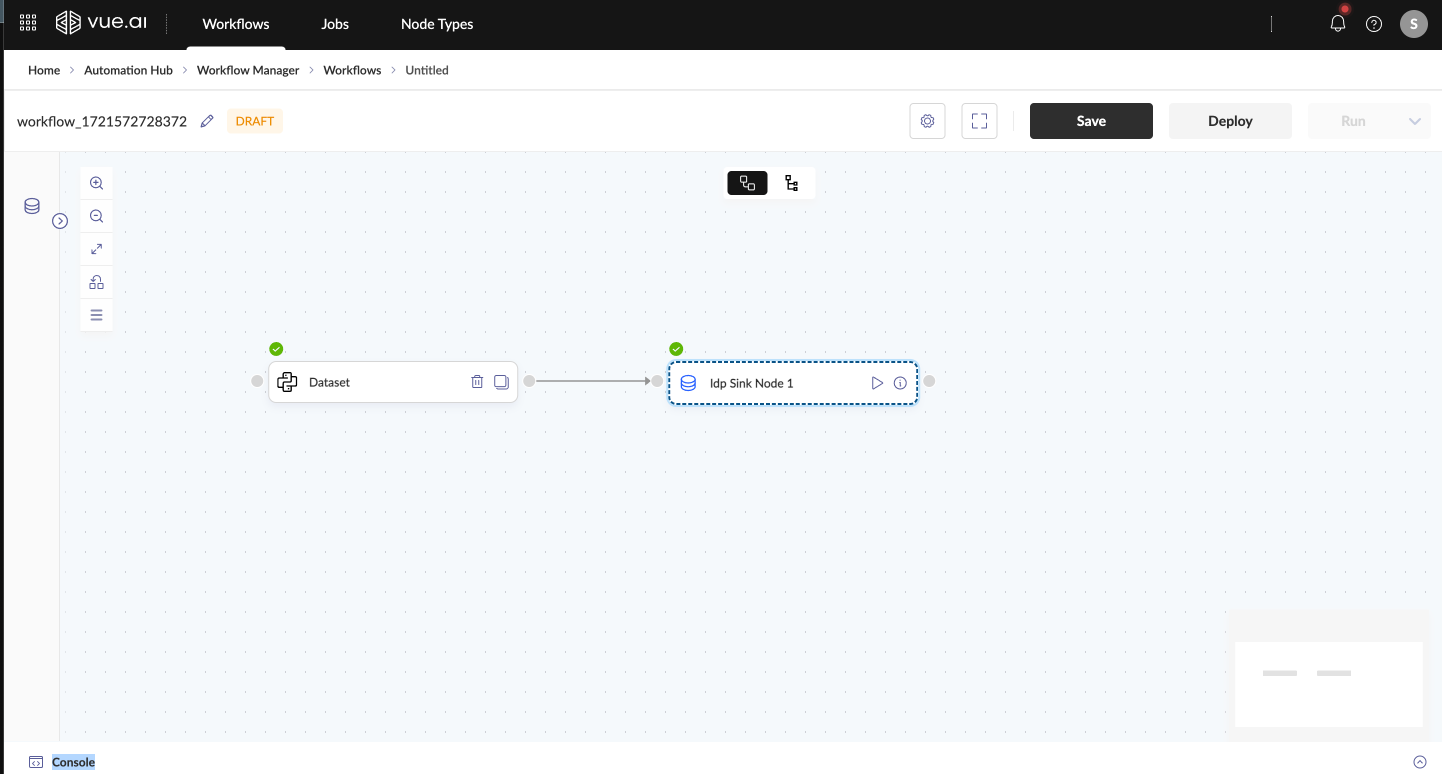
Viewing Sample Output
After execution, a sample output can be viewed to confirm the correctness of the workflow.
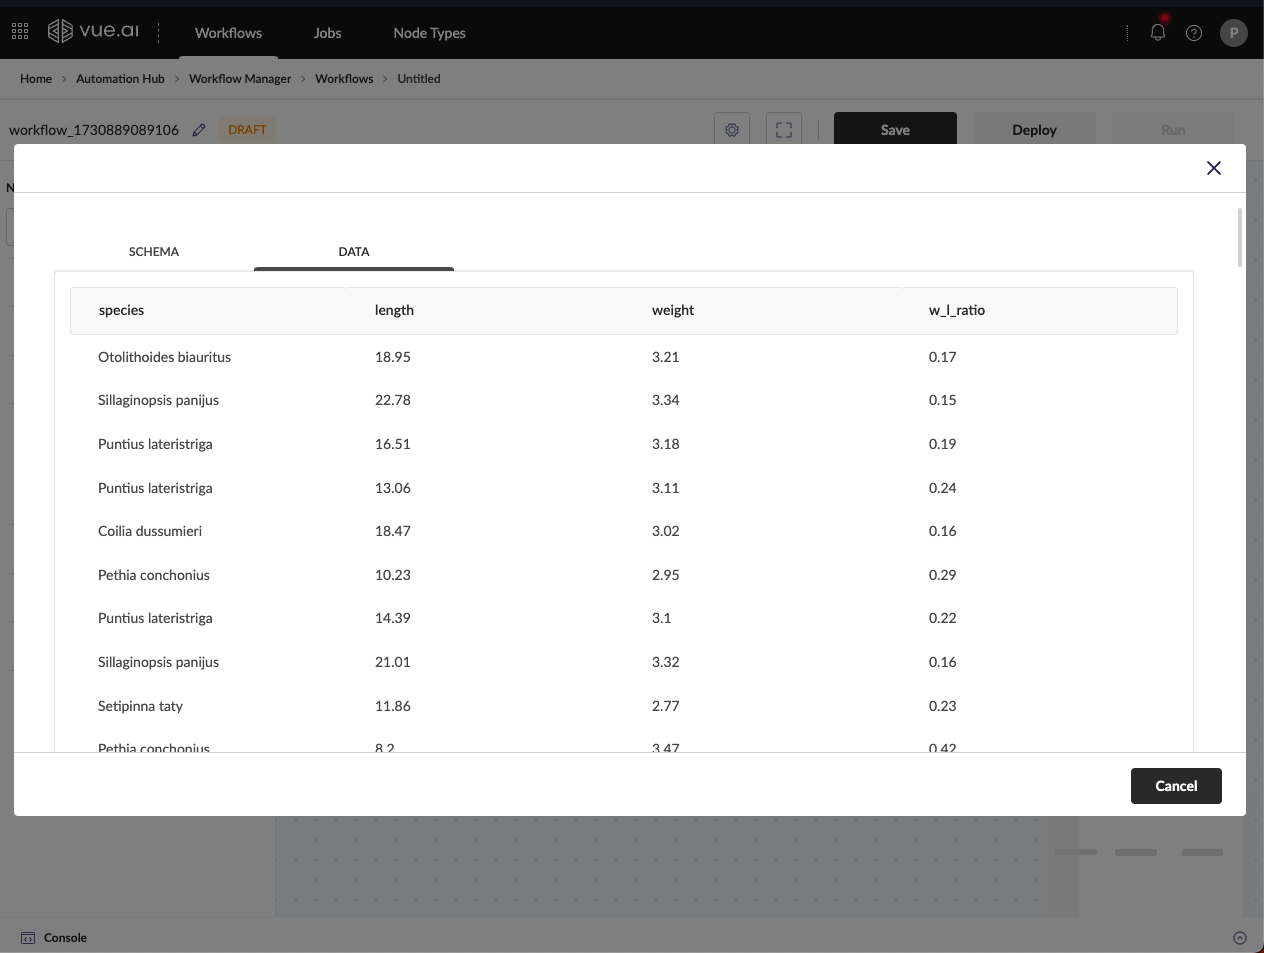
The persist dataset feature is not supported in the Speed Run mode. To persist dataset, use the Deploy Run mode. Speed Run mode is intended for quick verification of the workflow.
Speed run currently allows users to execute one node at a time. To run multiple nodes, execute them in sequence.
Speed Run Workflows with Sample Data
Speed Run enables users to execute workflows with sample data. This mode extracts a chunk of data from the selected dataset and executes the workflow, allowing for validation of logic, efficient testing and debugging.
To use sample data while performing speed run, make sure to check the Sample Data Run checkbox.
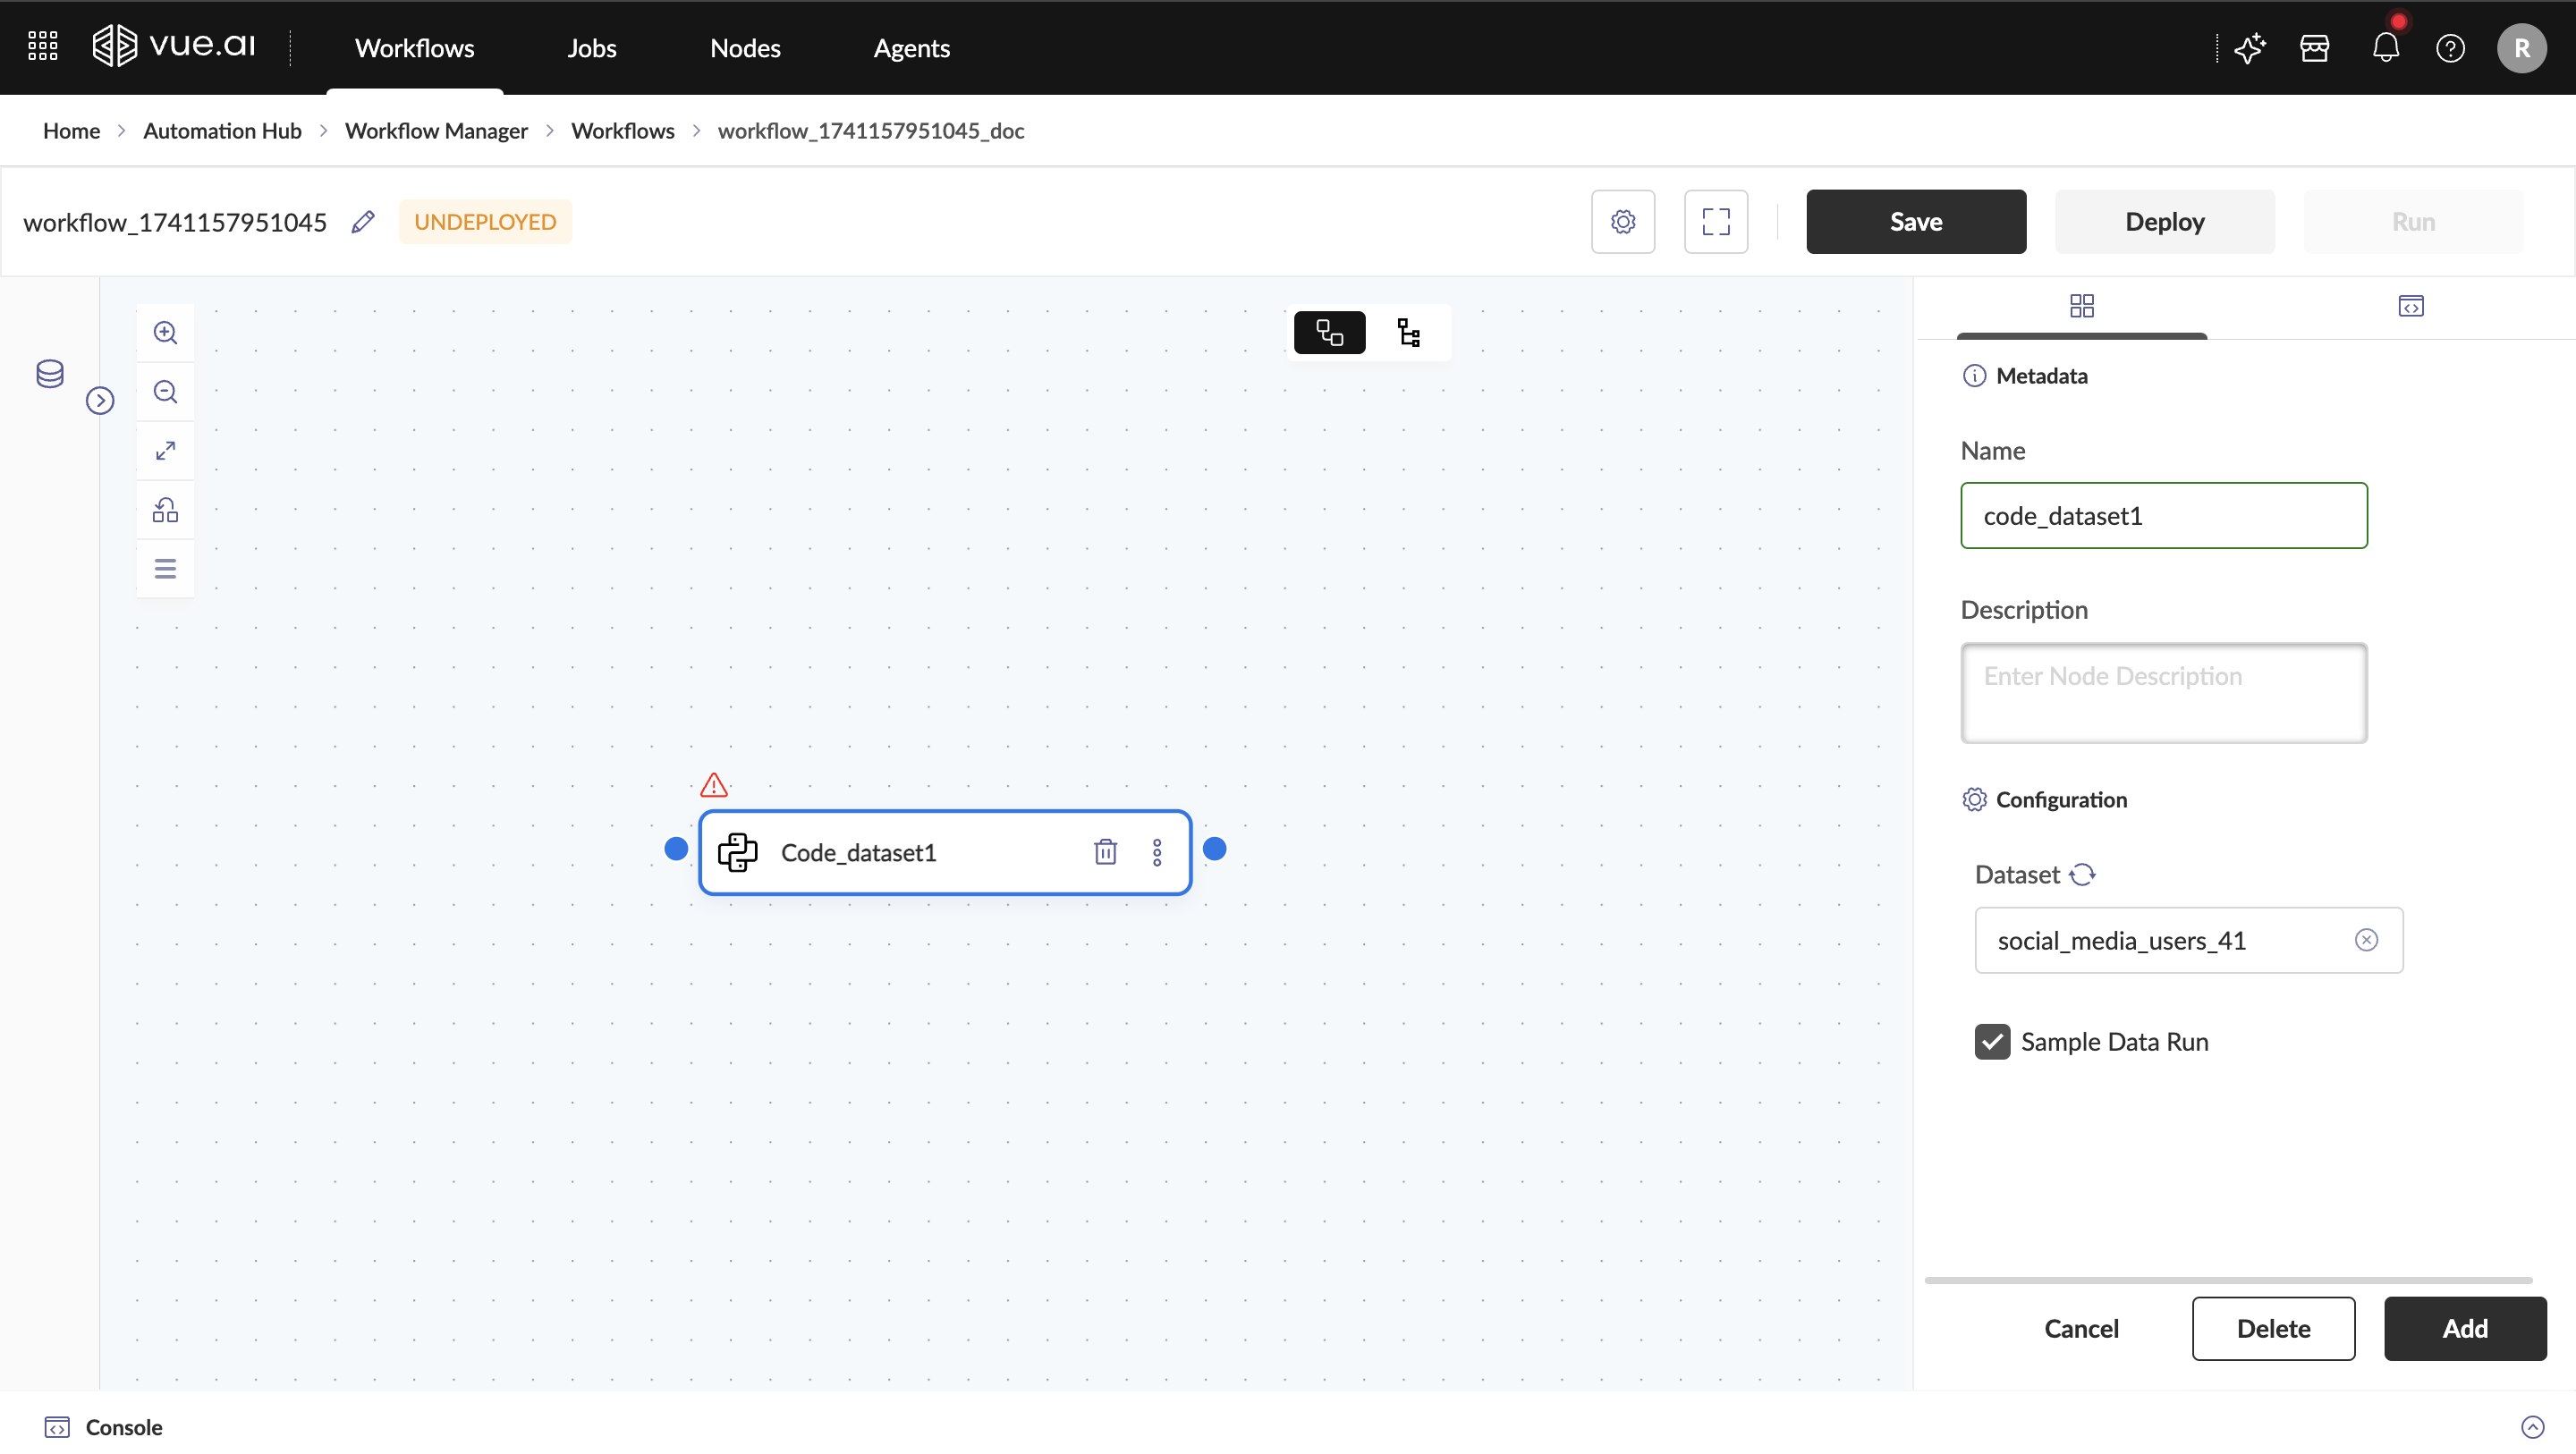
CSV Dataset Reader currently supports only CSV file format
Deploy the Workflow
Once the workflow is validated with speed run, it can be executed in Deploy Run mode
- Click on Deploy button to initiate the deployment process
- Once the workflow is deployed, Click the Run button to execute the workflow
Scheduling of custom code workflows is currently unavailable and will be enabled in future releases
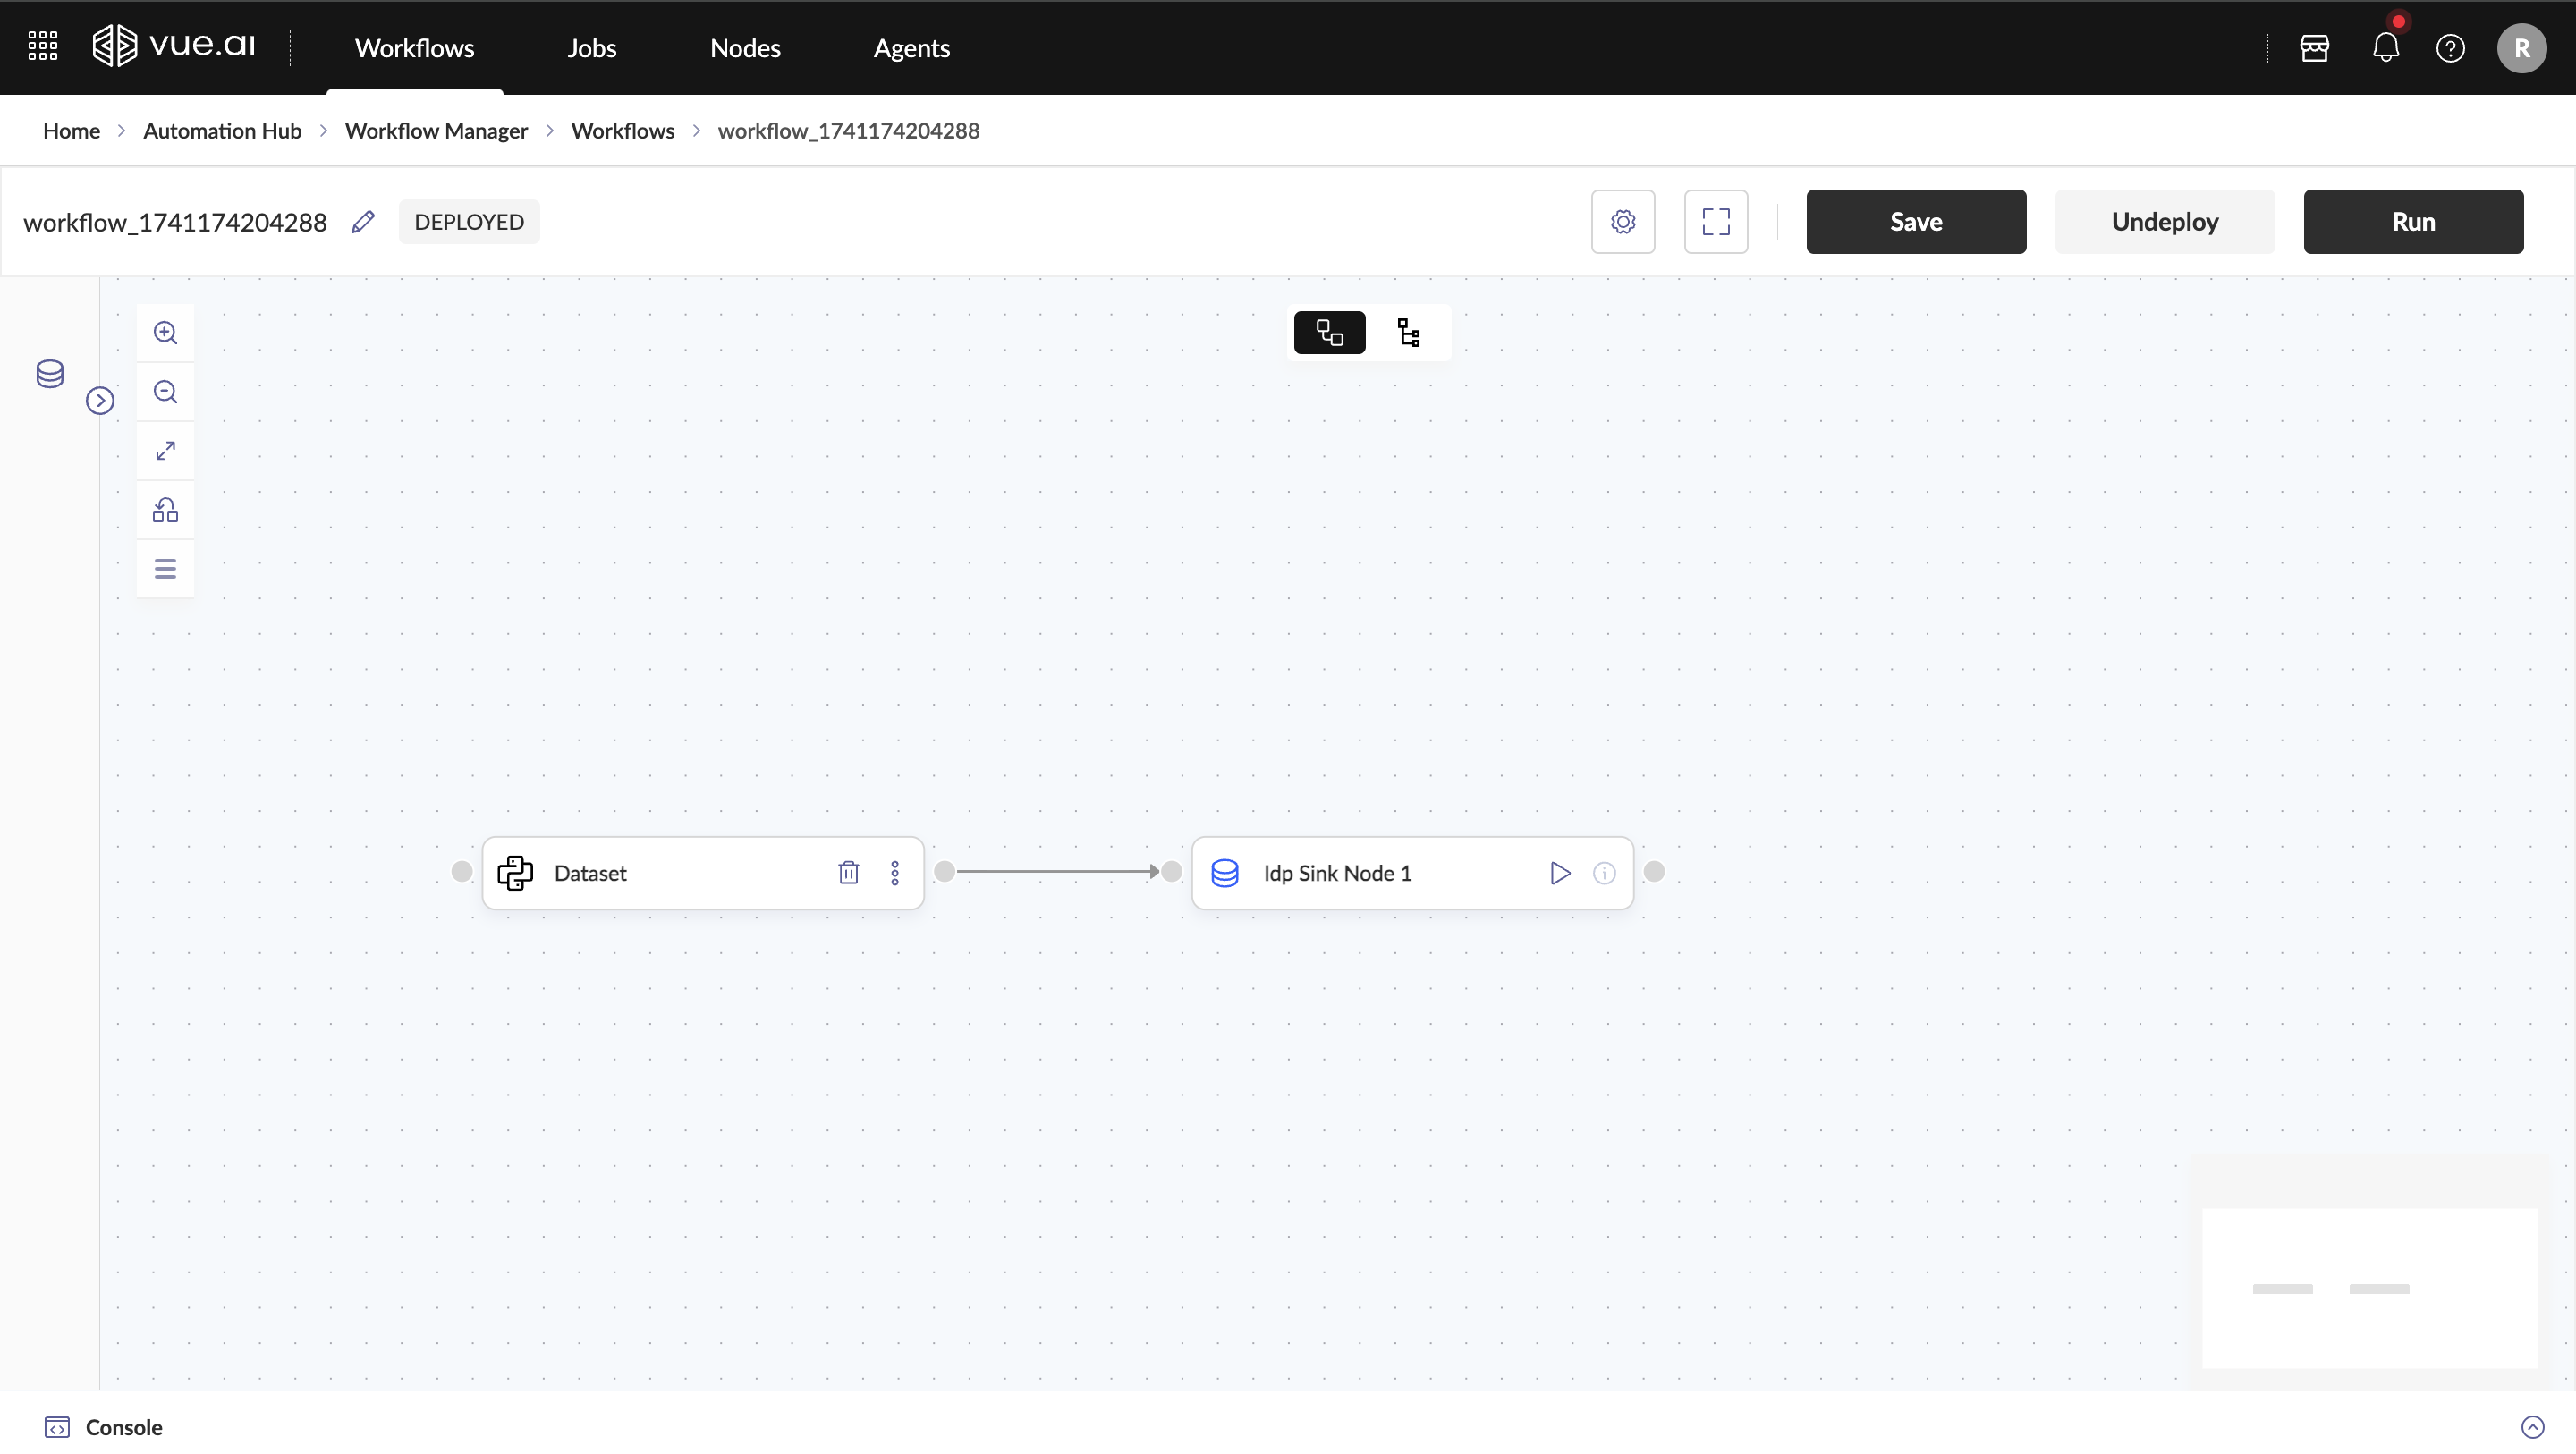
Refer to [section 4.9] regarding workflow deployment failures.
- Workflow run will be triggered and Click on Yes, Redirect to check the job status
Accessing Persisted Datasets
Once the job is completed, Click on the Sink Node to view the persisted dataset, it will redirect to the Datasets section of the Data Hub
All the persisted dataset are stored with
workflow_id_node_id_epochname
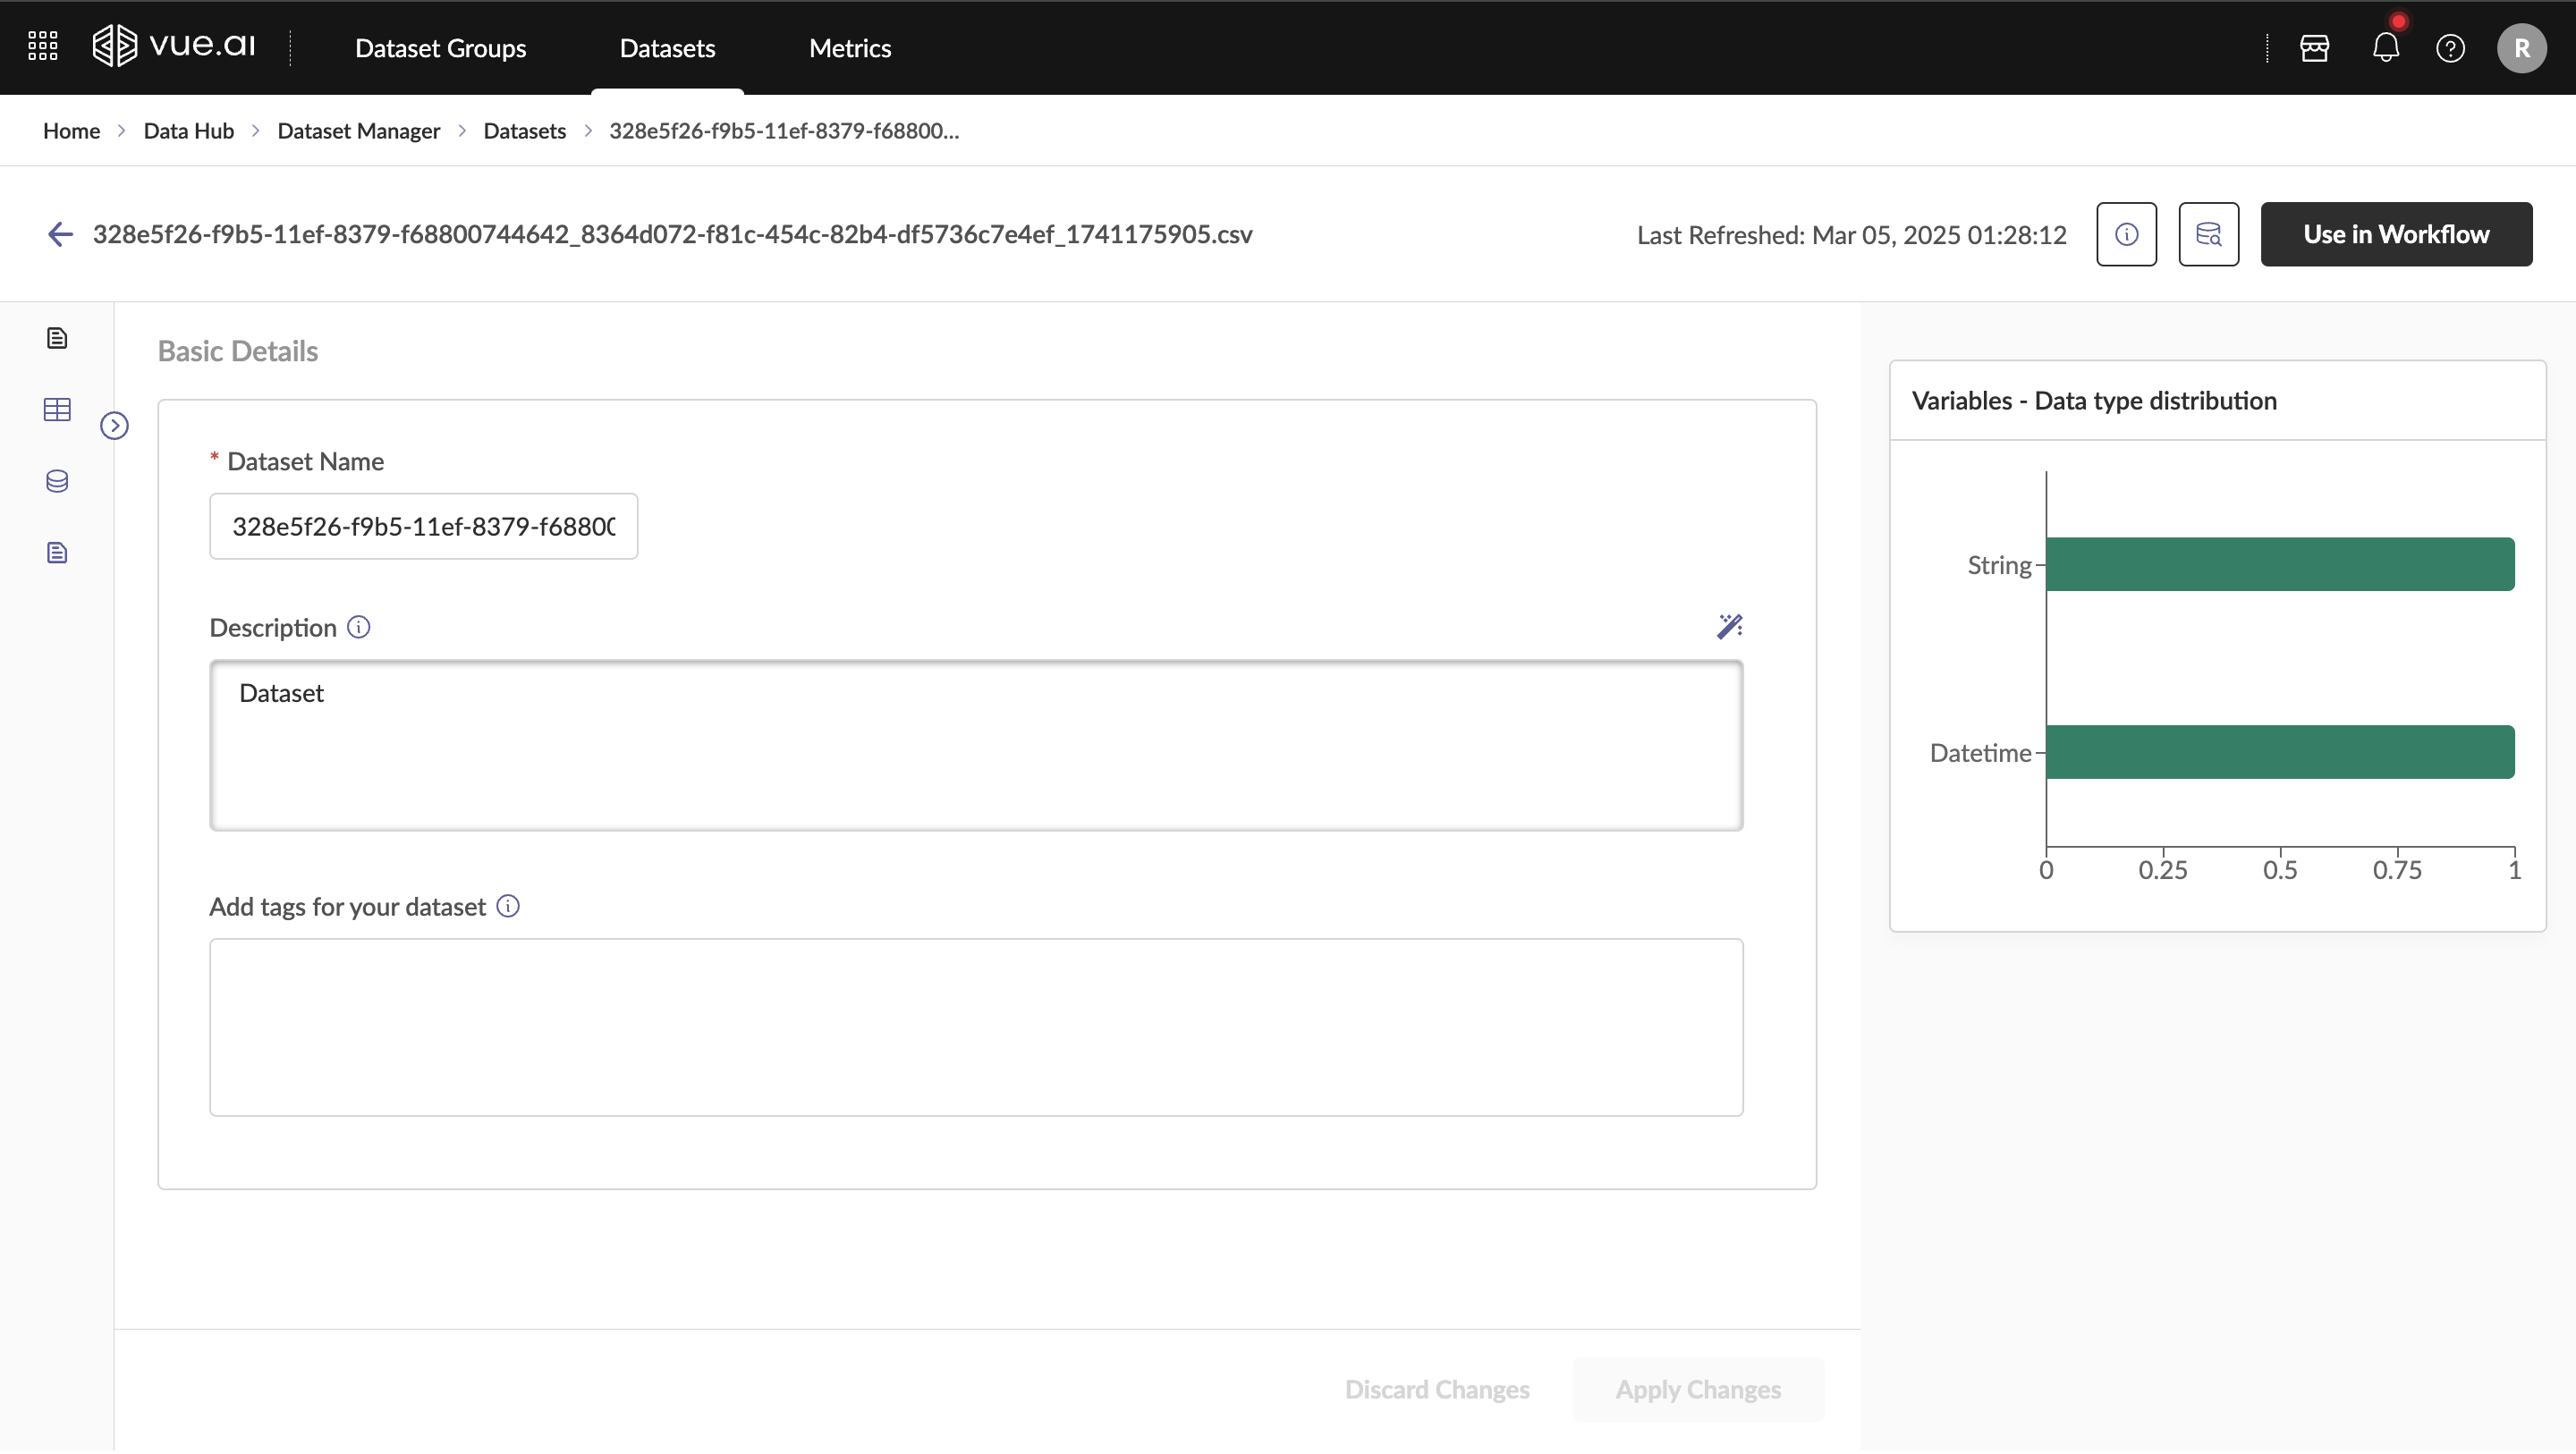
Ensure that Persist checkbox is checked before deploying the workflow
If there are any updates in the code node, the workflow must be undeployed and redeployed to reflect the changes. This ensures that the latest code changes are applied during execution.
Example Workflow
Consider you are building a model training workflow:
- You have the training data registered.
- You use the CSV Dataset Reader node to prepare the dataset, converting it into a Pandas DataFrame.
- The Model node then reads this Pandas DataFrame and proceeds with training the model.
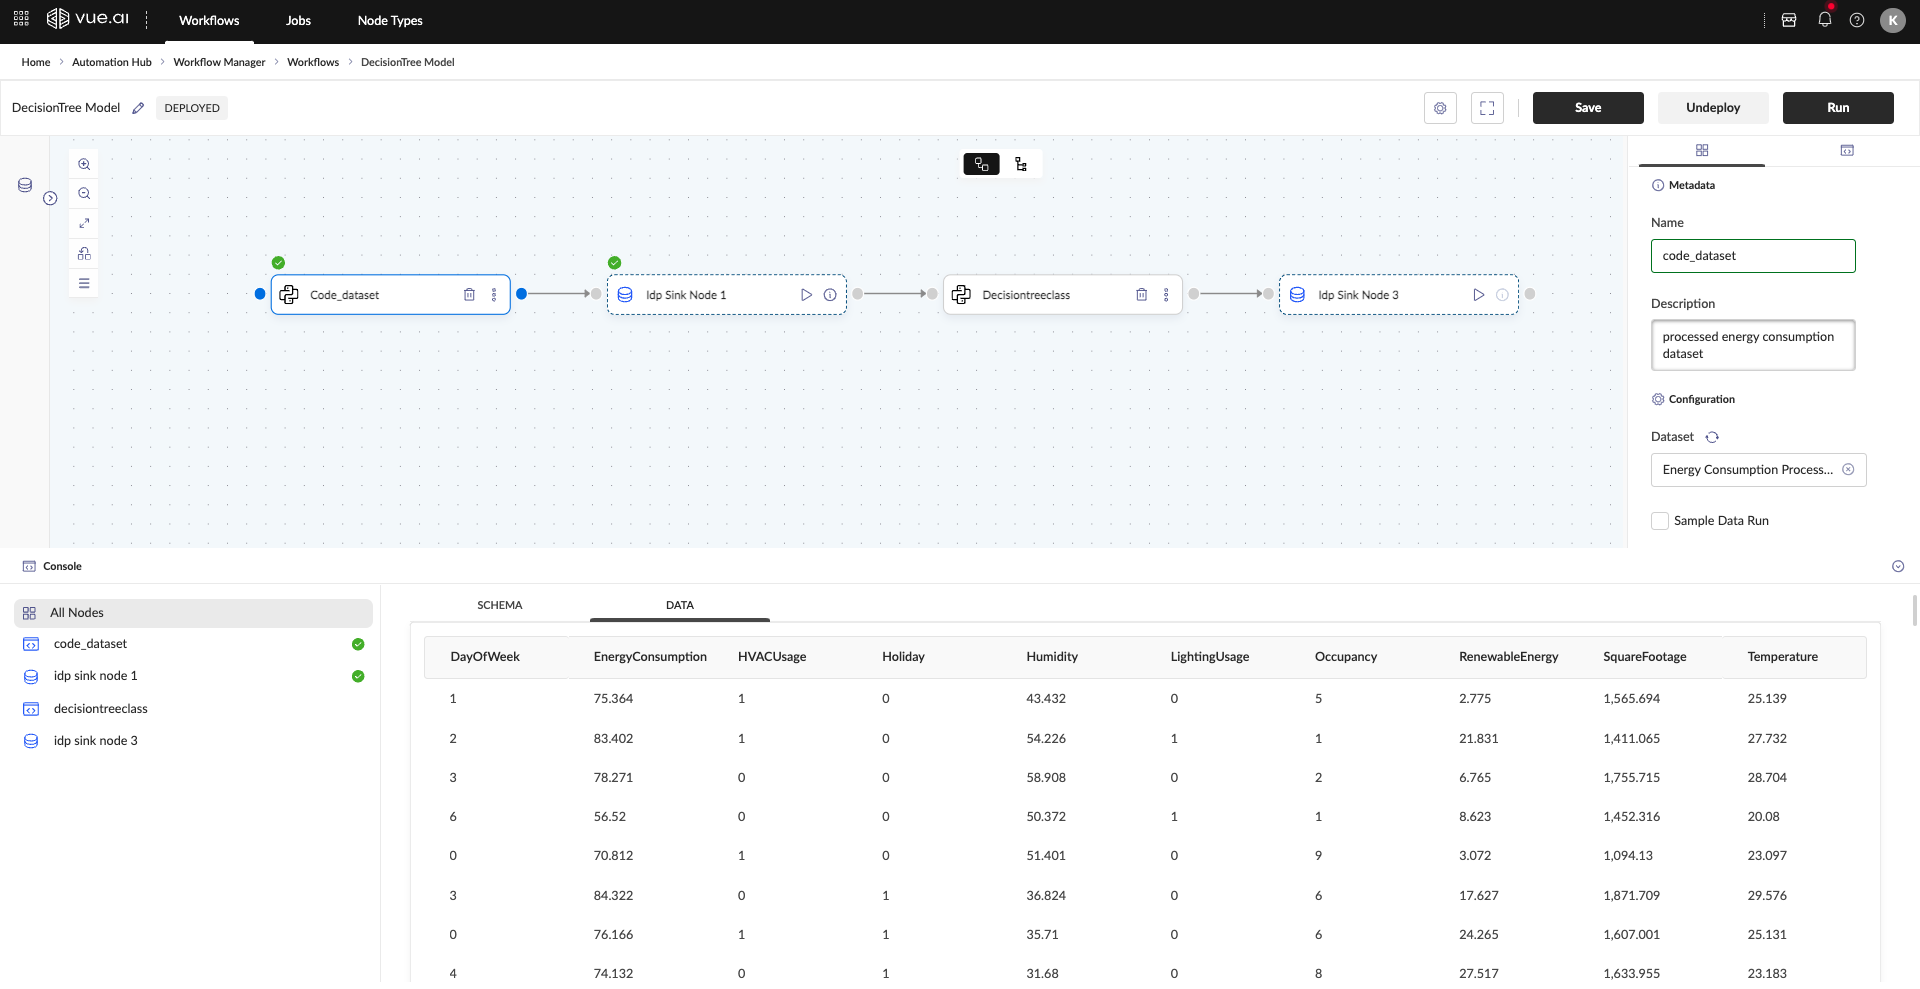
Workflow Deployment Failures:
Workflow Deployment Failures
Deployment failures can occur in two key scenarios:
Case 1
- If the deployment fails while setting up execution environment.
- The reasons for these failures will be displayed on the workflow canvas next to the workflow name.
- The users are allowed to reattempt DEPLOY since no deployment exists yet.

Case 2
- If the deployment initially succeeds but later encounters a pod failure, the existing setup becomes invalid.
- In such cases, the reason for failure is displayed above the respective node, and the complete message can be viewed by hovering over it.
- The correct action is to UNDEPLOY before making fixes and redeploying.
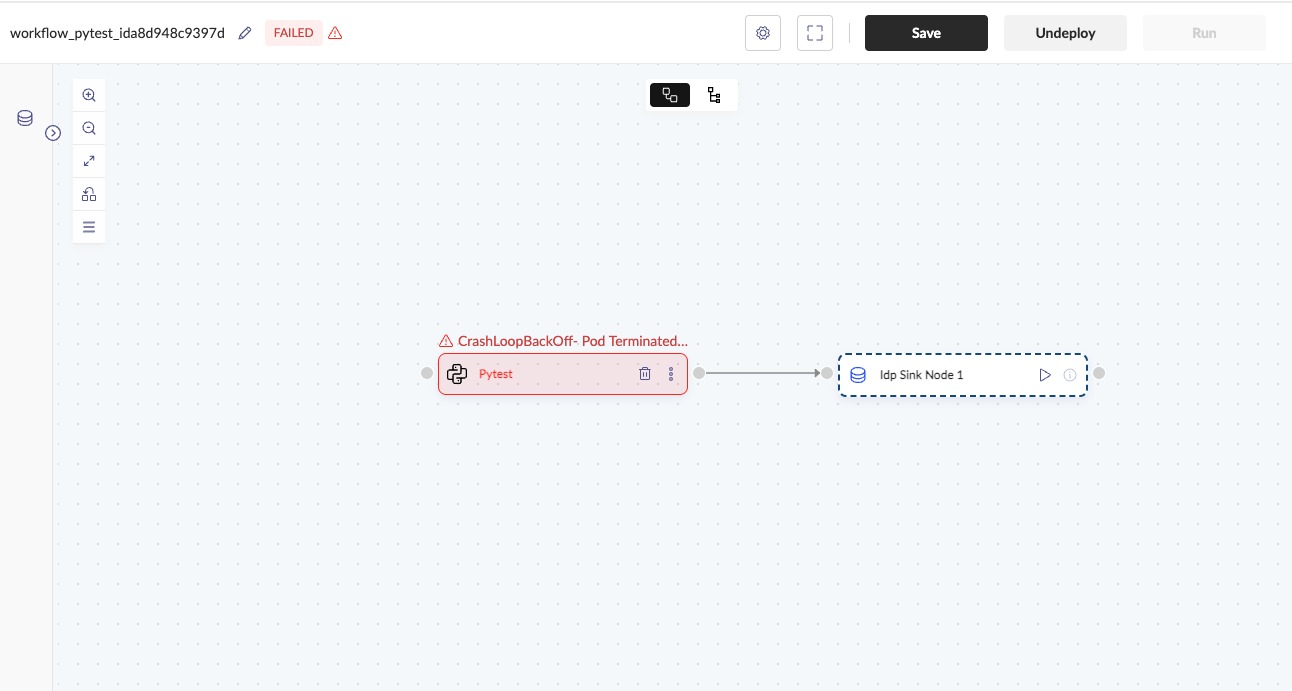
Example Failures
- CrashLoopBackOff- Pod Terminated: Error : Indicates an issue with code execution, potentially due to missing or incorrect imports.
- CrashLoopBackOff- Pod Terminated: OOMKilled : Indicates insufficient resources for execution. This can be addressed by updating the deployment configuration of the node.
- Node:
your_nodenot found in configs list (or) node not active : Indicates that the node is not yet active, likely due to the absence of an image. Either wait for the image to be built or commit a change to trigger the image build and activate the node.
Troubleshooting
Common Issues and Solutions
Problem 1: Node Configuration Errors Cause: The name is over 20 characters. Solution: Ensure the name is under 20 characters.
Problem 2: Dataset Issues Cause: The dataset is not correctly registered or formatted. Solution: Verify that the dataset is correctly registered and formatted.
Problem 3: Execution Errors Cause: Missing data or incorrect syntax. Solution: Check the logs for errors.
Problem 4: Exceeded Retry Limit Error Cause: Insufficient memory in the pods Solution: Increase the Memory Request and Memory Limit in the deployment config, then retry deploying the workflow
Additional Information
Support for Multiple Input Nodes Workflows support multiple input nodes with the help of CSV Dataset Readers, allowing the users to integrate multiple data sources in a single execution. Each CSV Dataset Reader can be configured to fetch data from a specific dataset which can be processed by the subsequent nodes in the workflow.
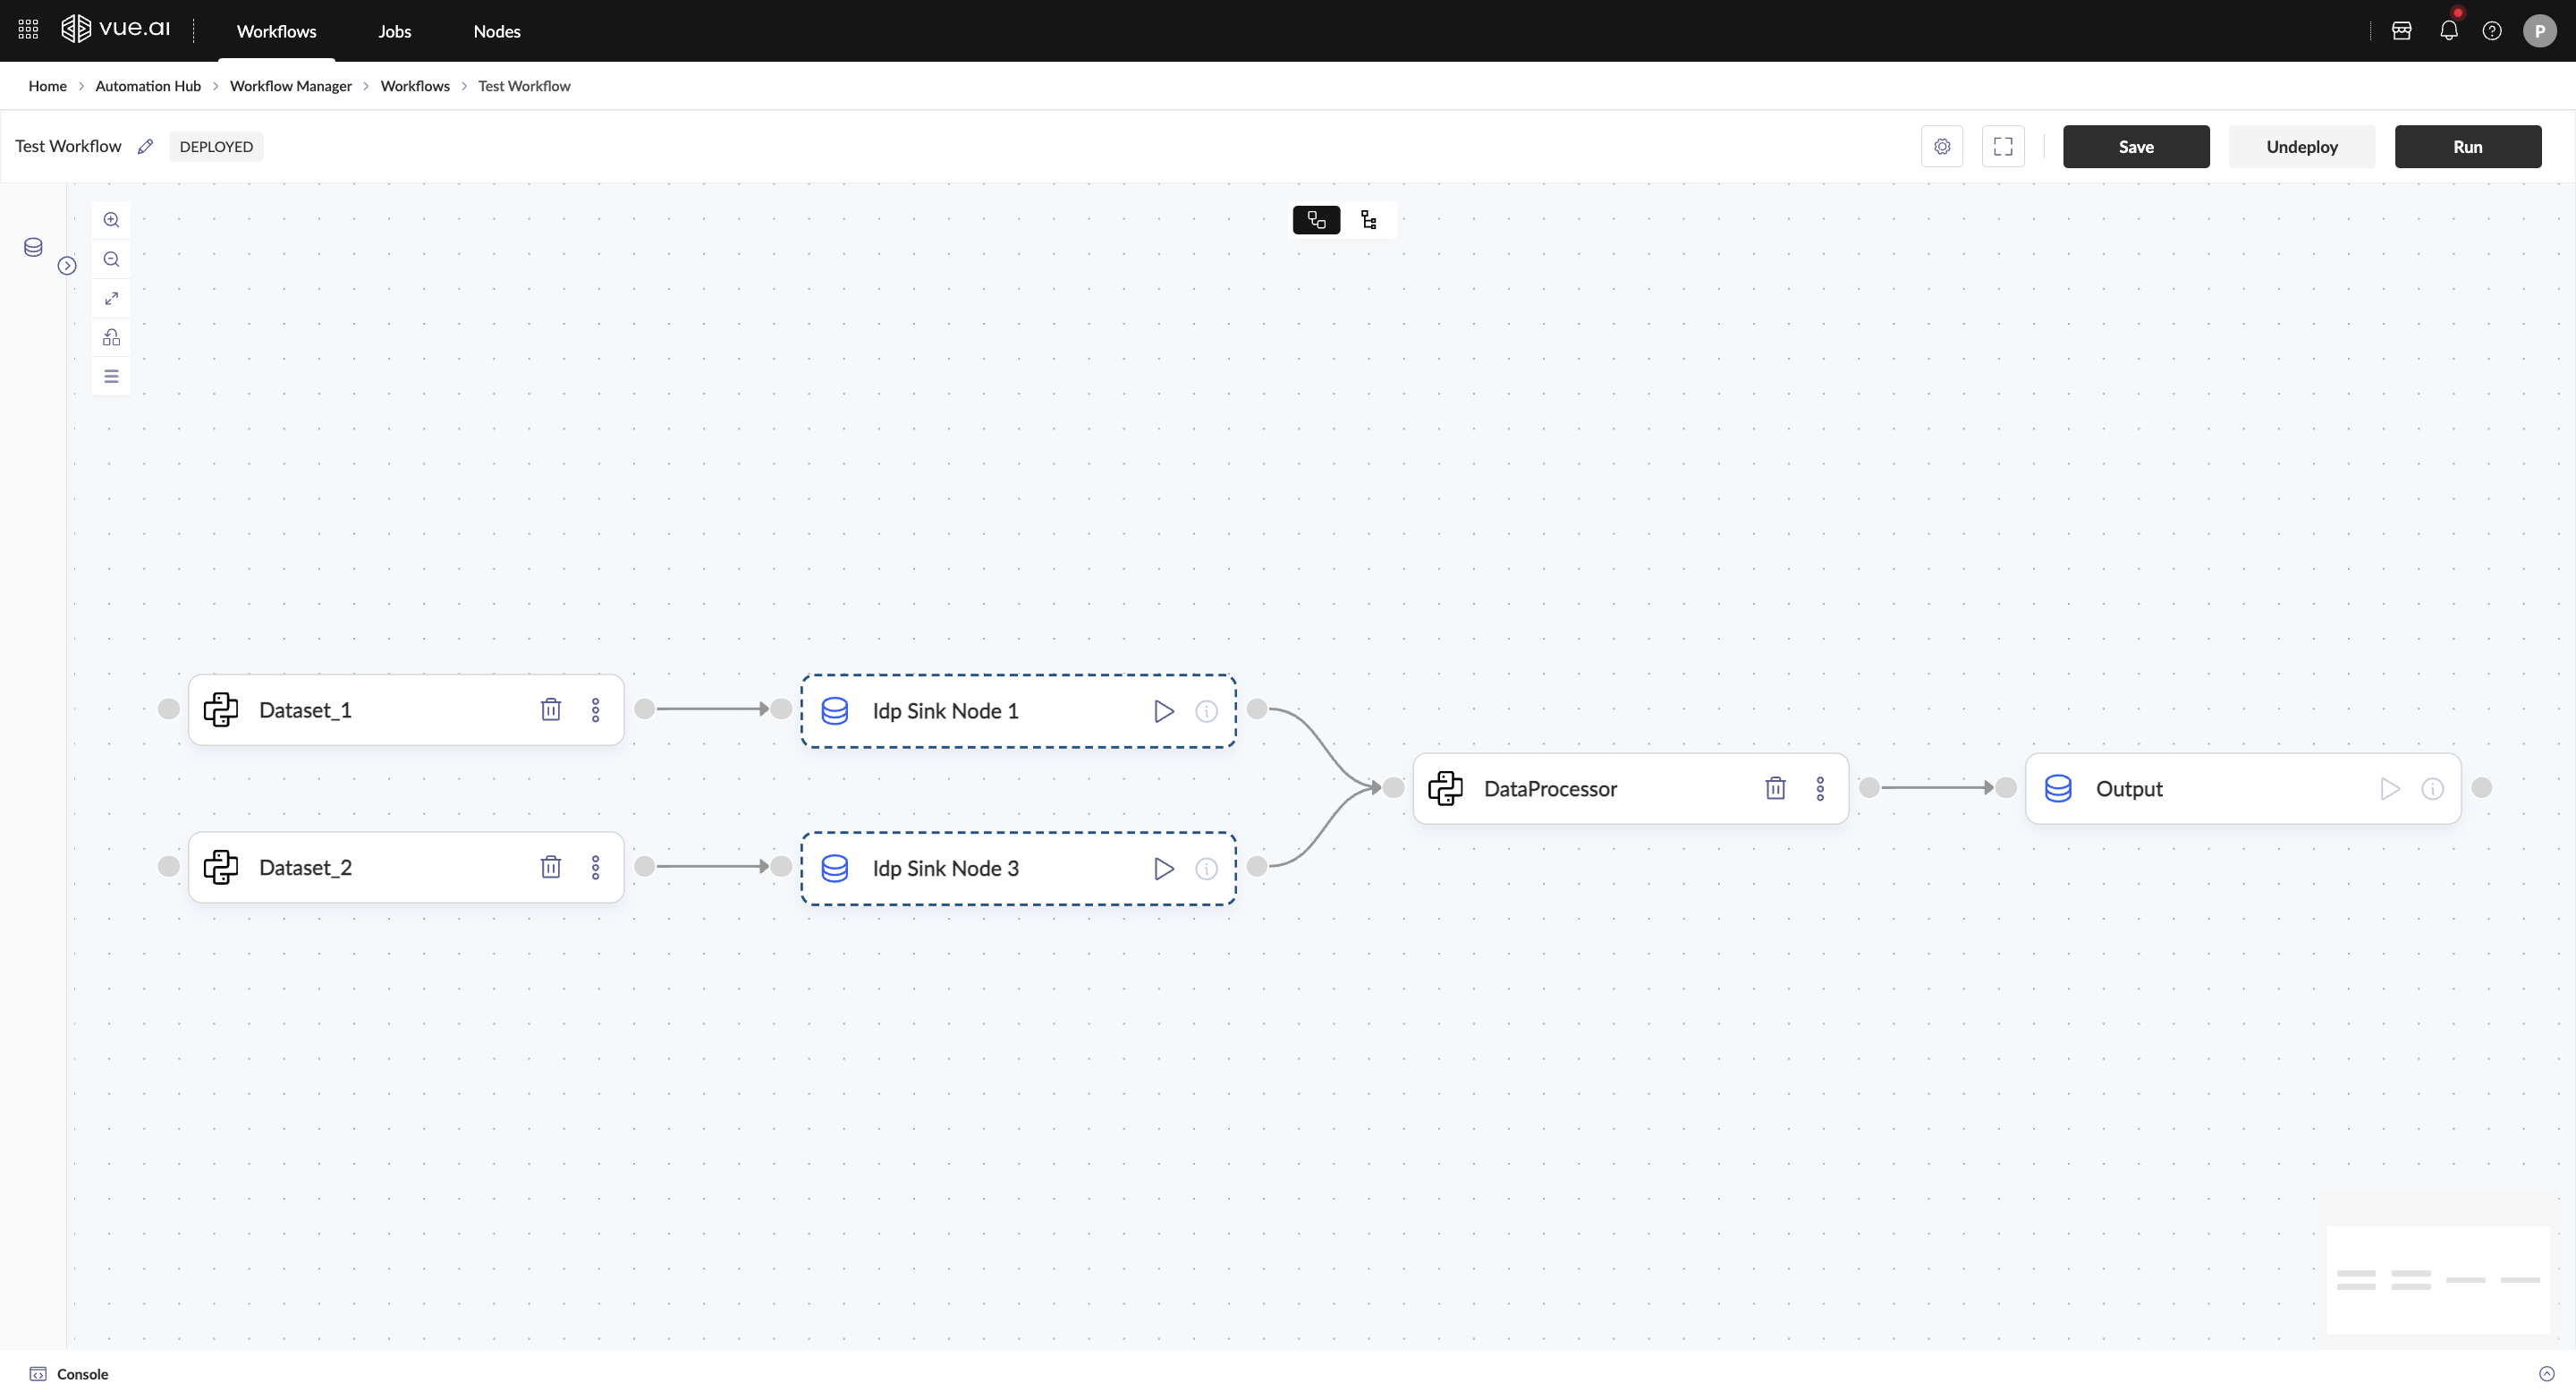
The CSV Dataset Reader node formats registered datasets for use in custom code nodes. It converts datasets into a Pandas DataFrame, enabling further manipulation and processing. The CSV Dataset Reader node outputs a Pandas DataFrame that subsequent code nodes can process. This ensures the dataset is correctly structured for advanced data operations.
- The workflow's control flow follows the sequence in which nodes are added to the canvas.
- Ensure appropriate node usage: Transform nodes and Custom Code nodes cannot be used together.
- Keep node names concise and clear for better readability on the canvas, ensuring smoother workflow deployment.
- Ensure that the correct deployment configuration is specified for custom nodes in the workflow to enable a seamless deployment process.
Consider a machine learning workflow where: A registered dataset is used for training. The CSV Dataset Reader node converts it into a Pandas DataFrame. The Model Node reads the DataFrame and proceeds with training.
FAQ
What is the maximum length for a node name?
The node name must be under 20 characters to avoid configuration issues.
How do I pass a dataset to a custom code node?
Use the CSV Dataset Reader node to format the dataset as a Pandas DataFrame.
Can I use multiple code nodes in one workflow?
Yes, multiple code nodes can be used in a single workflow, depending on the complexity of the automation process.
Can I schedule code node workflows?
Scheduling of custom code workflows is currently unavailable and will be enabled in future releases.
Summary
- Custom Code Nodes provide the flexibility to run custom logic in workflows.
- These nodes can be added via drag and drop or by right-clicking on the canvas.
- Configuration involves setting a name, description, and dataset.
- The CSV Dataset Reader node ensures proper dataset formatting.
- Execution is done via the Play button, with output verification available.
- This structured approach ensures a smooth experience in setting up and using Custom Code Nodes within workflow automation.
Compute Node Workflows
Welcome to the Compute Node Workflows guide! This guide is designed to assist in understanding the role of Compute Node Workflows in automated document analysis and data extraction and learning how to create, configure, deploy, and execute a Compute Node Workflow.
Familiarity with the concept of Intelligent Document Processing (IDP) is assumed.
Overview
Compute Node Workflows are fundamental to Intelligent Document Processing (IDP), enabling:
- Automation of model training
- Dynamic dataset computation
- Document segmentation
- Intelligent content transformation
- High-speed OCR and recognition
- Real-time and batch processing
Prerequisites Before beginning, it is recommended that:
- The "Getting Started with Workflows" documentation is thoroughly reviewed.
Navigation
To access the workflows, the following path is followed: Automation Hub → Workflow Manager → Workflows. This opens the Workflows listing page.
Step-by-Step Instructions
Creating a New Workflow
A new workflow is created by clicking + New Workflow, which opens the workflow canvas. The workflow can be renamed by clicking the Edit button and updating the name.
Building the Workflow
Nodes are added using:
Drag & Drop: Hover over the Nodes section, search for a node, and drag it onto the canvas.
Right-Click Menu: Right-click on the canvas, search for a node, and select it. Recently used nodes appear in the menu.
In the left panel under the Compute Nodes section, you will find the following preset nodes:
- Auto Classifier Training: Automates training for document classification models.
- Auto Classifier: Automatically categorizes documents based on learned patterns.
- Compute Dataset: Prepares datasets for analysis or training tasks.
- Dataset Metrics: Provides performance and quality metrics for datasets.
- Deskew: Corrects skew in document images for better readability and processing.
- Embedding Generation: Generates vector representations of document content for machine learning.
- ID Card Detection: Identifies and extracts information from ID cards.
- idp_sink: Serves as a destination node for processed data.
- Learn DocType: Learns and identifies document types based on input samples.
- OCR Multithreaded: Performs high-speed OCR with multithreading.
- Page Splitter: Splits multipage documents into individual pages.
- Textract: Extracts text and data using advanced OCR techniques.
- Trainconv: Trains models for conversational or document-specific tasks.
- Artifact: Manages and stores intermediate or final workflow artifacts.
- Section Generation Structured: Generates structured sections from documents.
- sec_clf_trig: Triggers section classification workflows based on rules.
- sec_clf_train: Trains models for accurate section classification.
Ensure all required parameters are correctly configured and all nodes are correctly linked.
Troubleshooting
Common Issues and Solutions
Problem: Issues while creating or executing a Compute Node Workflow Solution:
- Ensure all required parameters are correctly configured.
- Verify that all nodes are correctly linked.
- Review the workflow's status in the dashboard for error messages.
- Refer to the "Getting Started with Workflows" documentation for additional support.
Additional Information
Compute Node Workflows support real-time and batch processing, enabling seamless integration into existing automation pipelines. They provide robust performance for document classification, OCR, and machine learning-based transformations.
- The workflow's control flow follows the sequence in which nodes are added to the canvas.
- Ensure appropriate node usage: Transform nodes and Compute nodes cannot be used together.
- Keep node names concise and clear for better readability on the canvas, ensuring smoother workflow deployment.
FAQ
What are Compute Node Workflows?
Compute Node Workflows are essential for Intelligent Document Processing (IDP), automating tasks like document classification, feature extraction, and embedding generation. They handle both structured and unstructured data efficiently.
How do I add nodes to a Compute Node Workflow?
You can add nodes in two ways:
- Drag & Drop: Hover over the Nodes section, search for the desired node, and drag it onto the workflow canvas.
- Right-Click Menu: Right-click on the canvas, search for the node, and select it to add. The menu also shows recently used nodes.
What types of nodes are available in Compute Node Workflows?
Available nodes include:
- Auto Classifier Training
- Auto Classifier
- Compute Dataset
- Dataset Metrics
- Deskew
- Embedding Generation
- ID Card Detection
- idp_sink
- Learn DocType
- OCR Multithreaded
- Page Splitter
- Textract
- Trainconv
- Artifact
- Section Generation Structured
- sec_clf_trig
- sec_clf_train
How do I deploy and run a Compute Node Workflow?
- Click Deploy to deploy the workflow.
- Click Run to start the workflow.
- Monitor the workflow's job status in the dashboard.
Summary
- The guide covered navigation to the Workflows listing.
- Creation of a Compute Node Workflow was explained.
- Building, configuring, and linking nodes were detailed.
- Deployment and execution of the workflow were outlined.
By following these steps, complex Intelligent Document Processing (IDP) tasks can be effectively automated using Compute Node Workflows.
Spark Node Workflows
Welcome to the Spark Node Workflows guide! This guide is designed to assist users in understanding and utilizing Spark Node Workflows on the Vue.ai platform.
Ensure a basic understanding of Spark and workflows, along with familiarity with Vue.ai's Workflow Manager, is possessed before starting. For introductory details, refer to Getting Started With Workflows.
Overview
Spark Node Workflows support a wide range of use cases, including:
- Feature engineering
- Geospatial analysis
- Natural language processing
- Scalable data warehousing
With its in-memory processing, Spark efficiently handles structured, semi-structured, and unstructured data at high speed. In workflow automation, Spark nodes enable seamless execution of data processing tasks within a unified, scalable engine.
Prerequisites Before beginning, ensure the following are understood:
- Basic understanding of Spark and workflows
- Familiarity with Vue.ai's Workflow Manager
Step-by-Step Instructions
Navigating to Node Types
Navigate to Node Types
- Navigate to: Automation Hub → Workflow Manager → Node Types
- This opens the Node Types Listing Page, where workflow nodes can be managed and configured.
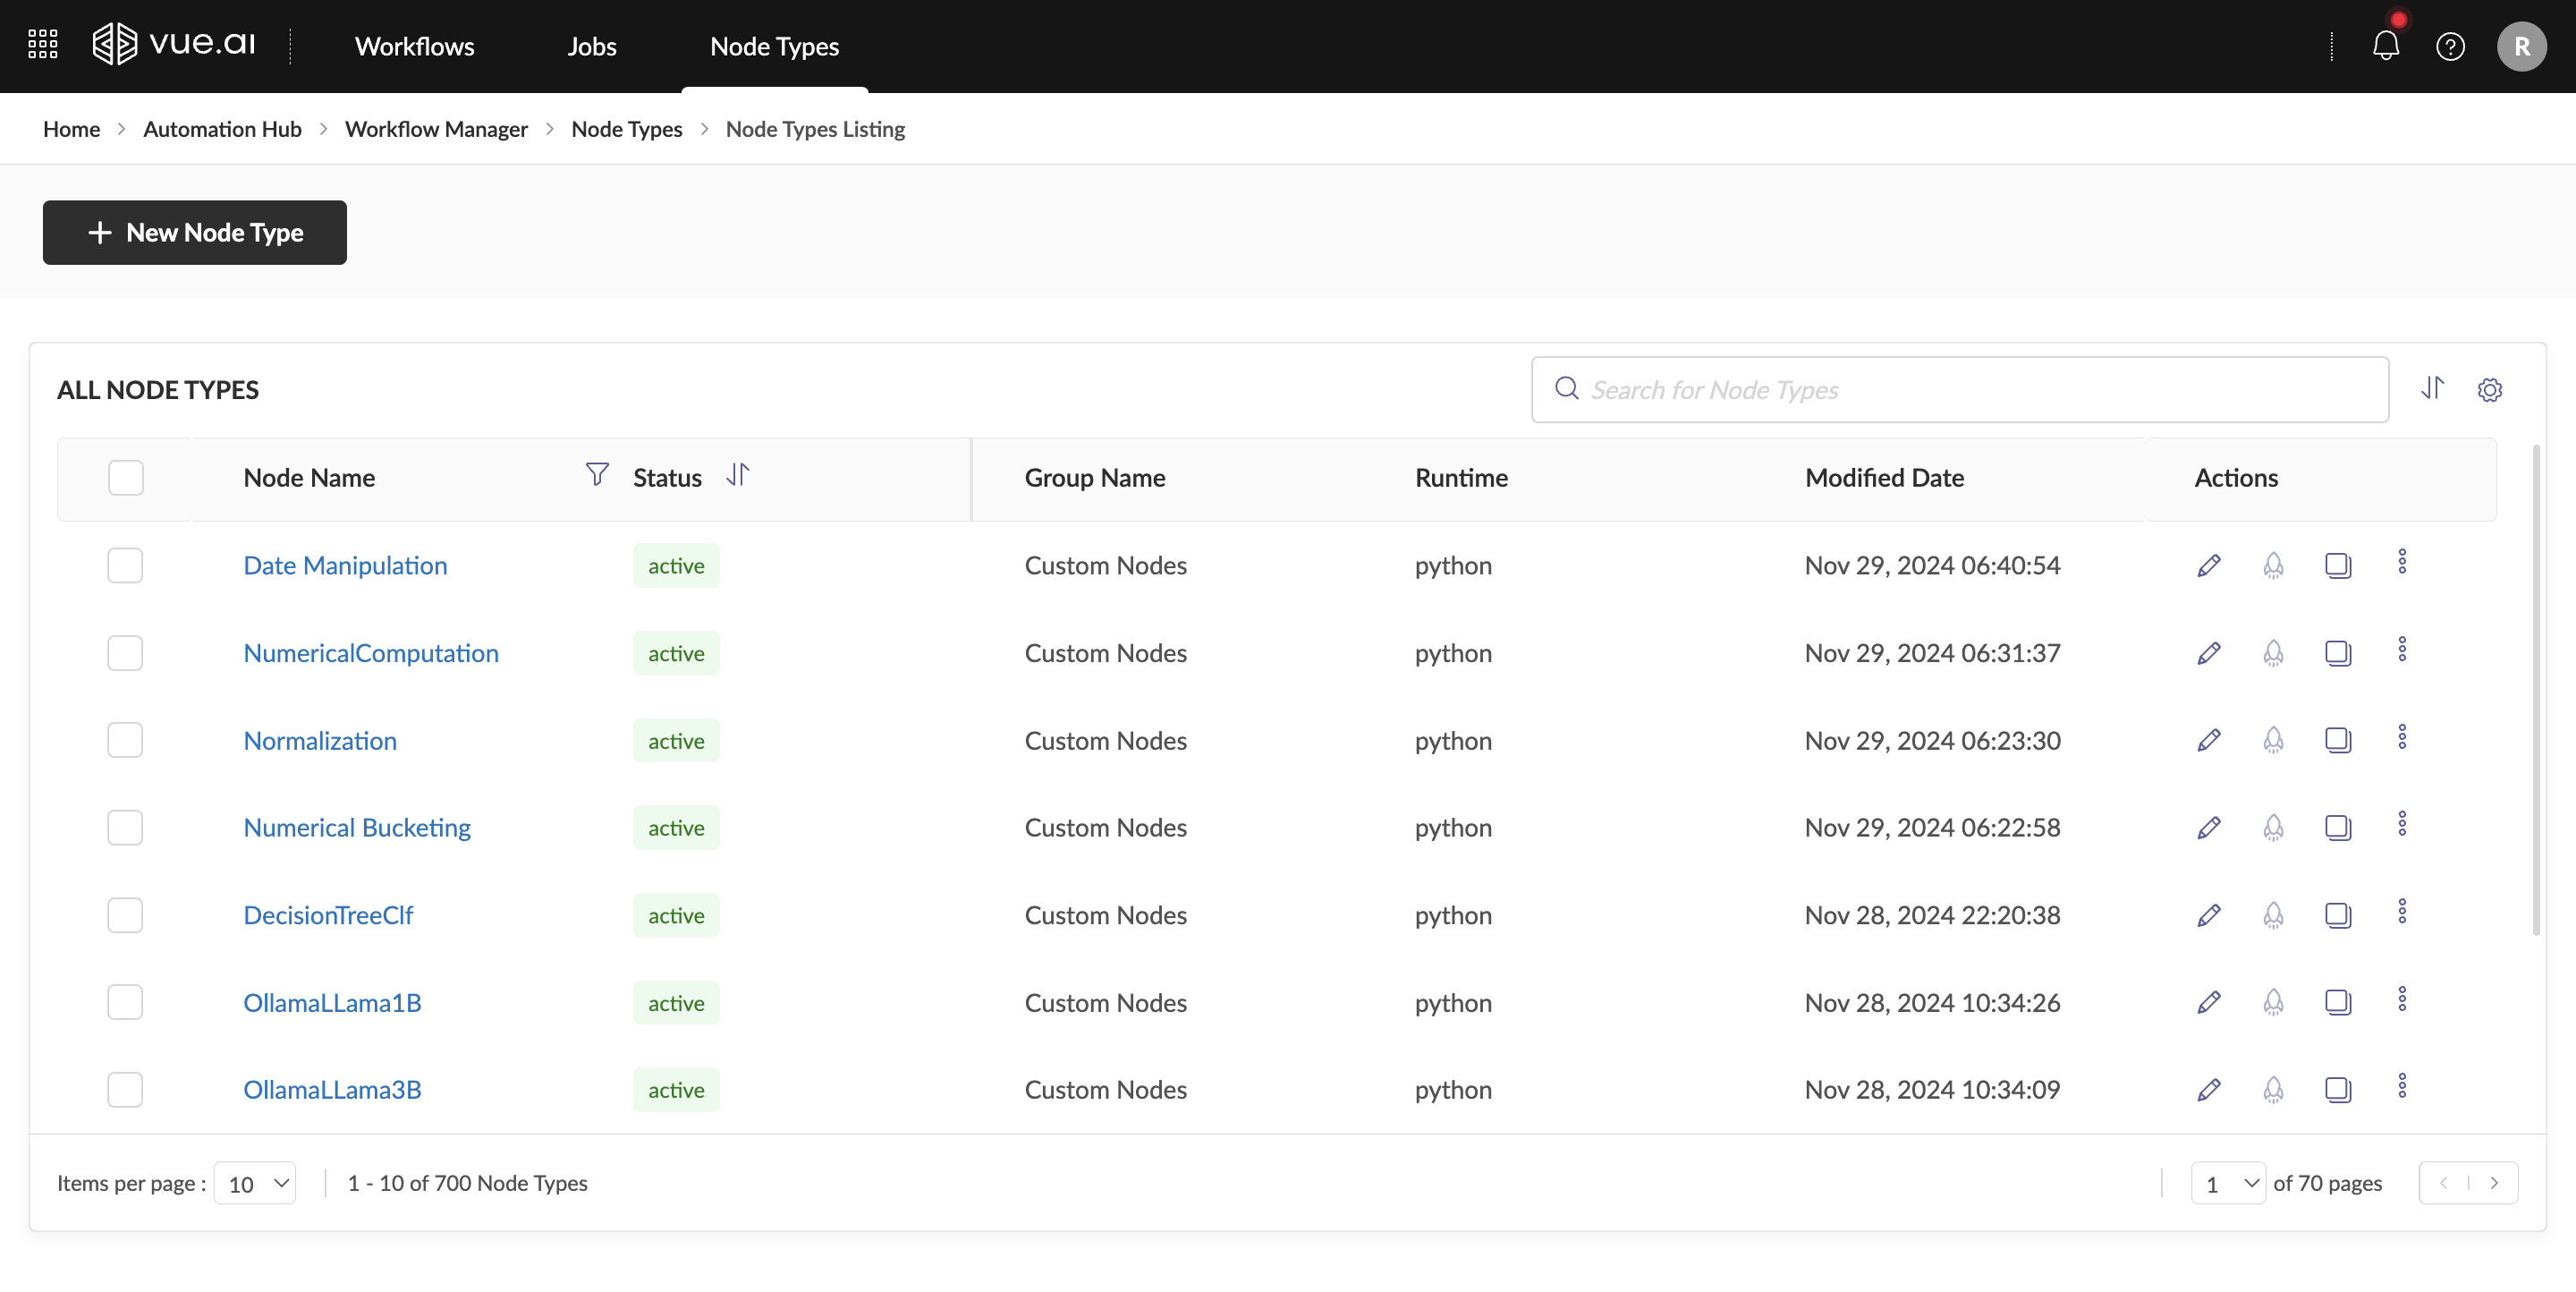
Create a New Spark Node Type
- There are two ways to create a Spark Node Type:
- Click Create New Node Type to start from scratch.
- Enter the node type details.
- Set the Runtime as Spark (Note: The runtime cannot be changed later).
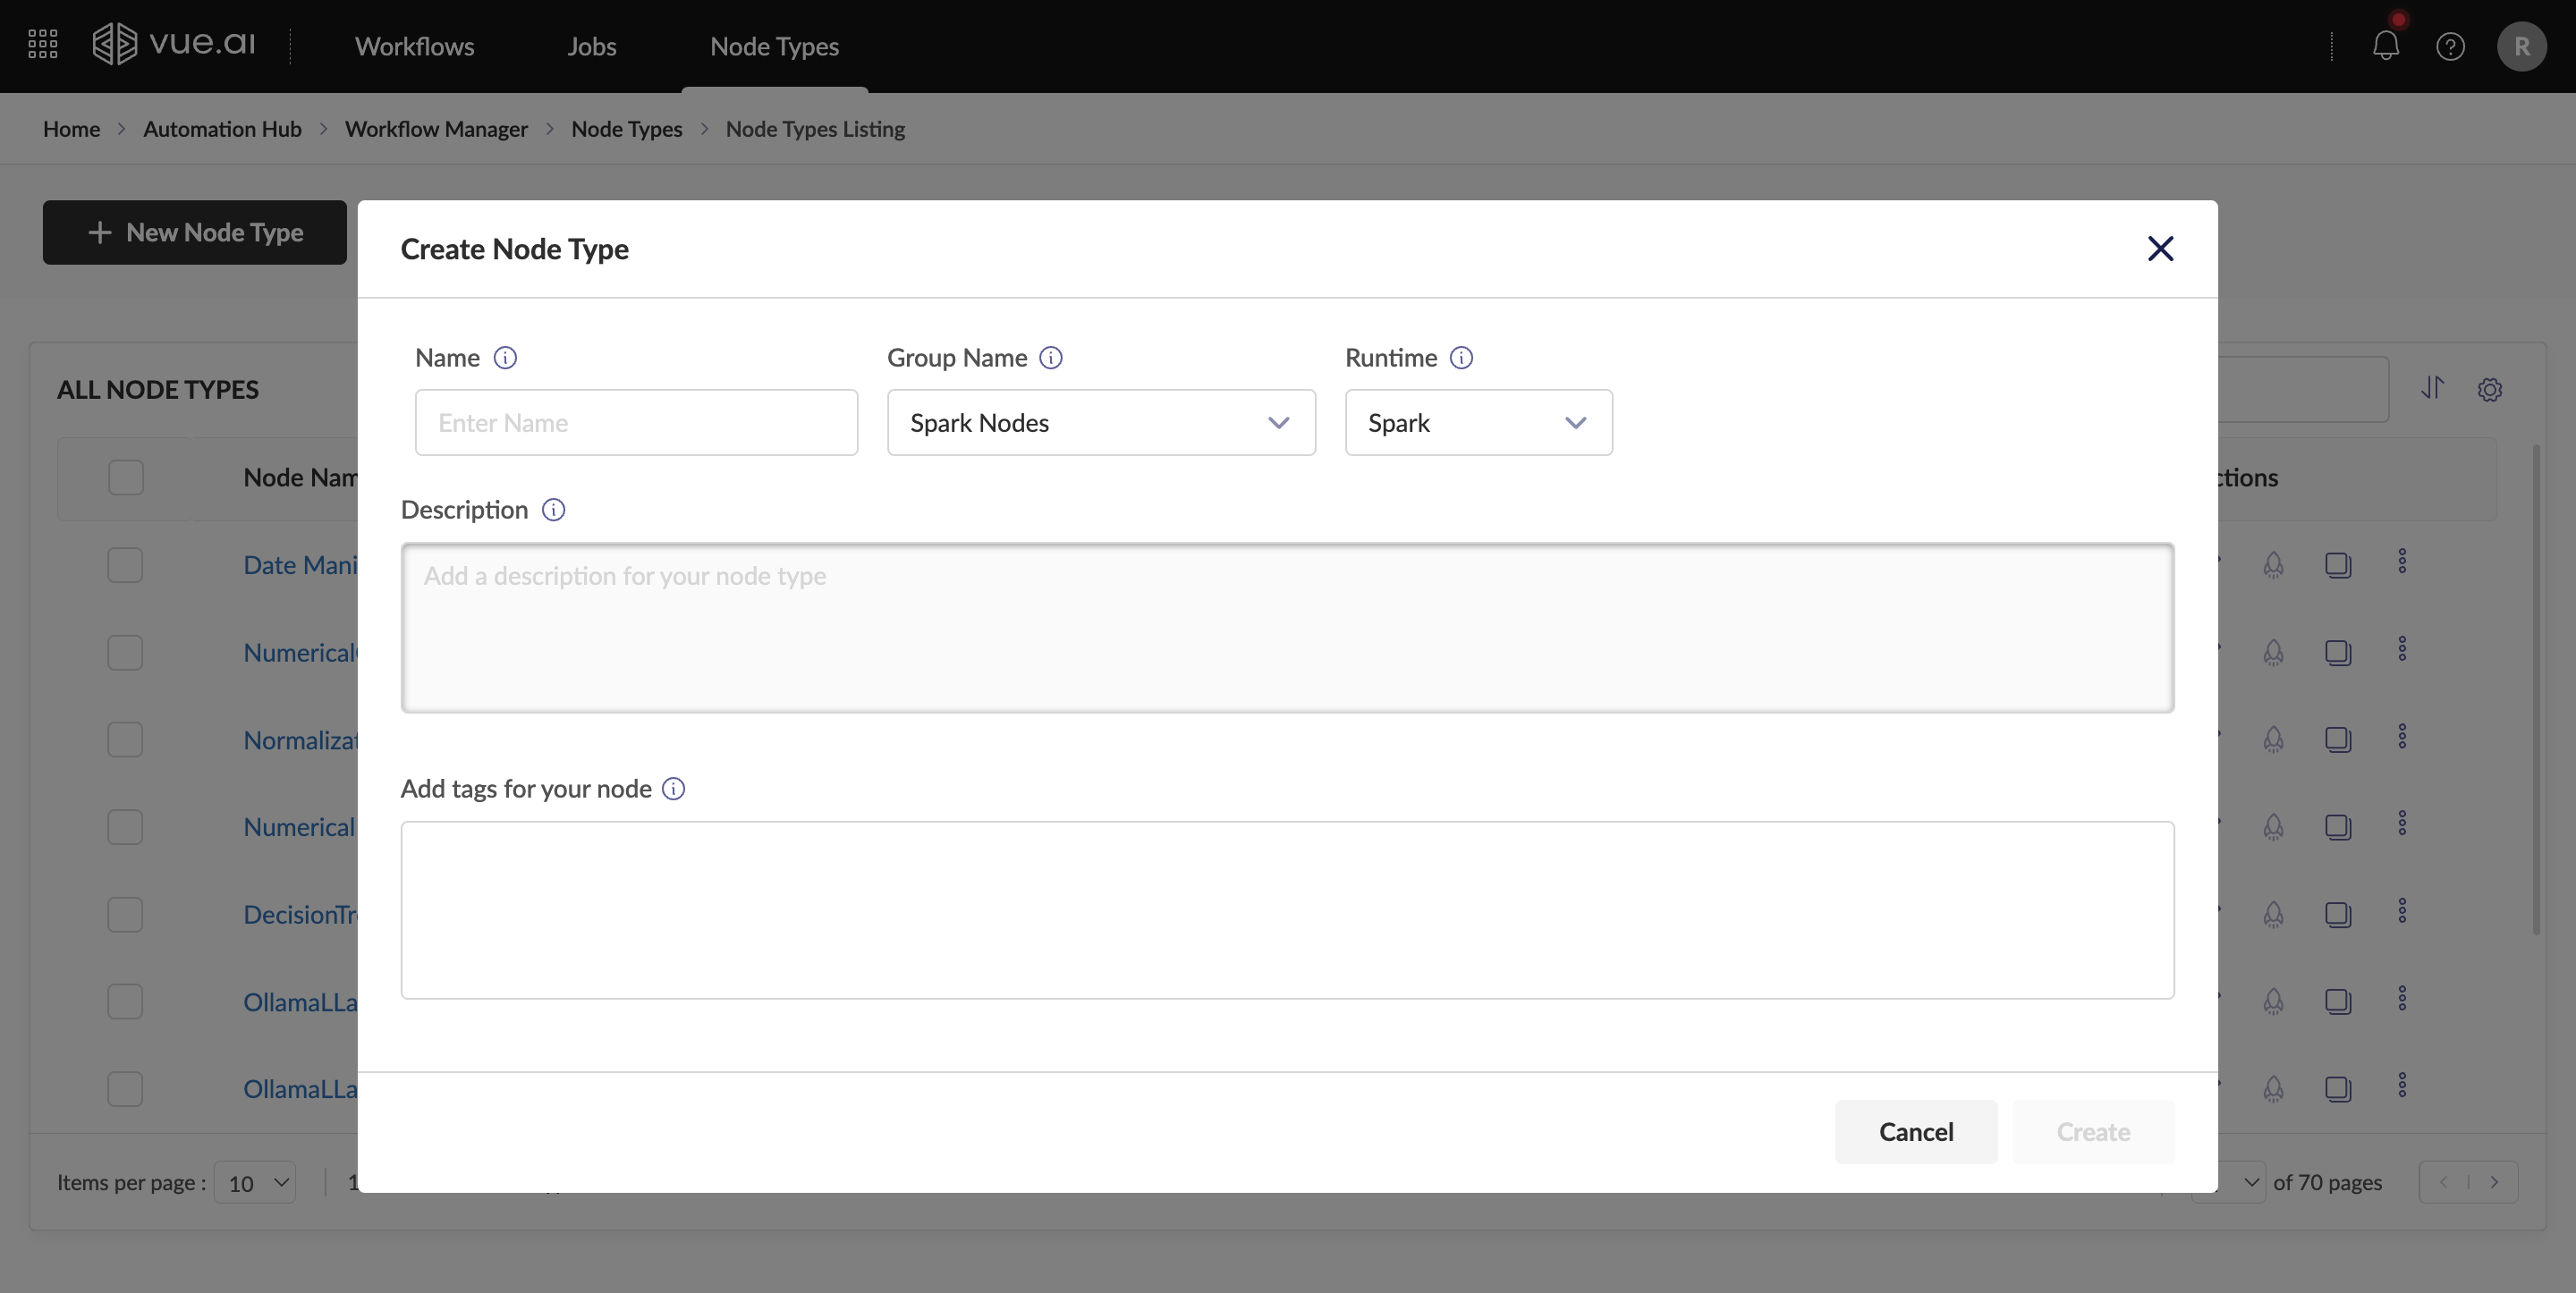
- There are two ways to create a Spark Node Type:
Commit Code to Git
- After creating a Spark Node Type:
- Navigate to Code Server in the left panel.
- Write code in the provided workspace.
- Use GitHub Actions to commit and push the code.
- Once committed, the new node type appears in the Node Types Listing Page.
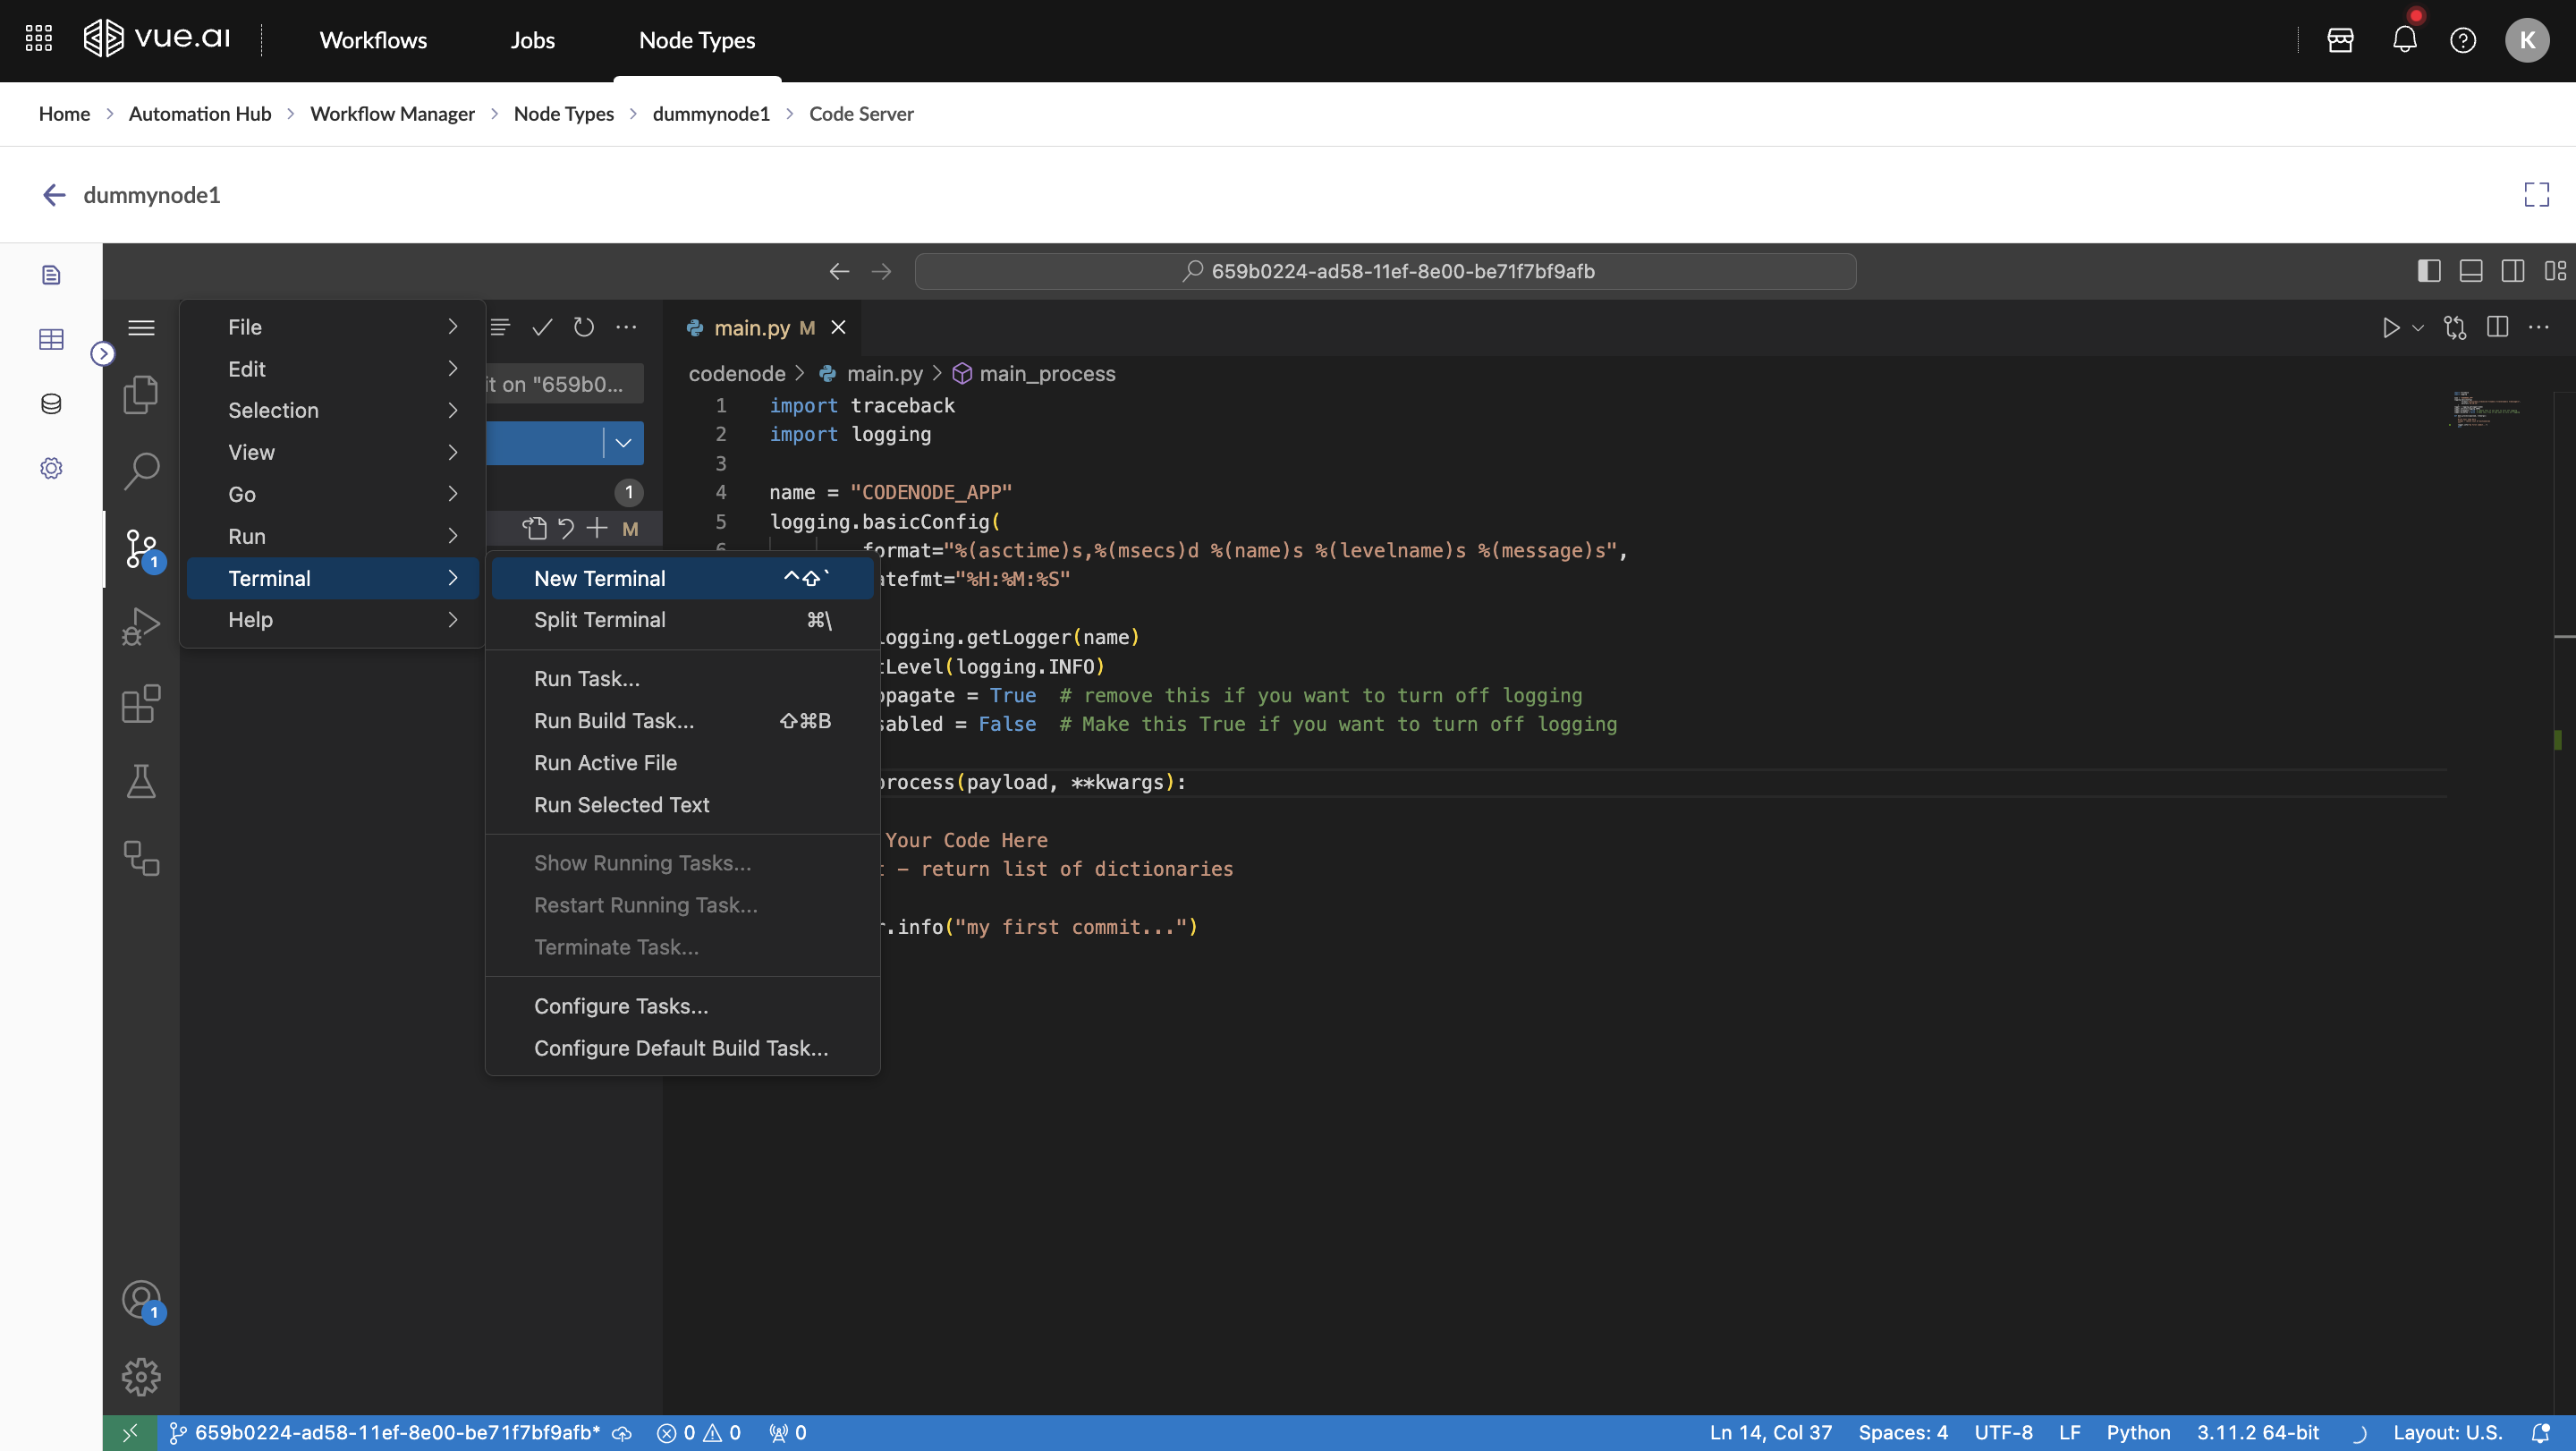
- After creating a Spark Node Type:
Use the Spark Node in a Workflow
Add a Spark Node to a Workflow
Hover over the Nodes section, search for the required node, and drag it onto the Workflow Canvas.
Alternatively, right-click on the Workflow Canvas and search for the node you want to add. This also shows a history of recently used nodes.
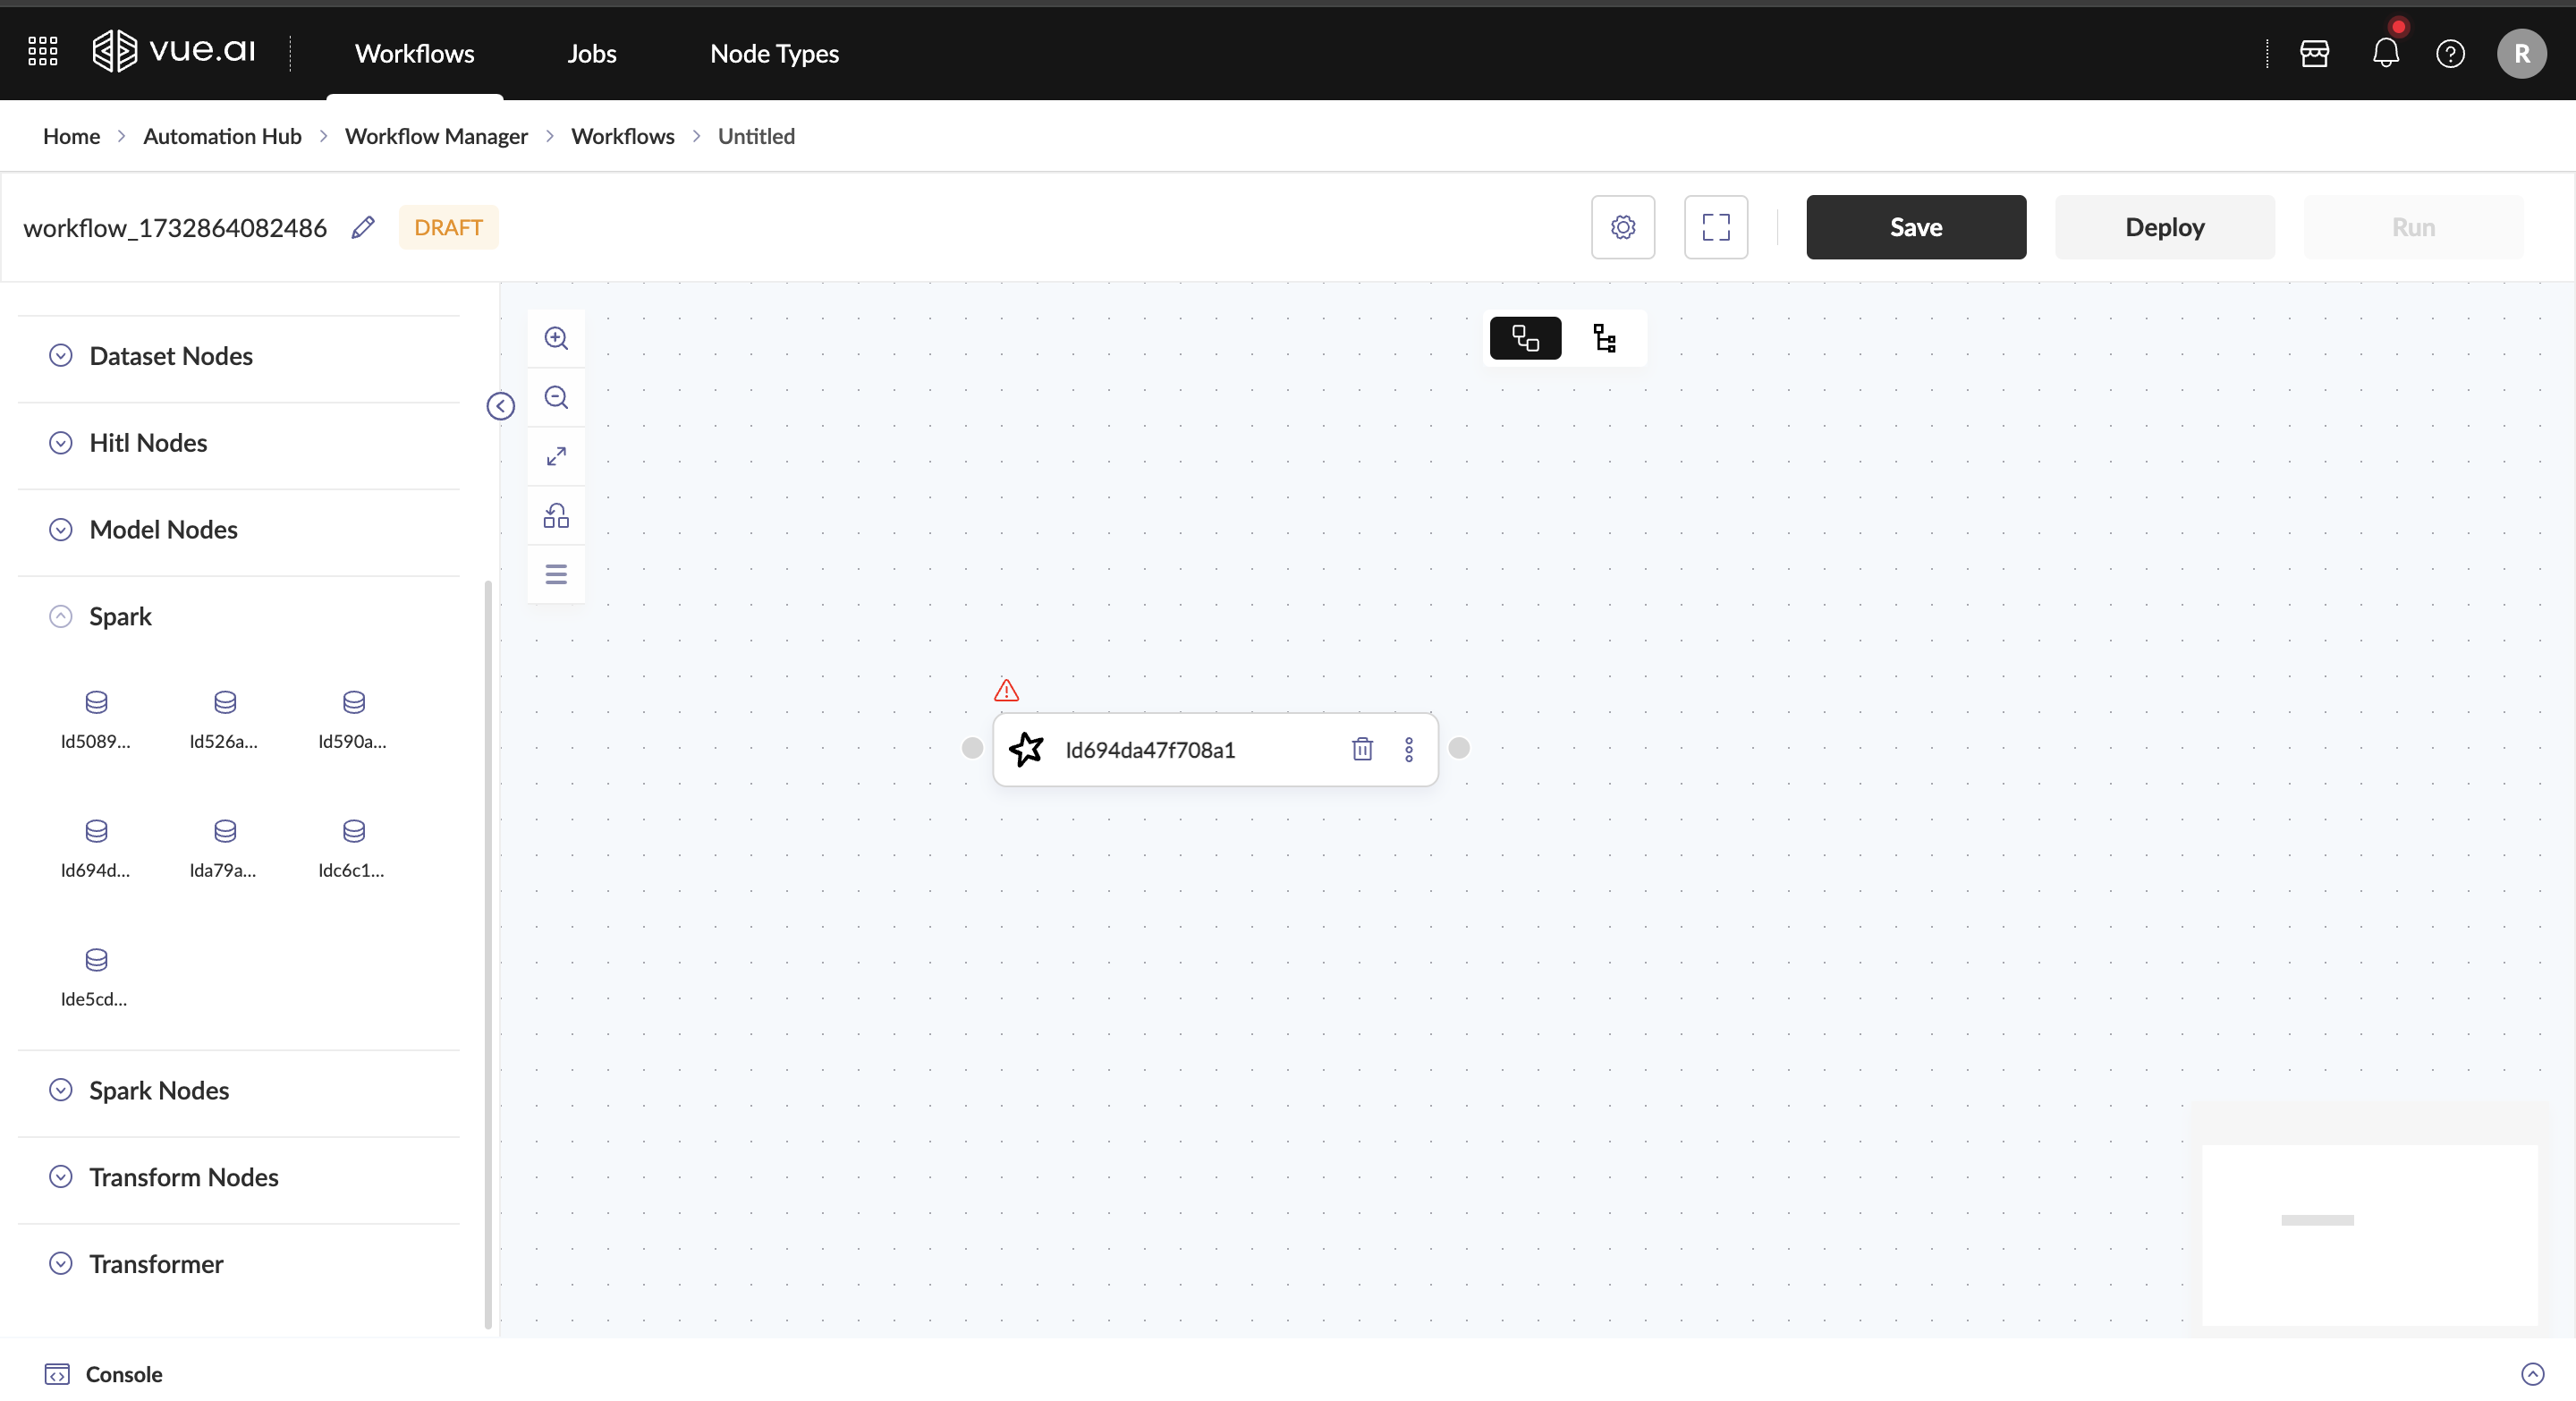
Load a Dataset:
- If you need to load a dataset in the workflow, search for the Dataset Reader Node.
- After selecting the Dataset Reader Node, enter the dataset that needs to be loaded in its configuration.
Link Nodes:
- After adding the required nodes, you can connect them by dragging the end of one node and attaching it to the start of another.
- Once completed, the workflow will display with the newly added Spark node.
Adding Multiple Spark Nodes in a Workflow
- Create new Spark Nodes with required code, following the previous steps.
- Drag and drop the new nodes into the workflow canvas.
- After adding the nodes, connect them by dragging the endpoint of one spark node to the start of another spark node.
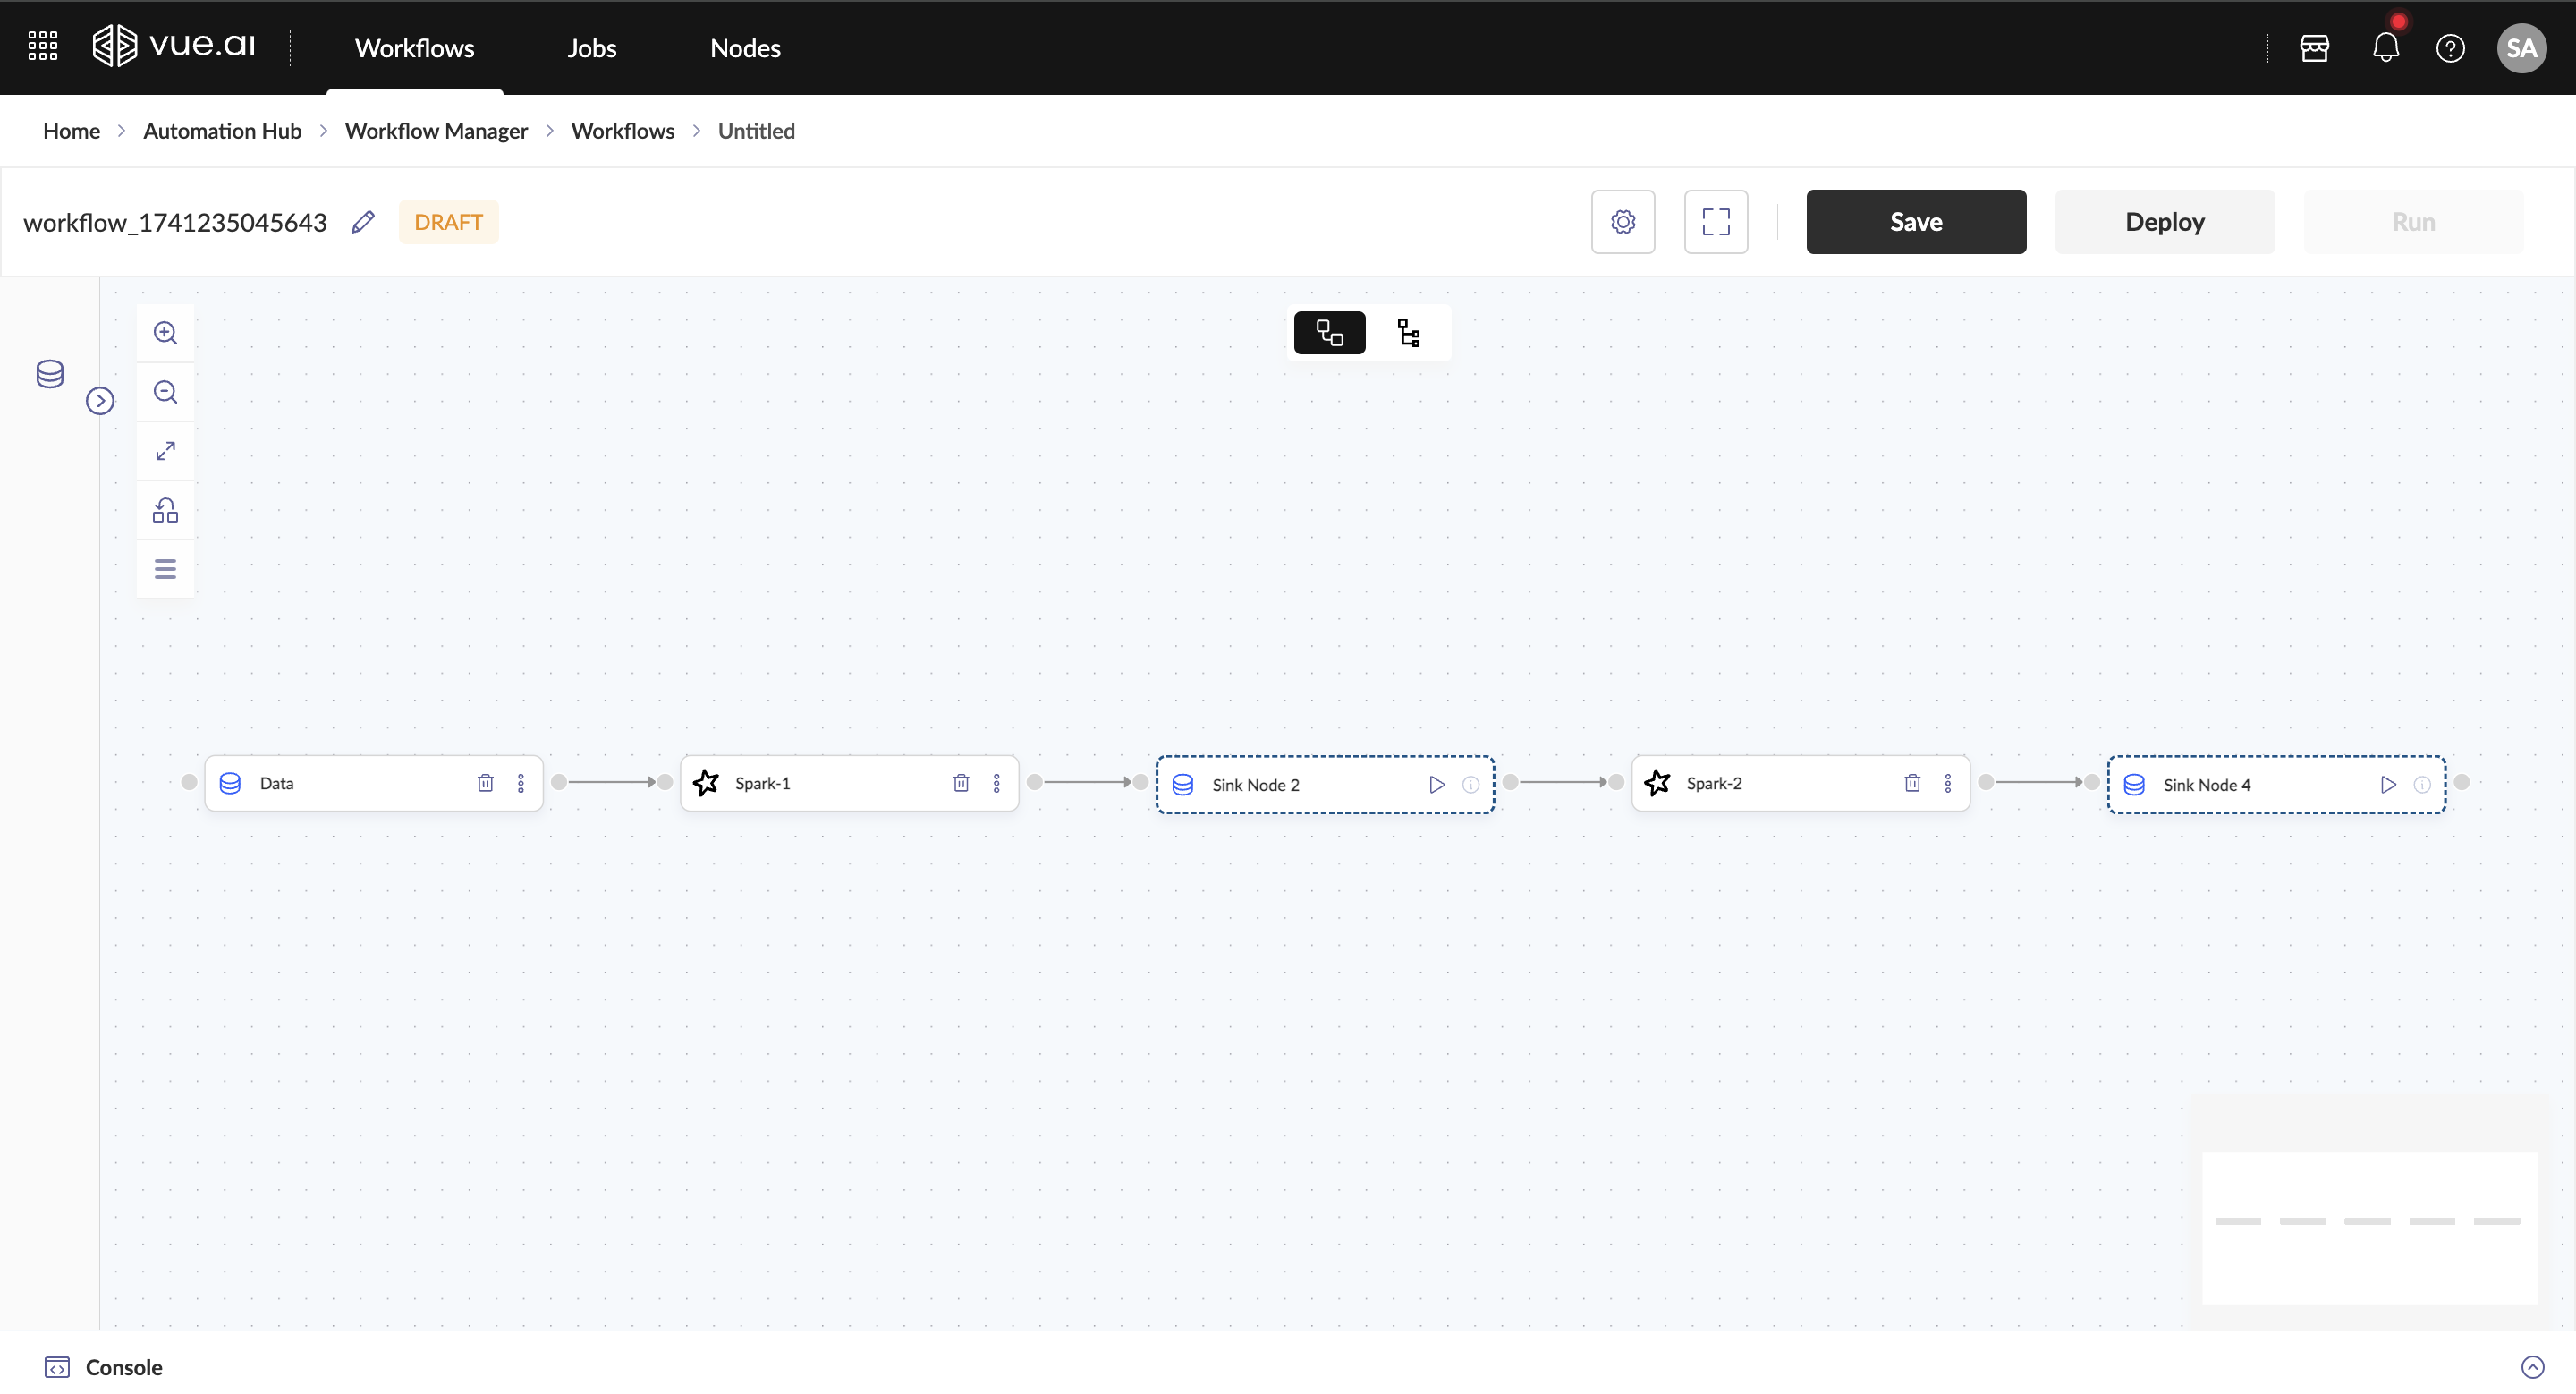
- Passing data between nodes:
- If you need to pass the output from one node to another, return the required output DataFrame (Spark DF) in the predecessor node. The next node can then read this output as its input.
Deploy and Run Workflow
- After creating your workflow, follow these steps to deploy and run it:
- Click Deploy to deploy the workflow. The deployment status will be displayed.
- Once the workflow is deployed, click Run to execute it.
- After selecting Run, navigate to the workflow job page to monitor the execution.
- After creating your workflow, follow these steps to deploy and run it:
Troubleshooting
Common Issues and Solutions
Problem 1: Deployment Failures Cause: Incorrect node configurations or missing dependencies. Solution: 1. Verify node configurations such as runtime settings and memory allocations. 2. Check for missing dependencies in the Spark environment.
Problem 2: Performance Optimization Cause: Inefficient resource configurations. Solution: 1. Adjust resource configurations such as executors, cores, and memory. 2. Enable Dynamic Resource Allocation to optimize scaling.
Problem 3: Execution Issues Cause: Unknown Solution: Debug using the Console tab in the Job Page to view node logs and payload details.
Additional Information
When creating a Spark Node Type, the following settings can be configured:
- Number of Drivers – Sets the number of driver nodes.
- Number of Executors – Defines the executor processes.
- Executor Memory – Allocates memory per executor.
- Executor Cores – Sets cores per executor.
- Driver Memory – Allocates memory for the driver.
- Dynamic Resource Allocation – Enables auto-scaling of executors.
- The workflow's control flow follows the sequence in which nodes are added to the canvas.
- Keep node names concise and clear for better readability on the canvas, ensuring smoother workflow deployment.
- Spark Nodes currently support only a single large dataset as input.
- Spark Nodes return only a dataset, as they are primarily designed for large-scale ETL (Extract, Transform, Load) processes.
FAQ
What are the key configurations for a Spark Node?
Important Spark node configurations include:
- Number of Drivers: Controls the number of driver nodes
- Number of Executors: Sets the number of executor processes
- Executor Memory: Defines memory allocation per executor
- Executor Cores: Specifies cores per executor
- Driver Memory: Controls memory allocation for the driver
- Dynamic Resource Allocation: Enables automatic scaling of executors
How do I optimize Spark Node performance?
To optimize your Spark node:
- Configure appropriate memory settings based on data size
- Set the right number of executors and cores
- Enable dynamic resource allocation for variable workloads
- Monitor executor usage and adjust accordingly
- Use caching strategically for frequently accessed data
- Partition data effectively for parallel processing
How do I troubleshoot Spark Node issues?
Common troubleshooting steps include:
- Check the Console tab for error messages and stack traces
- Verify resource configurations (memory, cores)
- Monitor executor logs for performance bottlenecks
- Ensure proper data partitioning
- Review job progress in the Spark UI
- Check for data skew or memory pressure issues
Summary
- The guide covered the following:
- Navigating to the Node Types Listing Page
- Creating a new Spark Node Type
- Using the created Spark Node in workflows
- Deploying and running a Spark workflow
Nodes
The Automation Hub provides an extensive library of nodes for building comprehensive workflows. Nodes are organized into functional categories for easy discovery and use.
Preset Nodes
Datasets & Connectors Nodes
These nodes provide data ingestion and dataset management capabilities for workflow integration.
CSV Dataset Reader
Welcome to the CSV Dataset Reader guide! This guide will assist users in understanding the features and benefits of the CSV Dataset Reader node and learning how to set up and use the node effectively.
Who is this guide for? This guide is designed for users who are working with custom CSV Dataset Readers in a workflow.
Ensure access to a registered dataset and a basic understanding of Pandas for working with DataFrames before starting.
Overview
The CSV Dataset Reader node serves as a bridge between registered datasets and custom CSV Dataset Readers. It ensures that data is correctly formatted, enabling smooth workflow execution and simplifying complex data processing tasks. The node:
- Takes the name of a registered dataset as input.
- Converts the dataset into a Pandas DataFrame.
- Outputs the DataFrame for use in subsequent custom code nodes.
Prerequisites Before beginning, the following are required:
- A registered dataset for processing.
- A custom CSV Dataset Reader in the workflow that requires a Pandas DataFrame as input.
- Basic knowledge of Pandas for working with DataFrames.
Step-by-Step Instructions
Adding a CSV Dataset Reader to the Workflow
Two methods can be followed to add a CSV Dataset Reader:
Drag and Drop Method
- The node is selected from the left pane.
- It is then dragged onto the workflow canvas.
Right-Click Method
- The canvas is right-clicked.
- The node is selected from the context menu.
- It is then placed on the canvas.

Configuring the CSV Dataset Reader
Once the node is added, it can be configured with the following parameters:
Name
- A unique name is entered (must be under 18 characters).
Description
- Optionally, a description is provided for clarity.
Dataset
- The dataset to be processed by the node is selected.

The node name must be less than 18 characters to avoid configuration issues. Providing meaningful descriptions improves clarity.
Troubleshooting
Common Issues and Solutions
Problem 1: The dataset is not recognized Cause: The dataset may not be correctly registered in the system. Solution: Ensure that the dataset is correctly registered in the system.
Problem 2: The DataFrame is empty Cause: The dataset may not contain data before passing it to the node. Solution: Check if the dataset contains data before passing it to the node.
Additional Information
The CSV Dataset Reader node aids in structuring data for workflows involving machine learning, data preprocessing, and analysis. It eliminates the need for manual data conversion, making workflows more efficient.
FAQ
Can multiple datasets be used in a single CSV Dataset Reader node?
No, each CSV Dataset Reader node processes only one dataset at a time. Multiple nodes can be used if multiple datasets need to be handled.
What if the dataset is too large?
Consider using data sampling to test the workflow in speed run and deploy run the workflows to handle large datasets.
Summary
The CSV Dataset Reader node streamlines data formatting for workflows by converting registered datasets into Pandas DataFrames. It ensures compatibility with custom CSV Dataset Readers, enabling efficient data processing and analysis. By following the provided guidelines, users can seamlessly integrate this node into their workflows for various use cases, including machine learning and data transformations.
Data Ingress Gateway
Welcome to the Data Ingress Gateway Node guide! This guide will help users understand the purpose and capabilities of the Data Ingress Gateway Node and learn how to set up and use the node effectively for seamless data ingestion.
Who is this guide for? This guide is intended for users integrating a Data Ingress Gateway Node within a workflow to automate external data ingestion for analysis.
Overview
The Data Ingress Gateway Node facilitates seamless data ingestion by acting as a bridge between external data sources and processing pipelines. The node:
- Connects to external data sources using a configurable connector.
- Ingests and preprocesses incoming data for further analysis.
- Ensures data consistency and formatting for downstream processing.
- Optionally logs data ingestion details for monitoring and troubleshooting.
Prerequisites
Before using the Data Ingress Gateway Node, ensure the following:
- Access to an external data source with appropriate permissions.
- A properly configured connector for seamless data ingestion. Refer to Connection Manager for creating a connector.
Step-by-Step Instructions
Adding a Data Ingress Gateway to the Workflow
Two methods can be followed to add a Data Ingress Gateway:
Drag and Drop Method
- The node is selected from the left pane under Datasets & connectors section.
- It is then dragged onto the workflow canvas.
Right-Click Method
- The canvas is right-clicked.
- The node is selected from the context menu.
- It is then placed on the canvas.
Configuring the Data Ingress Gateway
Once the node is added, it can be configured with the following parameters:
Name
- A unique name is entered (must be under 18 characters).
Description
- Optionally, a description is provided for clarity.
Connection Name
- The required Connection Name must be selected from the provided list before execution
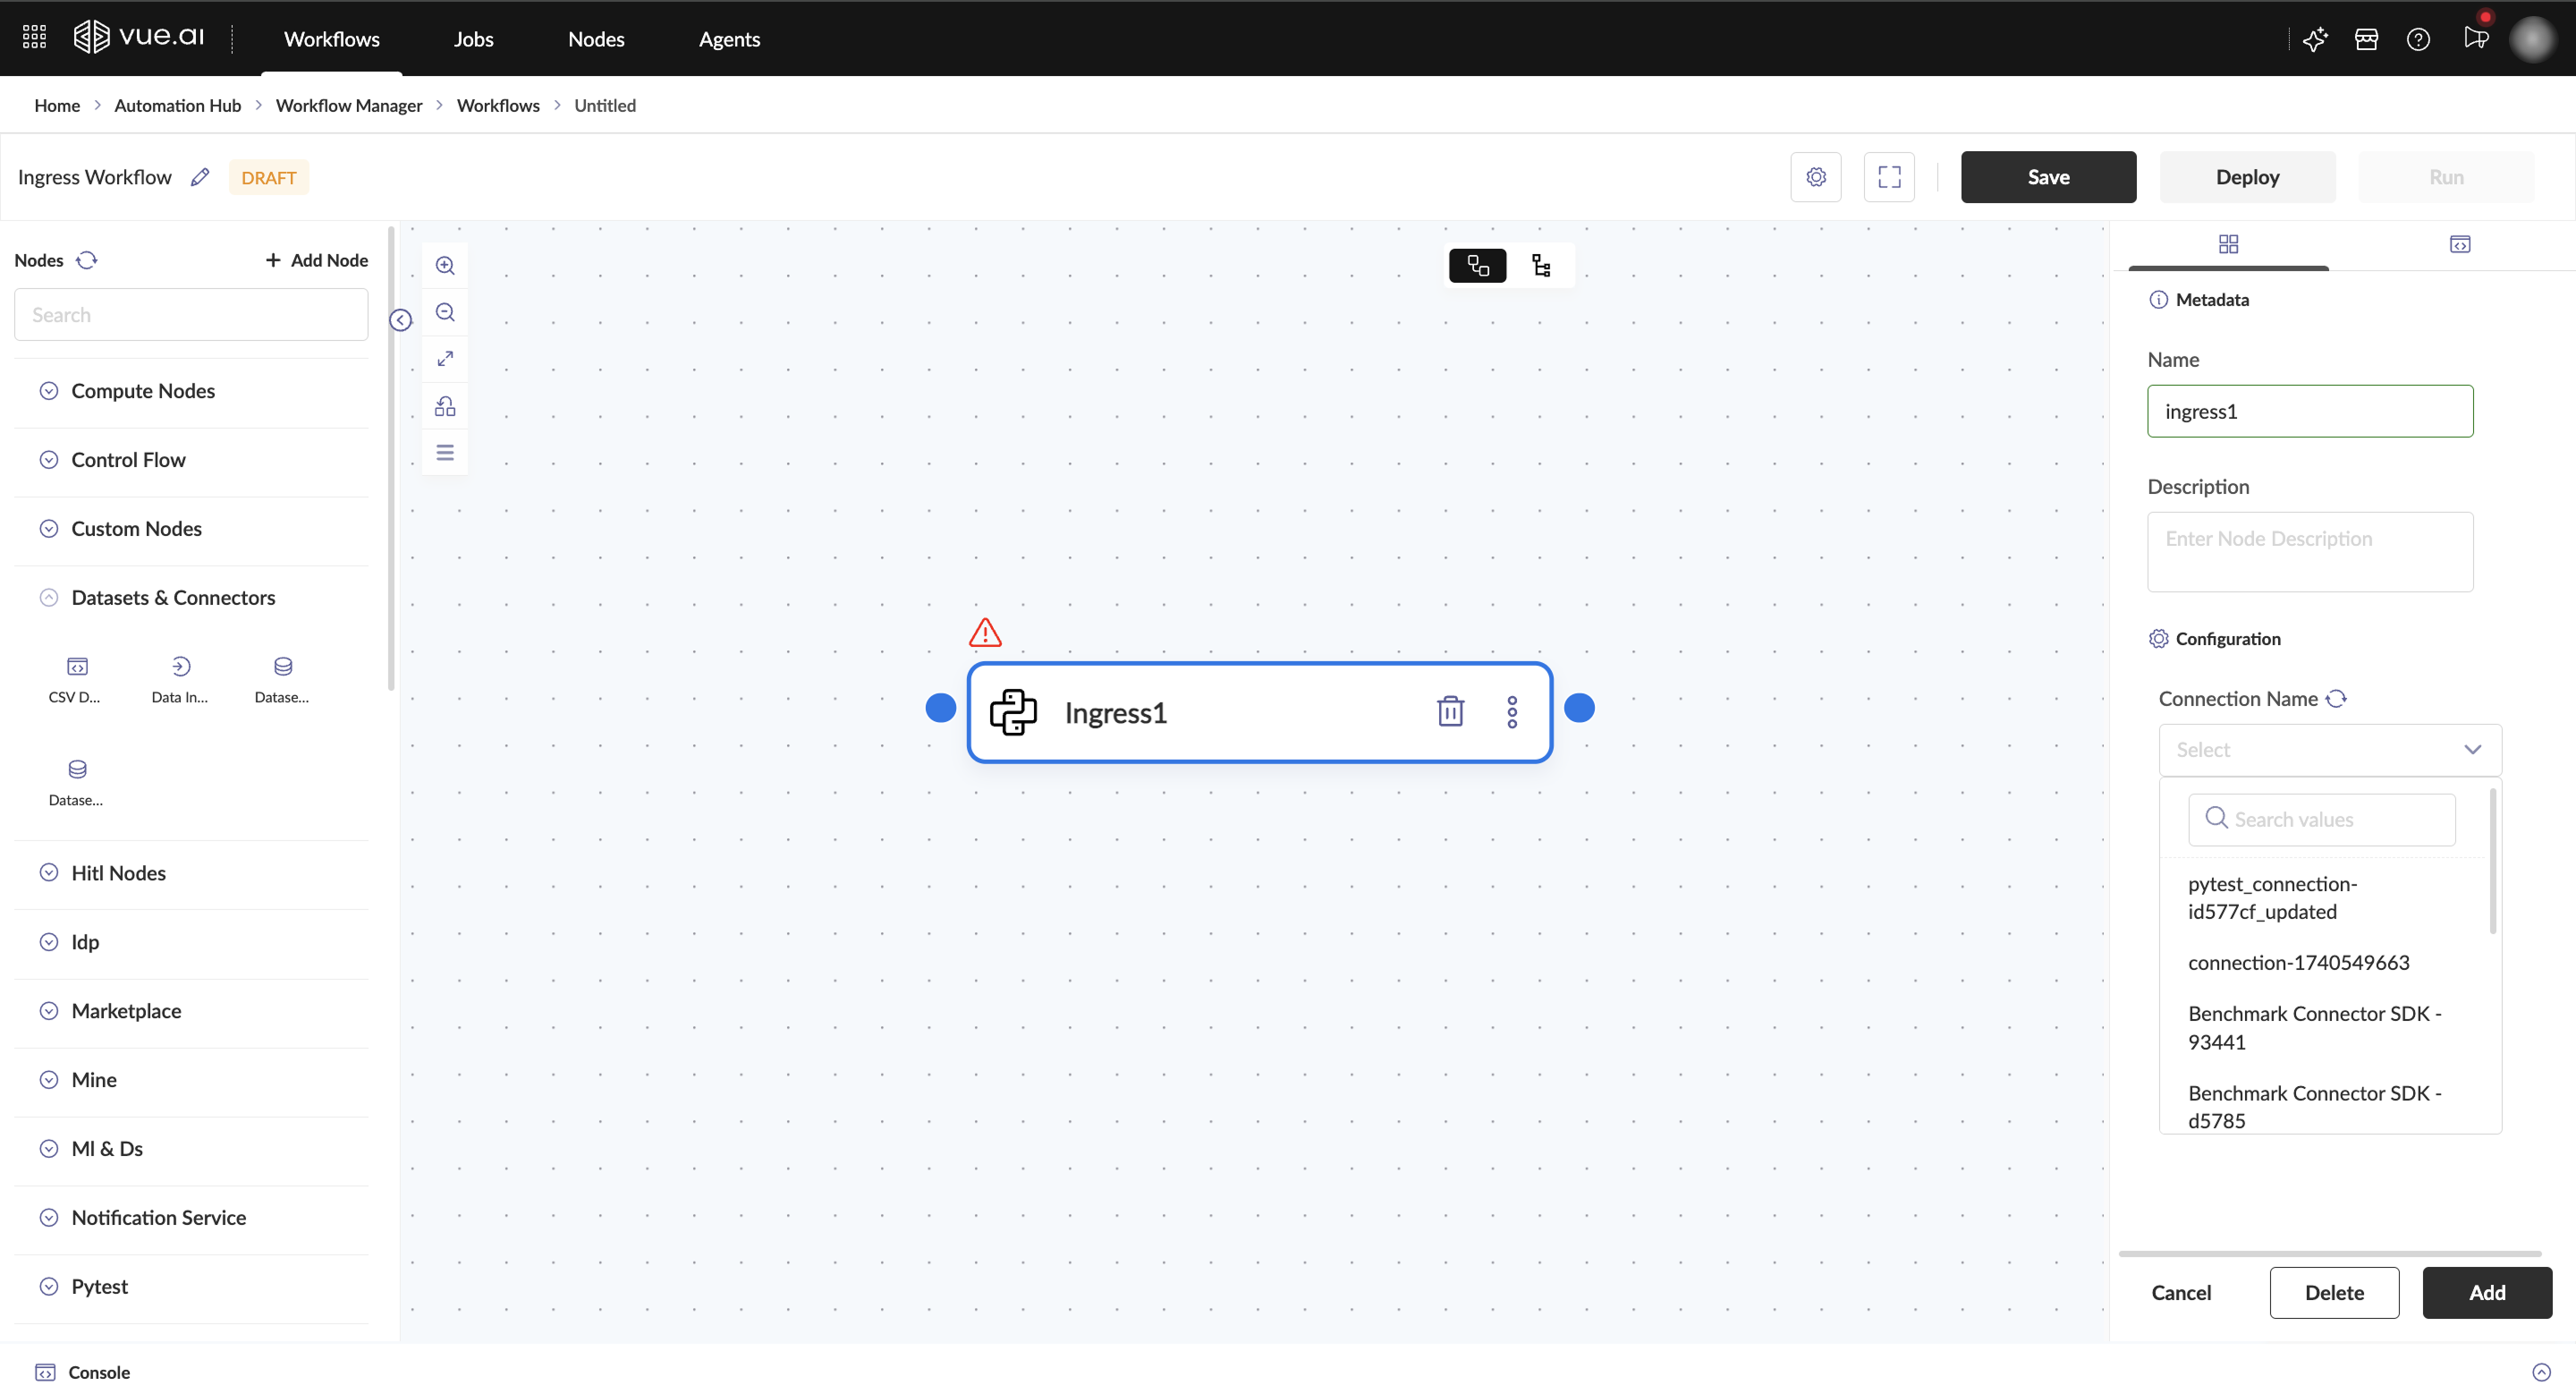
Output of the Node:
Upon successful execution, the node's output will include the Connection Run Summary, detailing the time taken and relevant run metrics.
Troubleshooting
Common Issues and Solutions
Problem 1: The connection is not recognized Cause: The connection may not be configured correctly as expected. Solution: Ensure that the source, destination, and connection are properly configured. Use the "Test Connection" option in the Connection Canvas to verify the setup.
Additional Information
The Data Ingress Gateway Node can be followed by a CSV Dataset Reader to load the data ingested by the Data Ingress Gateway Node.
FAQ
Are we allowed to modify the connection details using the Data Ingress Gateway Node?
No, the Data Ingress Gateway Node only allows selection of the connection to be used. Any modifications must be made in the Connection Manager.
Is the ingested data considered the output of the Ingress Node?
No, the Ingress Node serves as a conduit for data ingestion and does not generate an output in itself. Instead, the ingested data is forwarded to the dataset selected while setting up the connection in the Connection Manager.
Summary
The Data Ingress Gateway Node ingests external data through a connector, enabling seamless integration and preprocessing for analysis.
Control Flow Nodes
Control Flow nodes enable conditional logic, branching, and human-in-the-loop processes for complex workflow scenarios.
HITL Form
Welcome to the HITL Form guide! This guide will assist users in passing in varying types of inputs to workflows based on user choice.
Expected Outcome: By the end of this guide, an understanding of the HITL Form and its applications in the Vue.ai platform will be gained.
Overview
The HITL (Human-in-the-Loop) Node enables human validation and intervention within automated workflows. It allows users to review, modify, or approve data at critical decision points, ensuring higher accuracy and compliance with business requirements. This node is particularly useful in scenarios where automated processing alone may not be sufficient, such as handling ambiguous data, verifying critical outputs, or incorporating domain expertise. By integrating human oversight, the HITL Form enhances the reliability and trustworthiness of the workflow.
Prerequisites For a better understanding of Code Nodes and Workflows, it is recommended to review the Getting Started with Workflows documentation.
Navigation To begin, head to a Workflow Canvas to make use of the HITL Form: Home/Landing Page → Automation Hub → Workflow Manager → Workflows → New Workflow
Step-by-Step Instructions
Adding and Configuring the HITL Form
To integrate a HITL Form into the workflow, the following steps should be followed:
- Add a HITL Form
- The HITL Form should be added to the workflow canvas.
- The HITL Form configurations can be opened by clicking on the HITL Form.
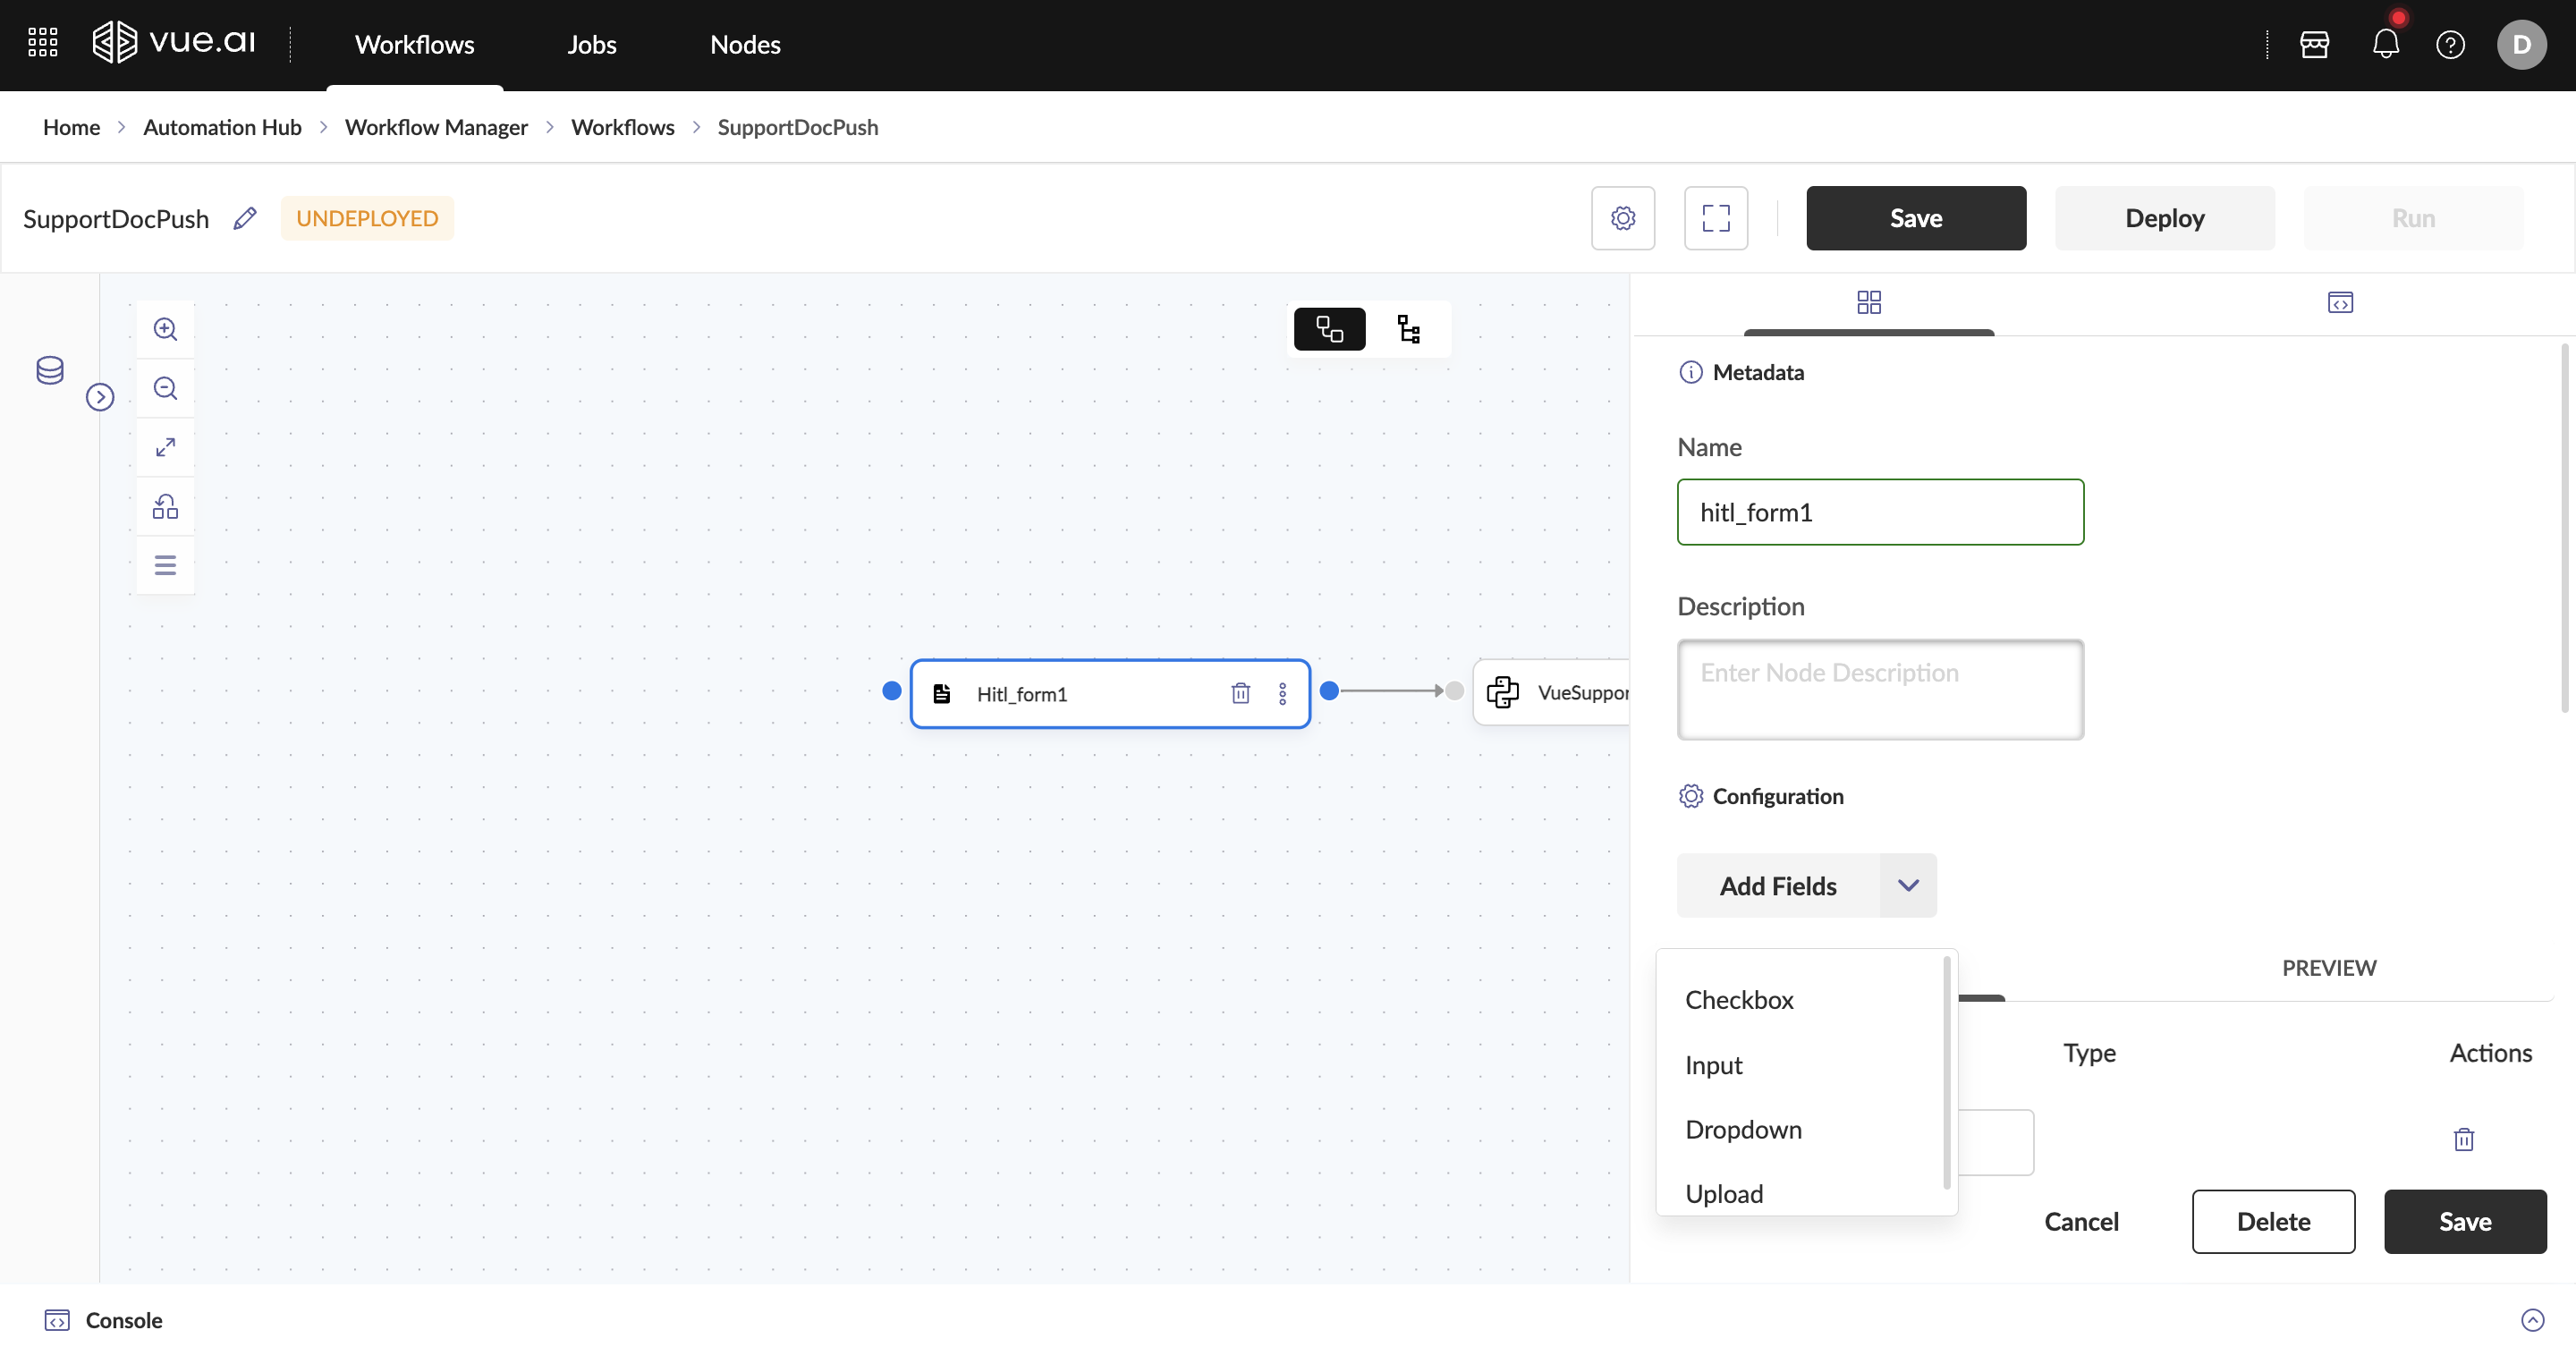
- Configure the HITL Form
- Using the Form Builder
- Various input types can be added under the Add Fields section.
- Using the Form Builder
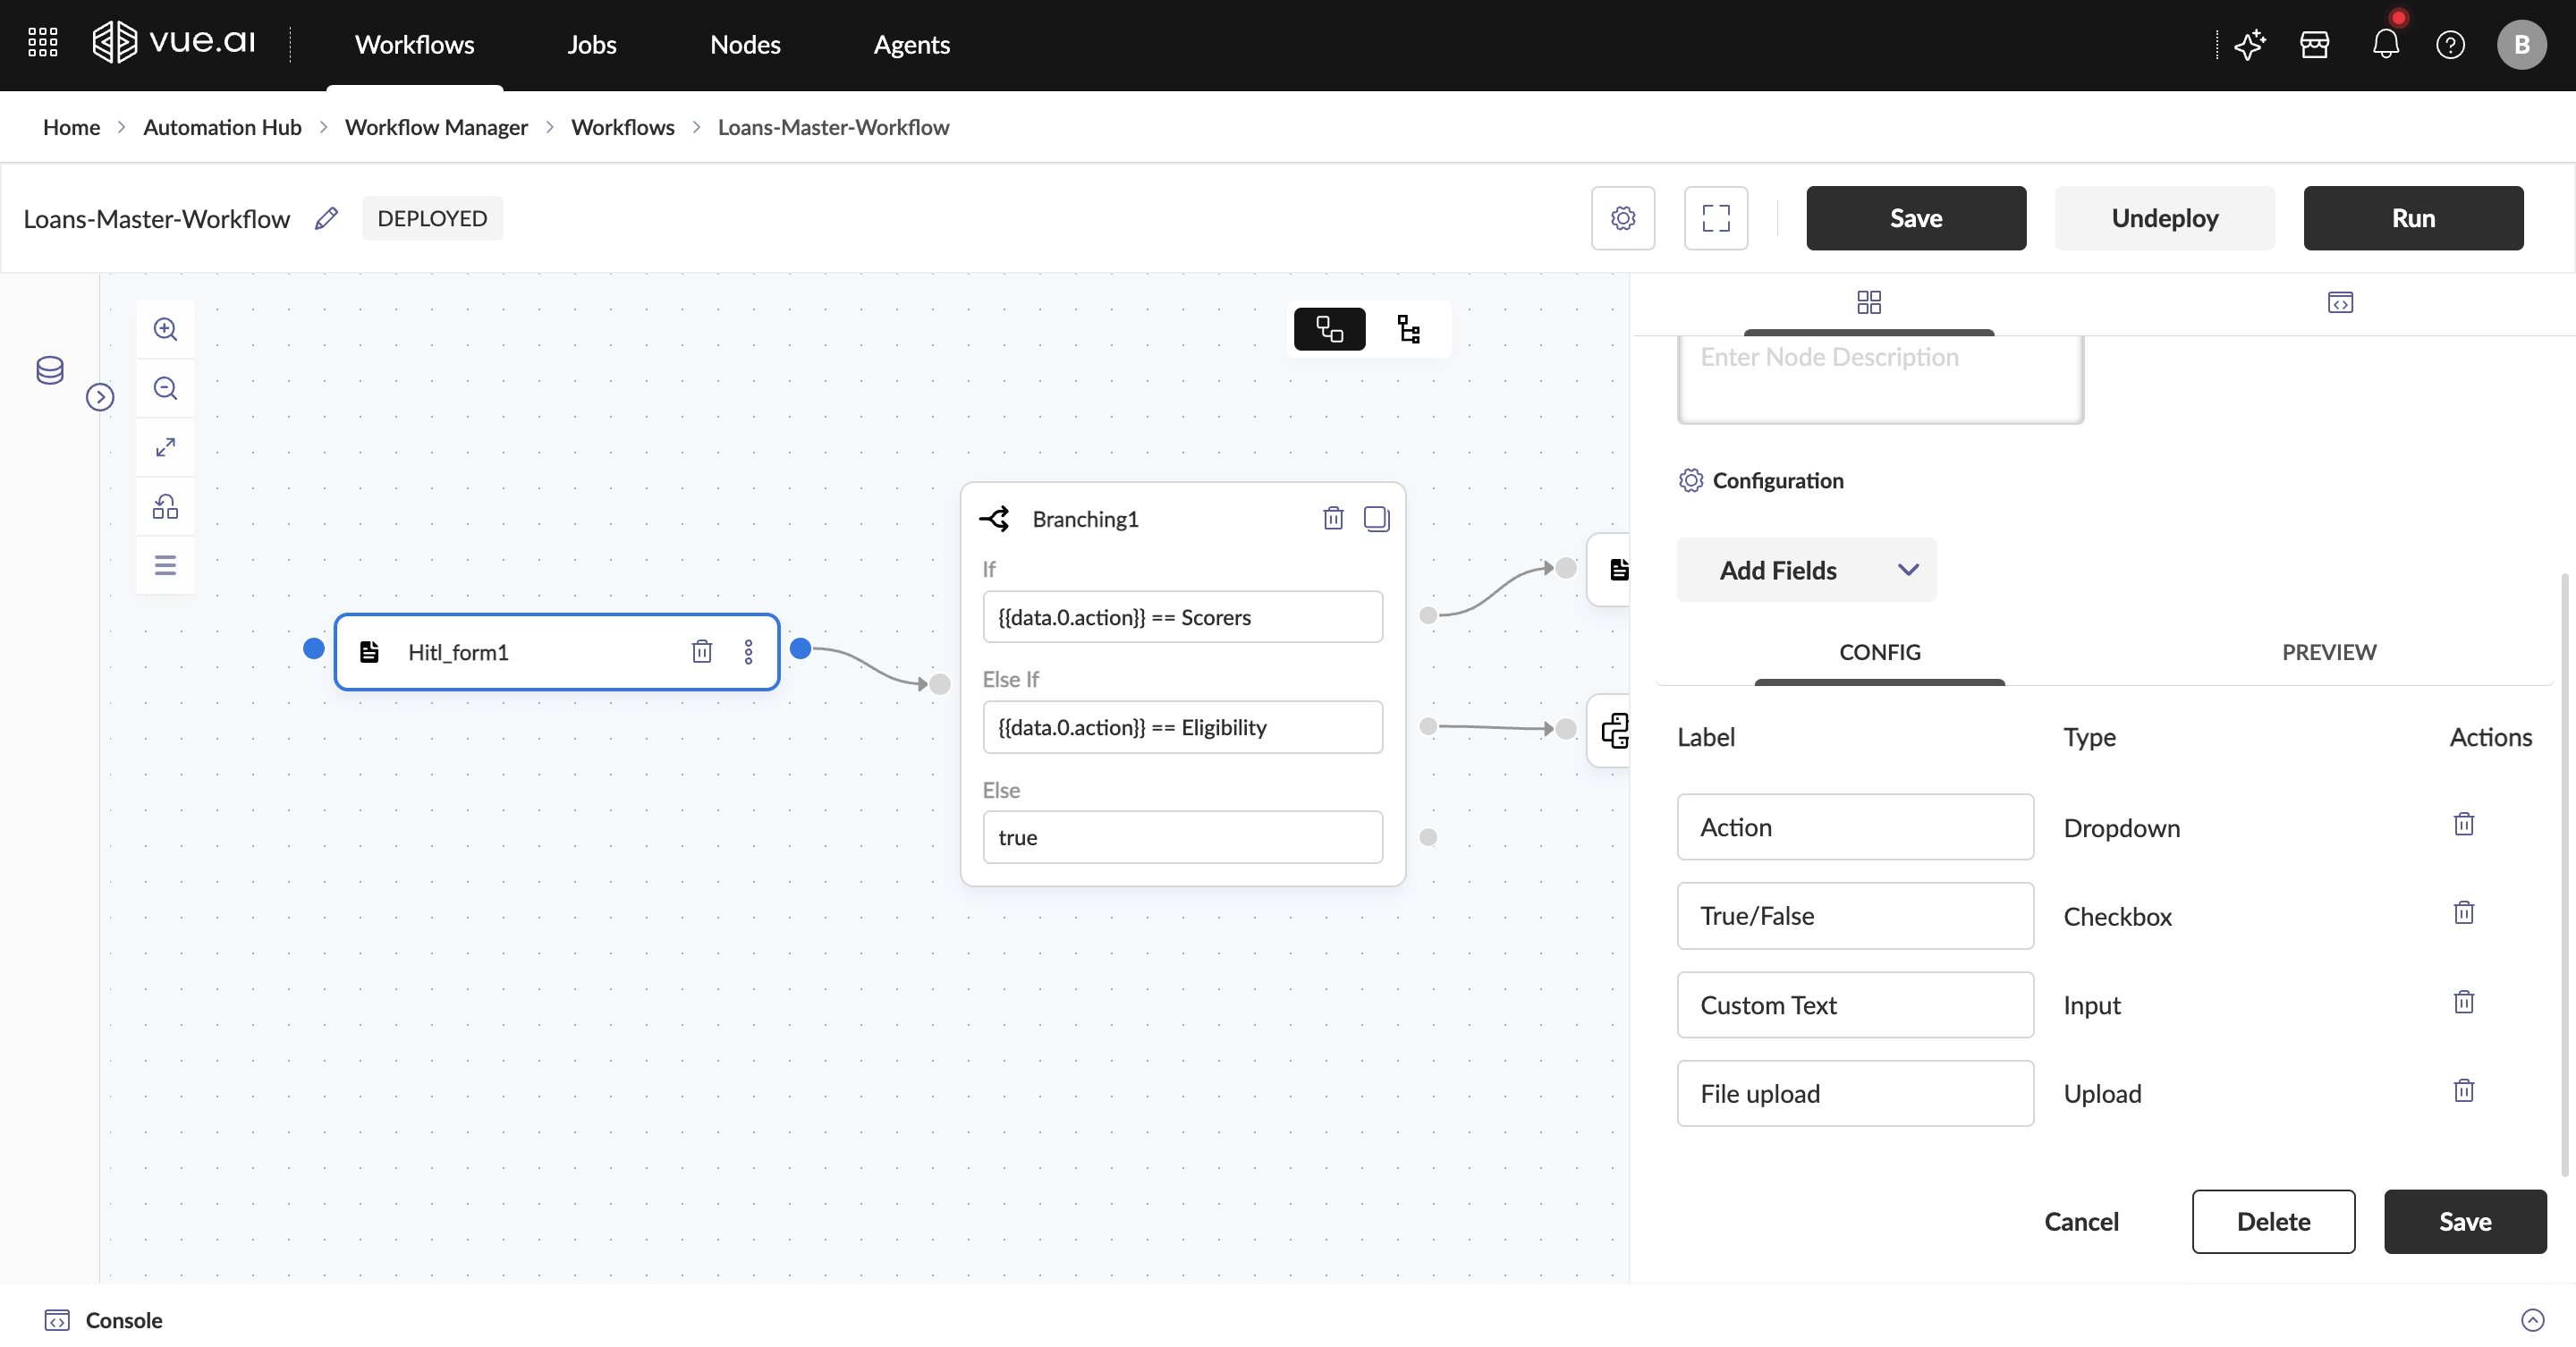
- Once fields are added: - Entries of each field along with Labels & Type will appear. - Unnecessary fields can be deleted if not required. - The HITL form can be previewed.
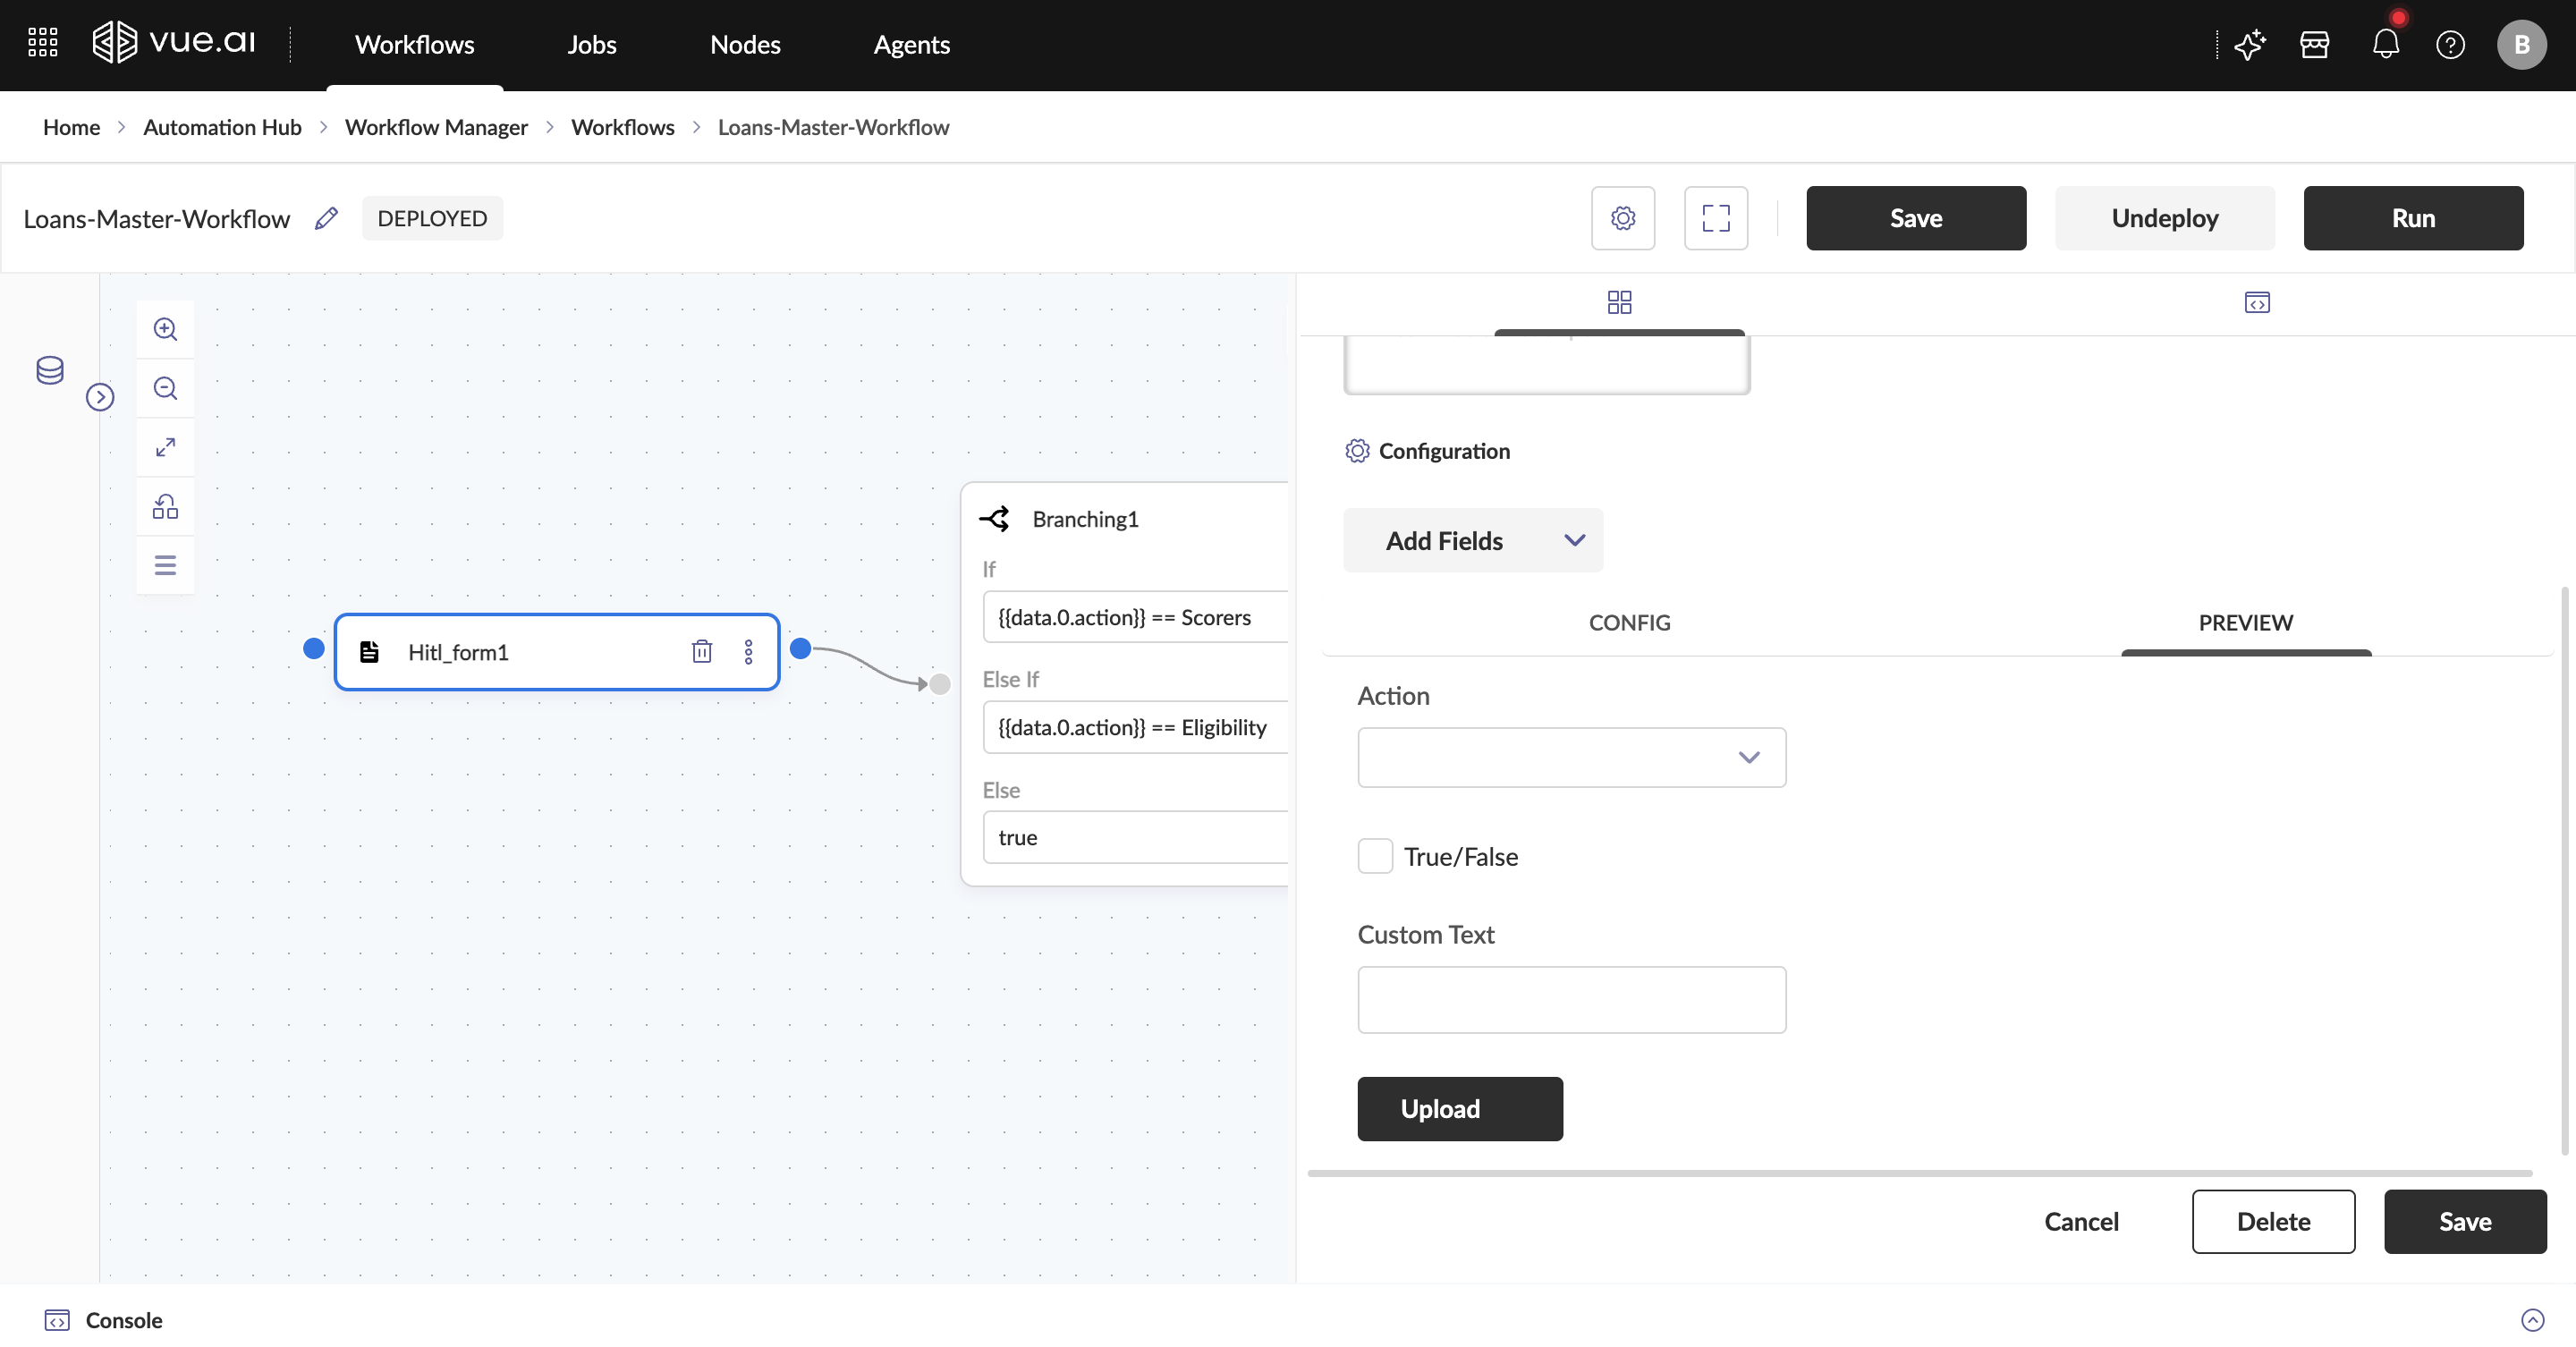
- The Upload option allows for file uploads to S3 & returns the file path.
- Using the JSON Schema View
- The HITL Form can be directly edited by viewing the exact JSON schema section at the top right of the node pane. This section also allows modification of the values for Dropdown Field Type.
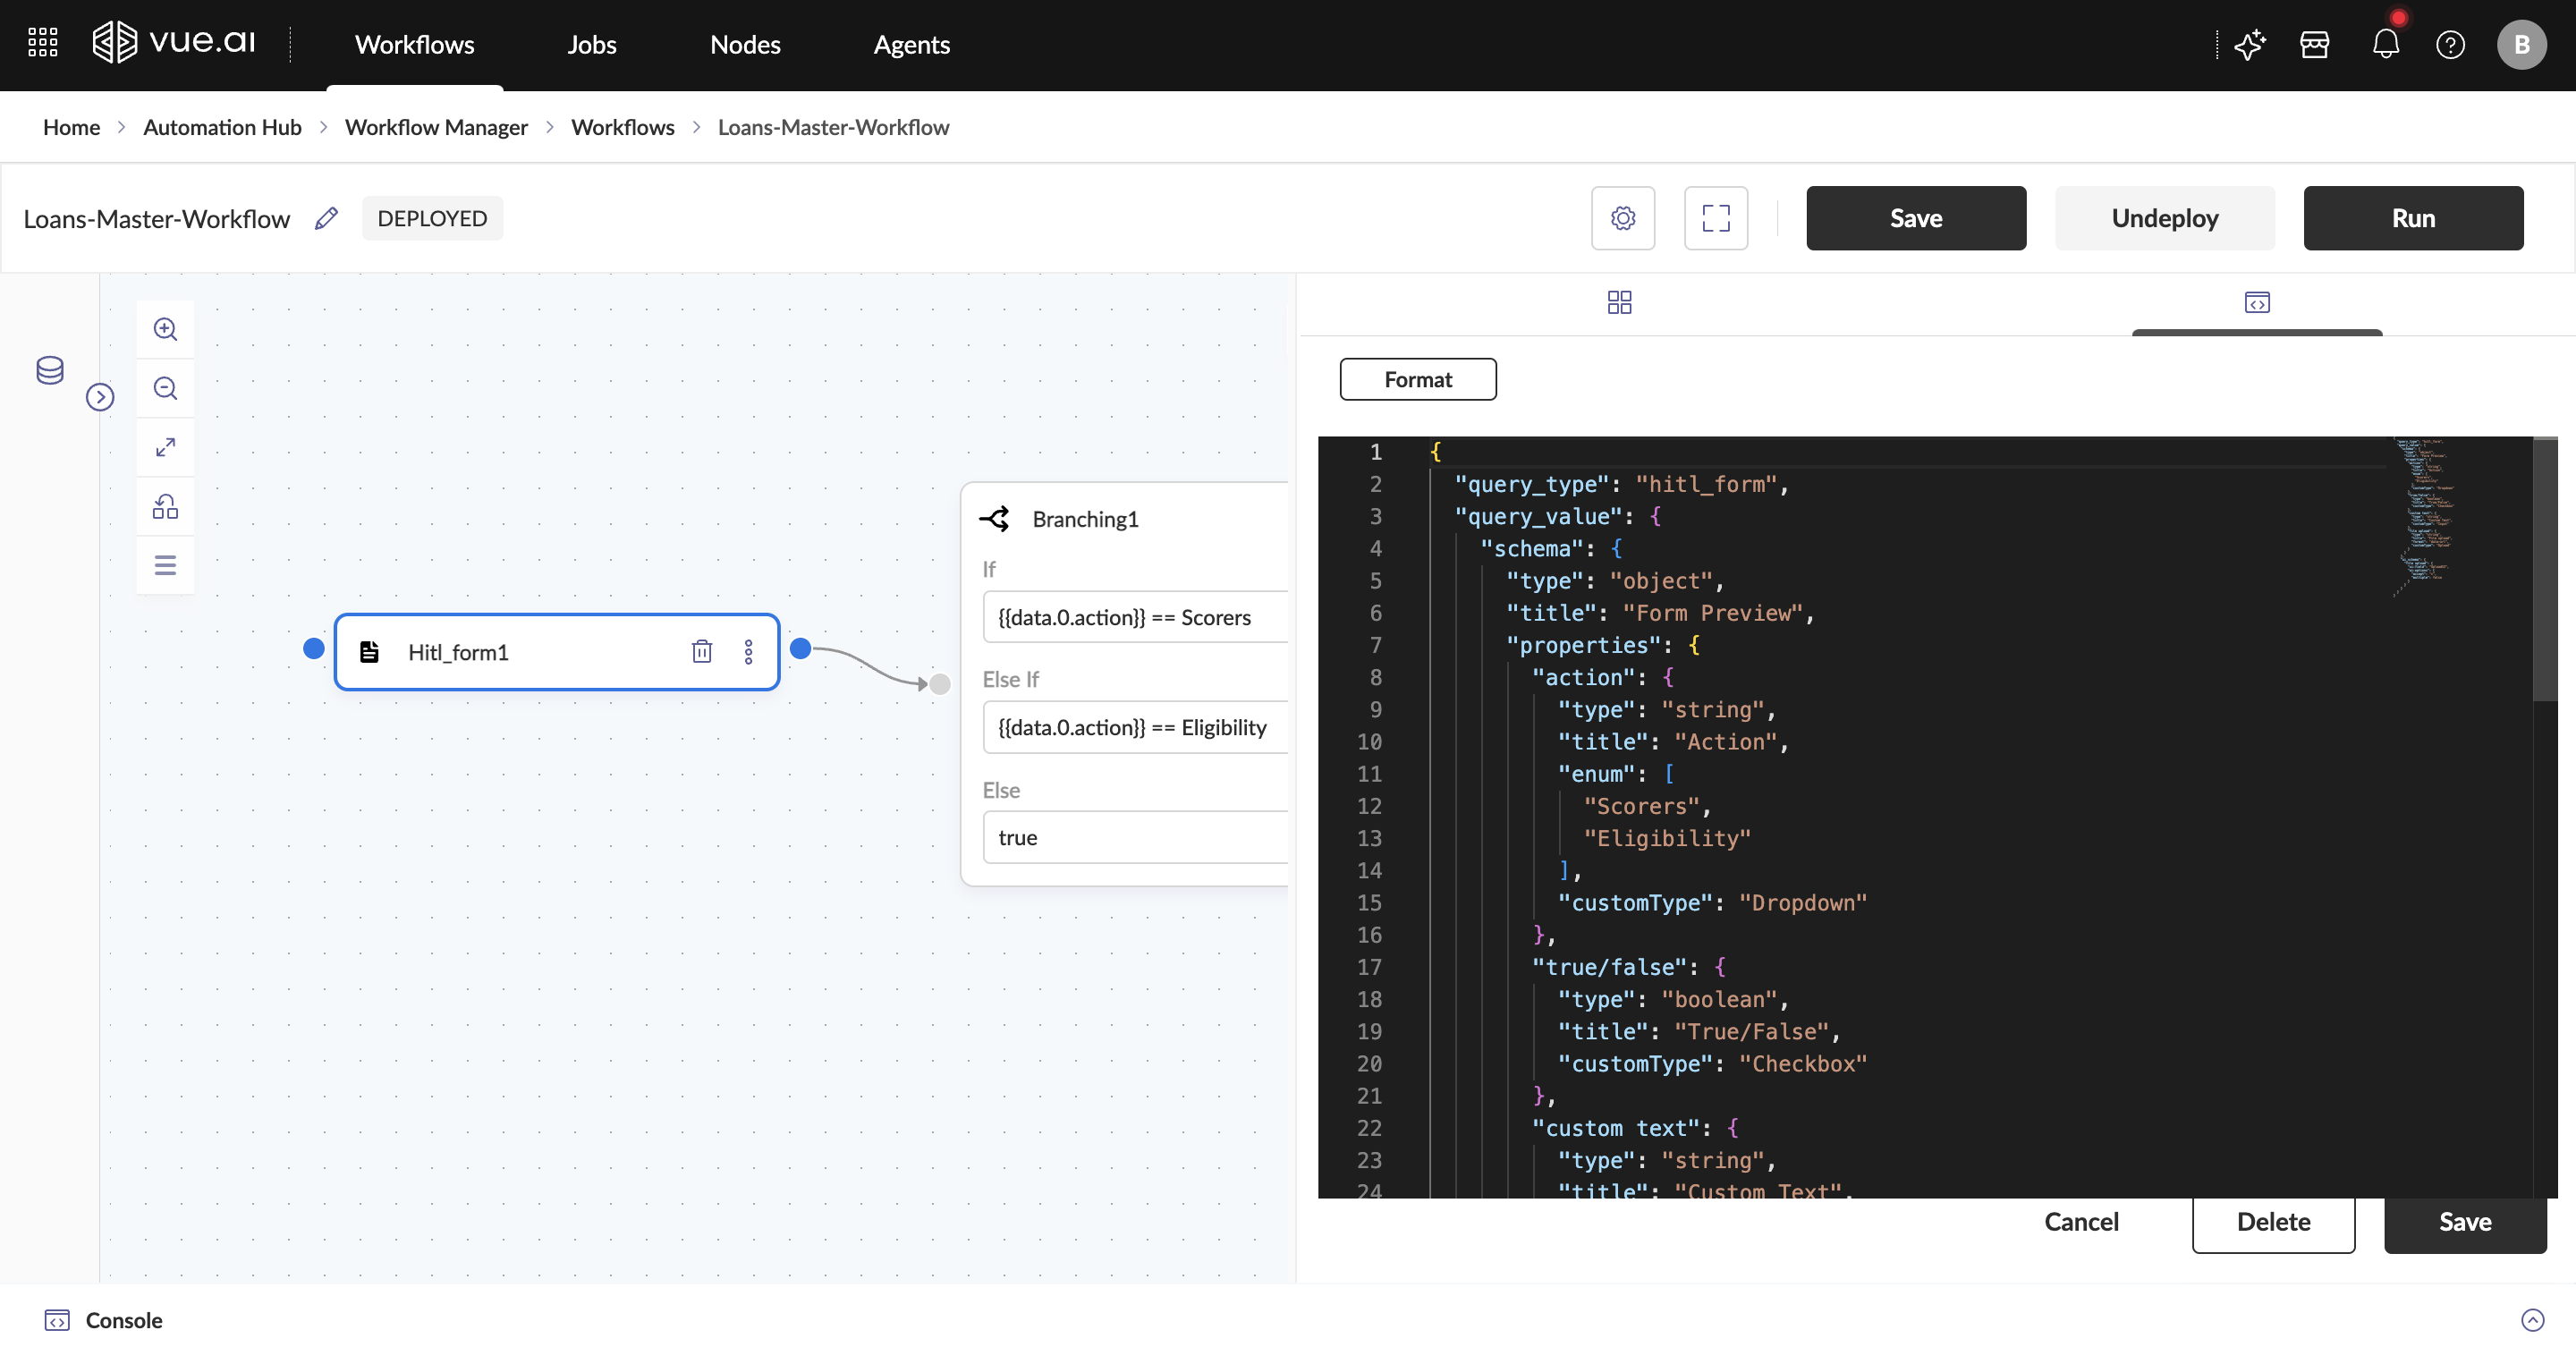
Accessing & Inputing to HITL Form in the Job screen
- To give an input to a HITL Form in a job run, wait for the control flow to reach the node & then click on it.
- This would open a smaller screen where each field can be given values based on user preference.
- Finally, click on
Submitto resume the Job
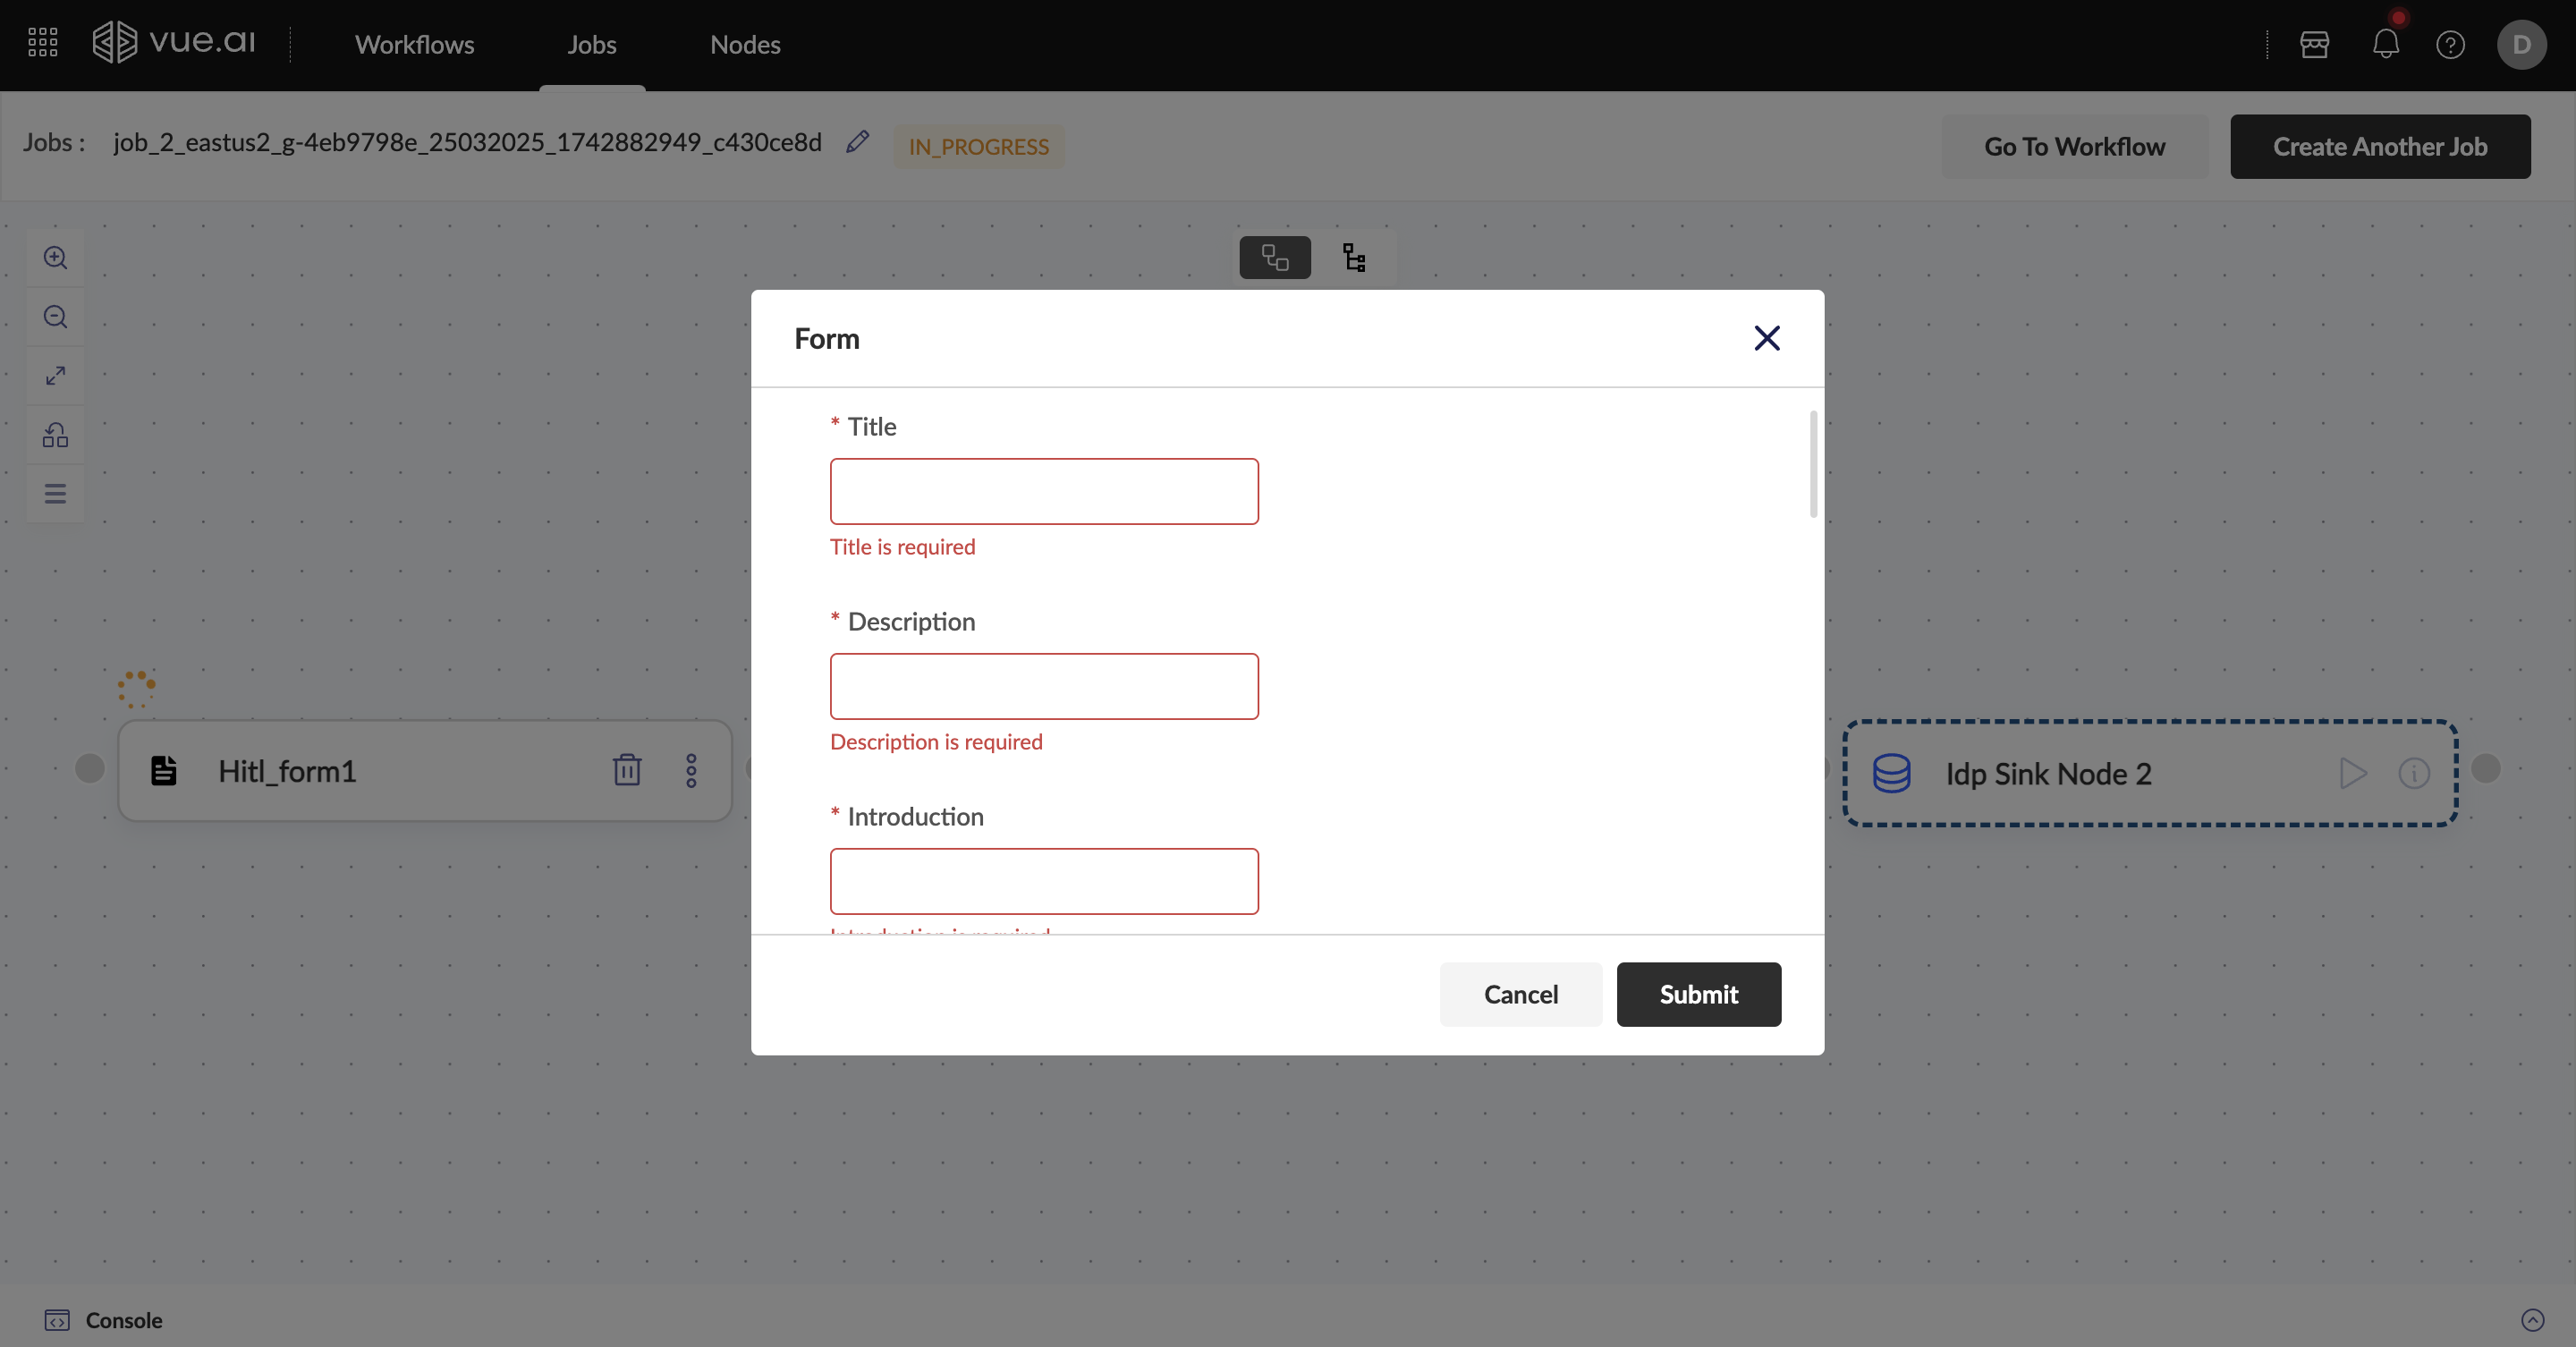
Available Fields for the HITL Form
Below is a list of available fields and their usage:
| Field | Description | Example Usage Downstream |
|---|---|---|
| Checkbox | This is a simple boolean field | Flag based conditional checks |
| Input | This is a flexible text input string | Passing in custom inputs for processes |
| Dropdown | This is an input with predefined options | Case-based conditional checks |
| Upload | This is an option to upload a file | Files needed downstream based on user intervention |
These field types provide flexibility to incorporate human validation, ensuring critical decisions are reviewed and refined as needed.
Troubleshooting
The workflow is not progressing past the HITL Form Possible Cause: Pending human validation or approval. Solution: Check if the workflow is waiting for user action. Ensure the HITL Form has an assigned reviewer, and the decision is submitted.
The HITL Form is not appearing in the workflow canvas Possible Cause: The node may not be enabled for the account. Solution: If the node is missing, check with the administrator to see if preset nodes are added.
The dropdown values are not appearing in the HITL Form Possible Cause: The dropdown options might not be configured correctly. Solution: Navigate to the Config section of the node and verify that the predefined options are correctly defined.
Additional Information
HITL Form Permissions
- Ensure that the appropriate users have access to review and modify HITL Form decisions.
- Workflow administrators may need to configure permissions based on business requirements.
Integration with Other Nodes
- The HITL Form can be used in conjunction with other automation nodes to balance efficiency and accuracy.
- Ensure that decisions made within the HITL Form are properly passed to subsequent nodes for execution.
Best Practices for Using HITL Forms
- Use HITL Forms only in workflows where human intervention is necessary to avoid unnecessary delays.
- Keep the number of fields minimal to ensure a streamlined review process.
- Define clear guidelines for reviewers to ensure consistent decision-making.
FAQ
Do I need to use all the 4 fields present in the HITL Form?
No, any of the 4 field can be used as per the need.
Summary
This guide covered how to use the HITL Form to involve human validation and intervention in workflows.
HTTP Node
Welcome to the HTTP Node guide! This guide will assist users in sending different types of inputs to APIs within workflows based on user configurations.
Expected Outcome: By the end of this guide, an understanding of the HTTP Node and its applications in the Vue.ai platform will be gained.
Overview
The HTTP (Hypertext Transfer Protocol) Node enables seamless integration with external APIs within automated workflows. It allows users to send HTTP requests by providing the API URL, request method, headers, authentication keys, query parameters, and request body via input fields. This node supports making API calls using cURL or direct HTTP configurations, facilitating real-time data exchange between systems. The response from the API is returned in a structured JSON format, enabling further processing within the workflow. The HTTP Node is particularly useful for fetching external data, triggering third-party services, or interacting with web-based applications, enhancing the flexibility and connectivity of automated processes.
Prerequisites For a better understanding of Code Nodes and Workflows, it is recommended to review the Getting Started with Workflows documentation.
Navigation To begin, the following path should be navigated: Home/Landing Page → Automation Hub → Workflow Manager → Workflows → New Workflow
How to Configure the HTTP Node in the Workflow
The HTTP Node allows users to make API requests by specifying the URL, method, headers, query parameters, route parameters, and request body. This enables seamless integration with external services.
Here's a structured step-by-step guide for using the HTTP Node in a workflow:
Step 1: Add the HTTP Node to the Workflow
- Drag and drop the HTTP Node from the node panel onto the workflow canvas.
- Click on the HTTP Node to open the configuration panel on the right side.
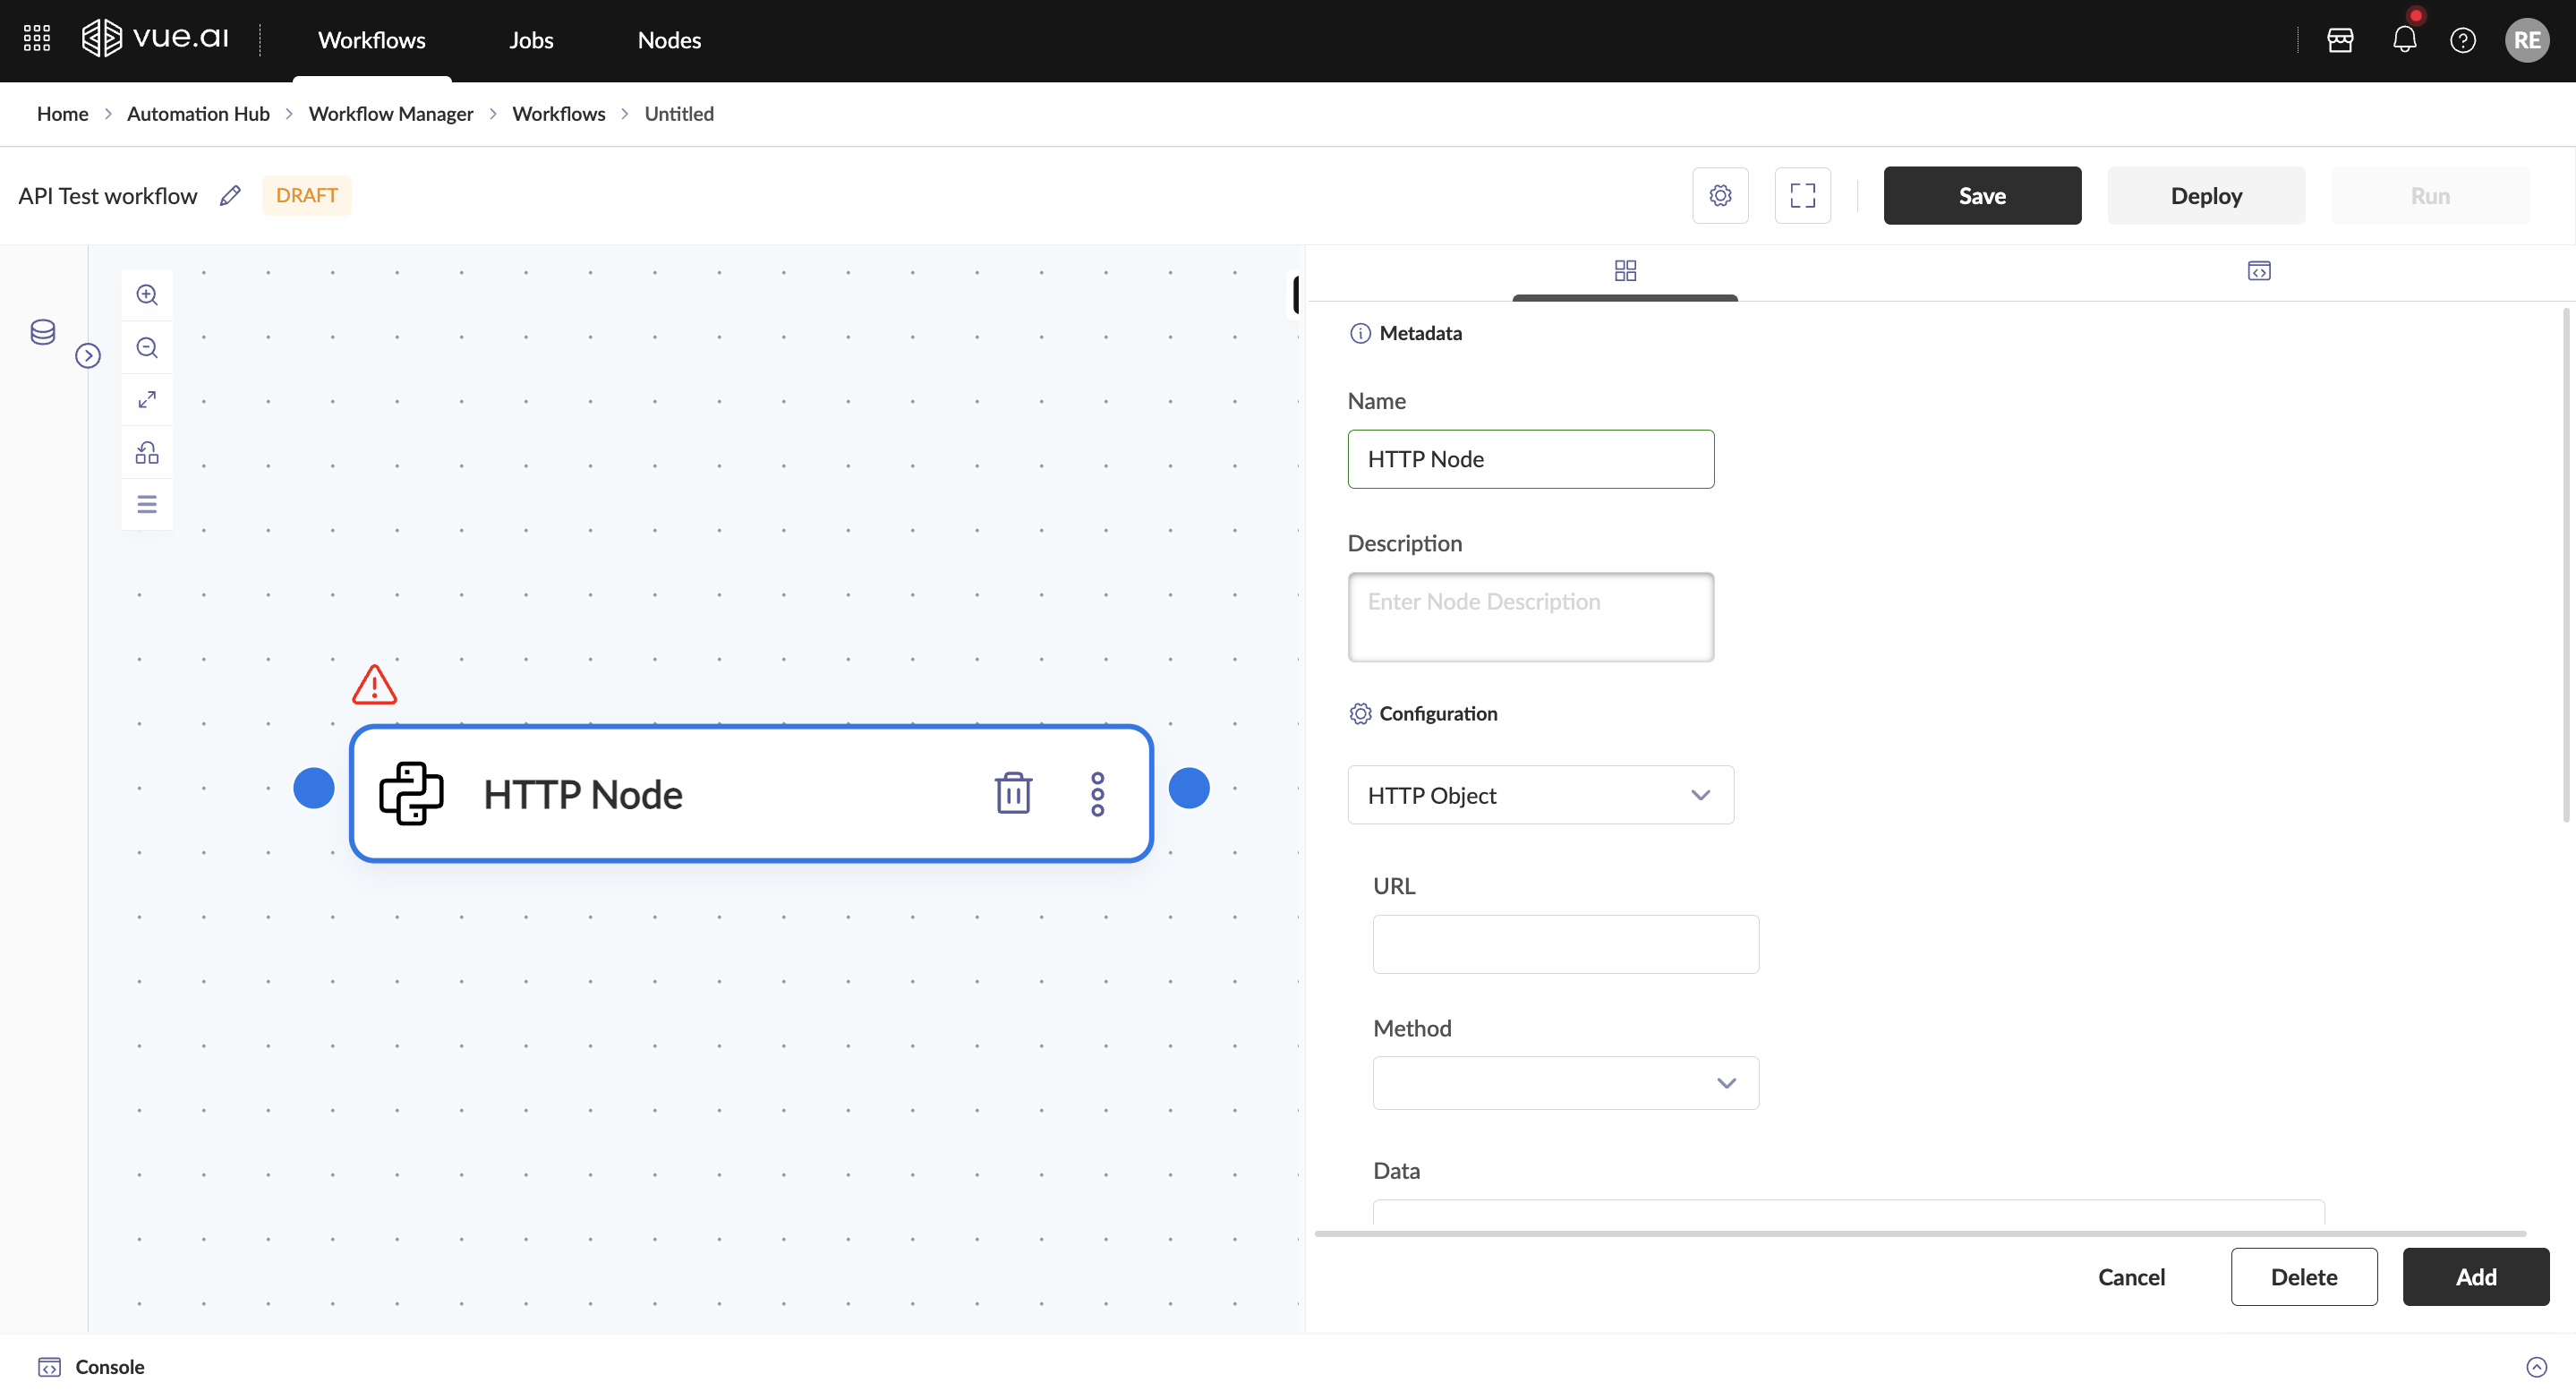
Step 2: Configure the HTTP Request
The HTTP Node provides two primary ways to configure the API request:
Option 1: Using Structured Input Fields
- Select
HTTP Objectfrom the dropdown and give your inputs as below:- URL: Enter the endpoint you want to call.
- Method: Select the HTTP method (GET, POST, PUT, DELETE, etc.).
- Data: Provide the request body (if applicable) in JSON format.
- Headers, Query Params, and Route Params:
- Click
Add Itemunder each section to include key-value pairs. - Use headers for authentication, content-type, etc.
- Query parameters help refine API calls.
- Route parameters define dynamic parts of the endpoint.
- Click
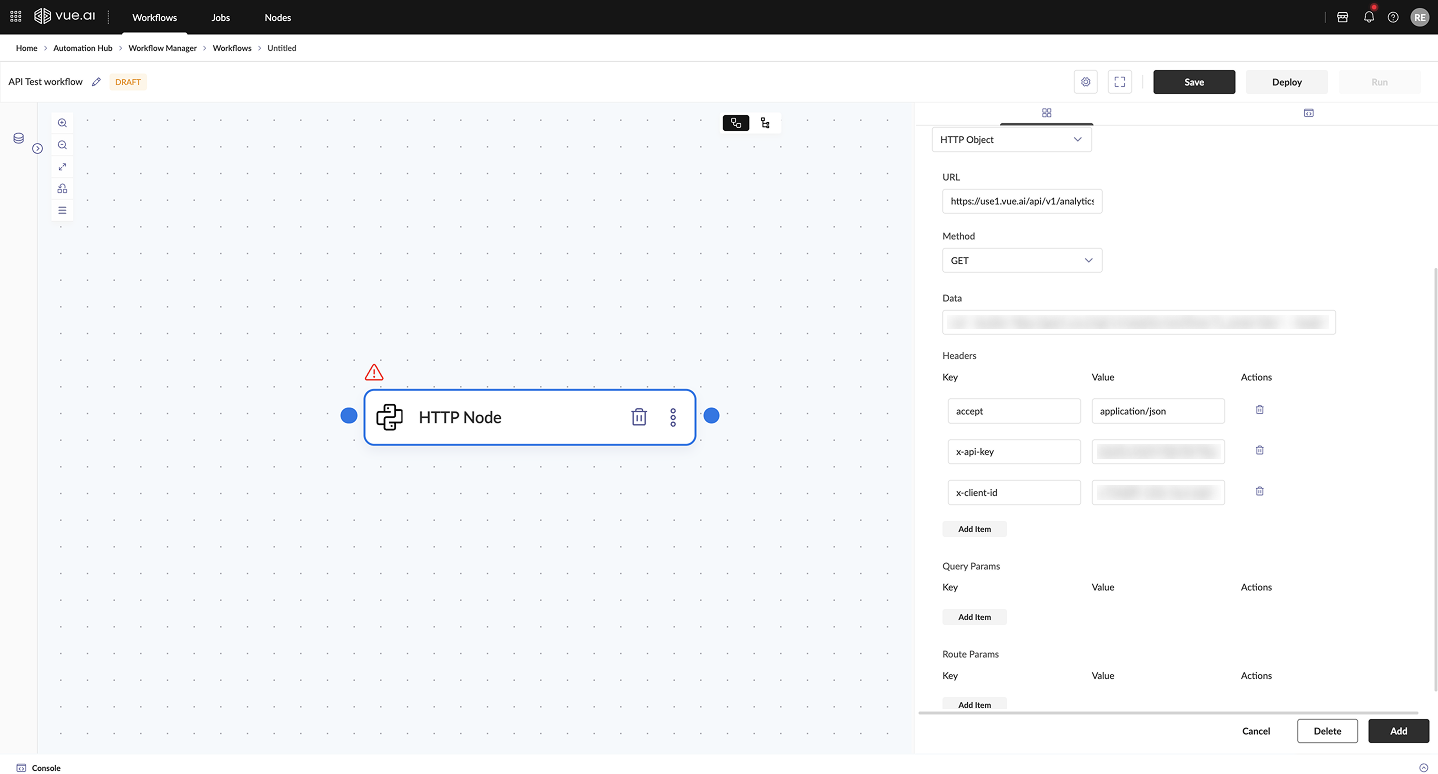
Option 2: Using cURL Input
Alternatively, you can use a cURL command to configure the HTTP request:
- Select
HTTP Curlfrom the dropdown. - Paste your cURL command into the provided text box.
- The code node will parse the cURL request and execute it.
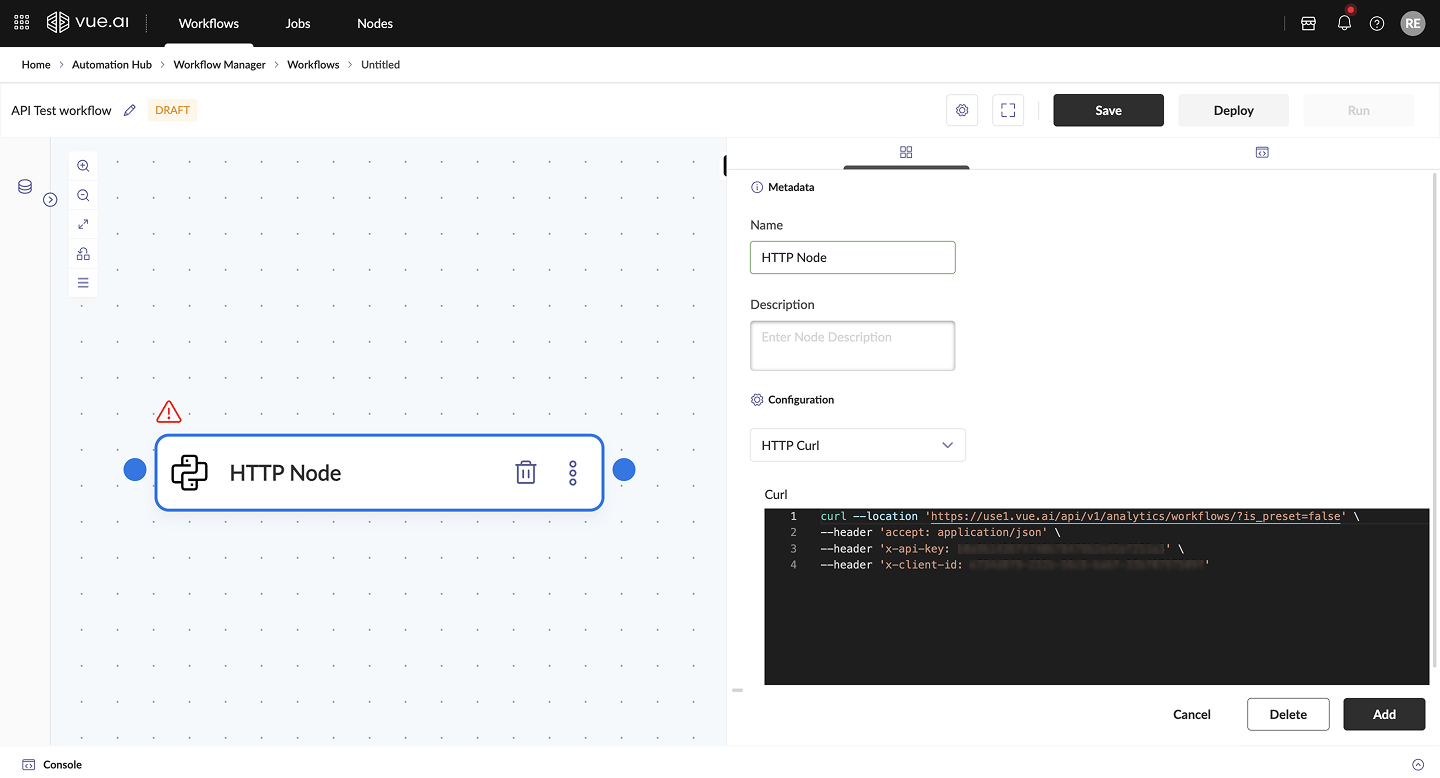
Step 3: Review and Modify JSON Schema
- Once fields are configured, you can check the JSON schema under the Config section.
- Modify dropdown field types or adjust parameters as needed.
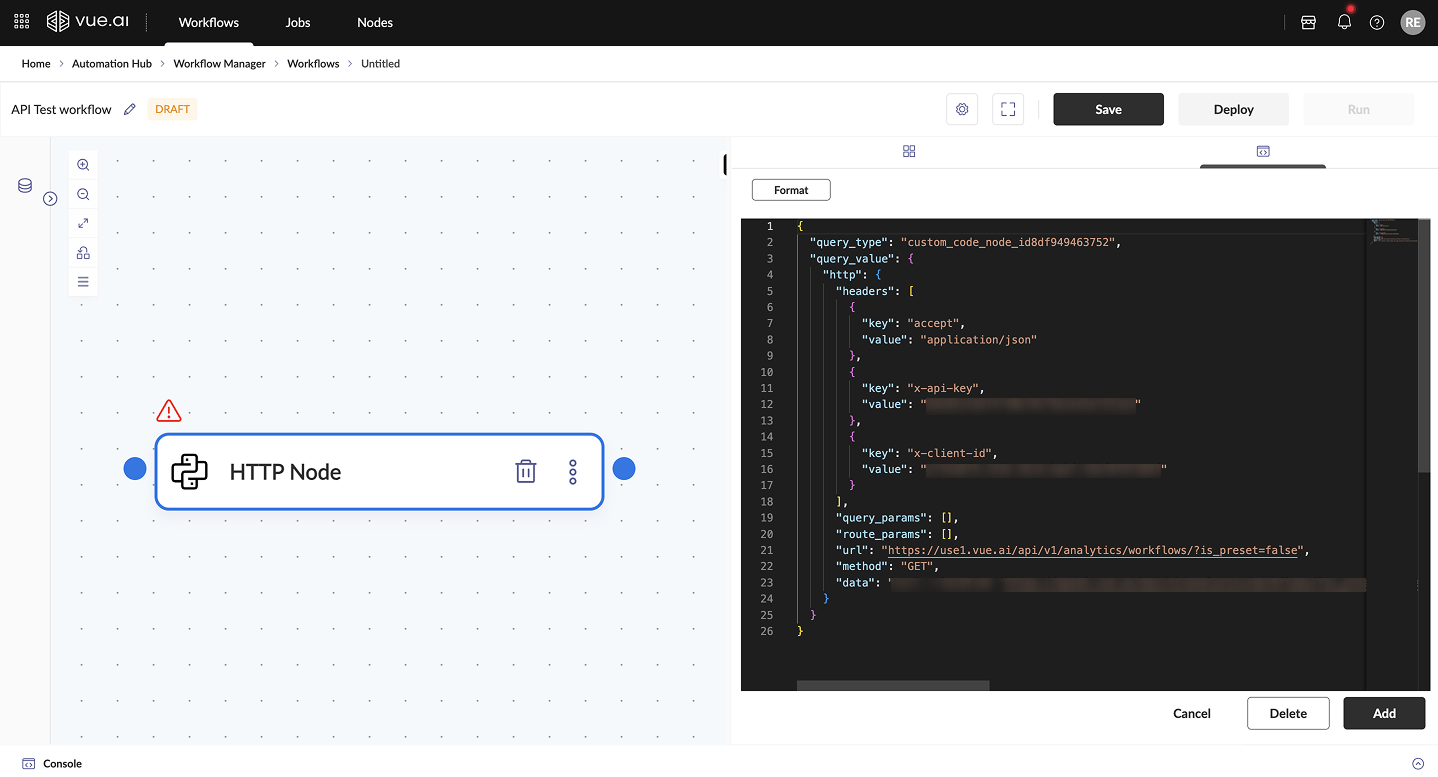
Step 4: Execute the API Request
- After configuring the request, click on
Addat the right bottom of the panel to add and create a sink data node. Speed Run / Deploy Run to execute it and receive a JSON-formatted response. - The response will contain the API's output, which can be further processed in the workflow.
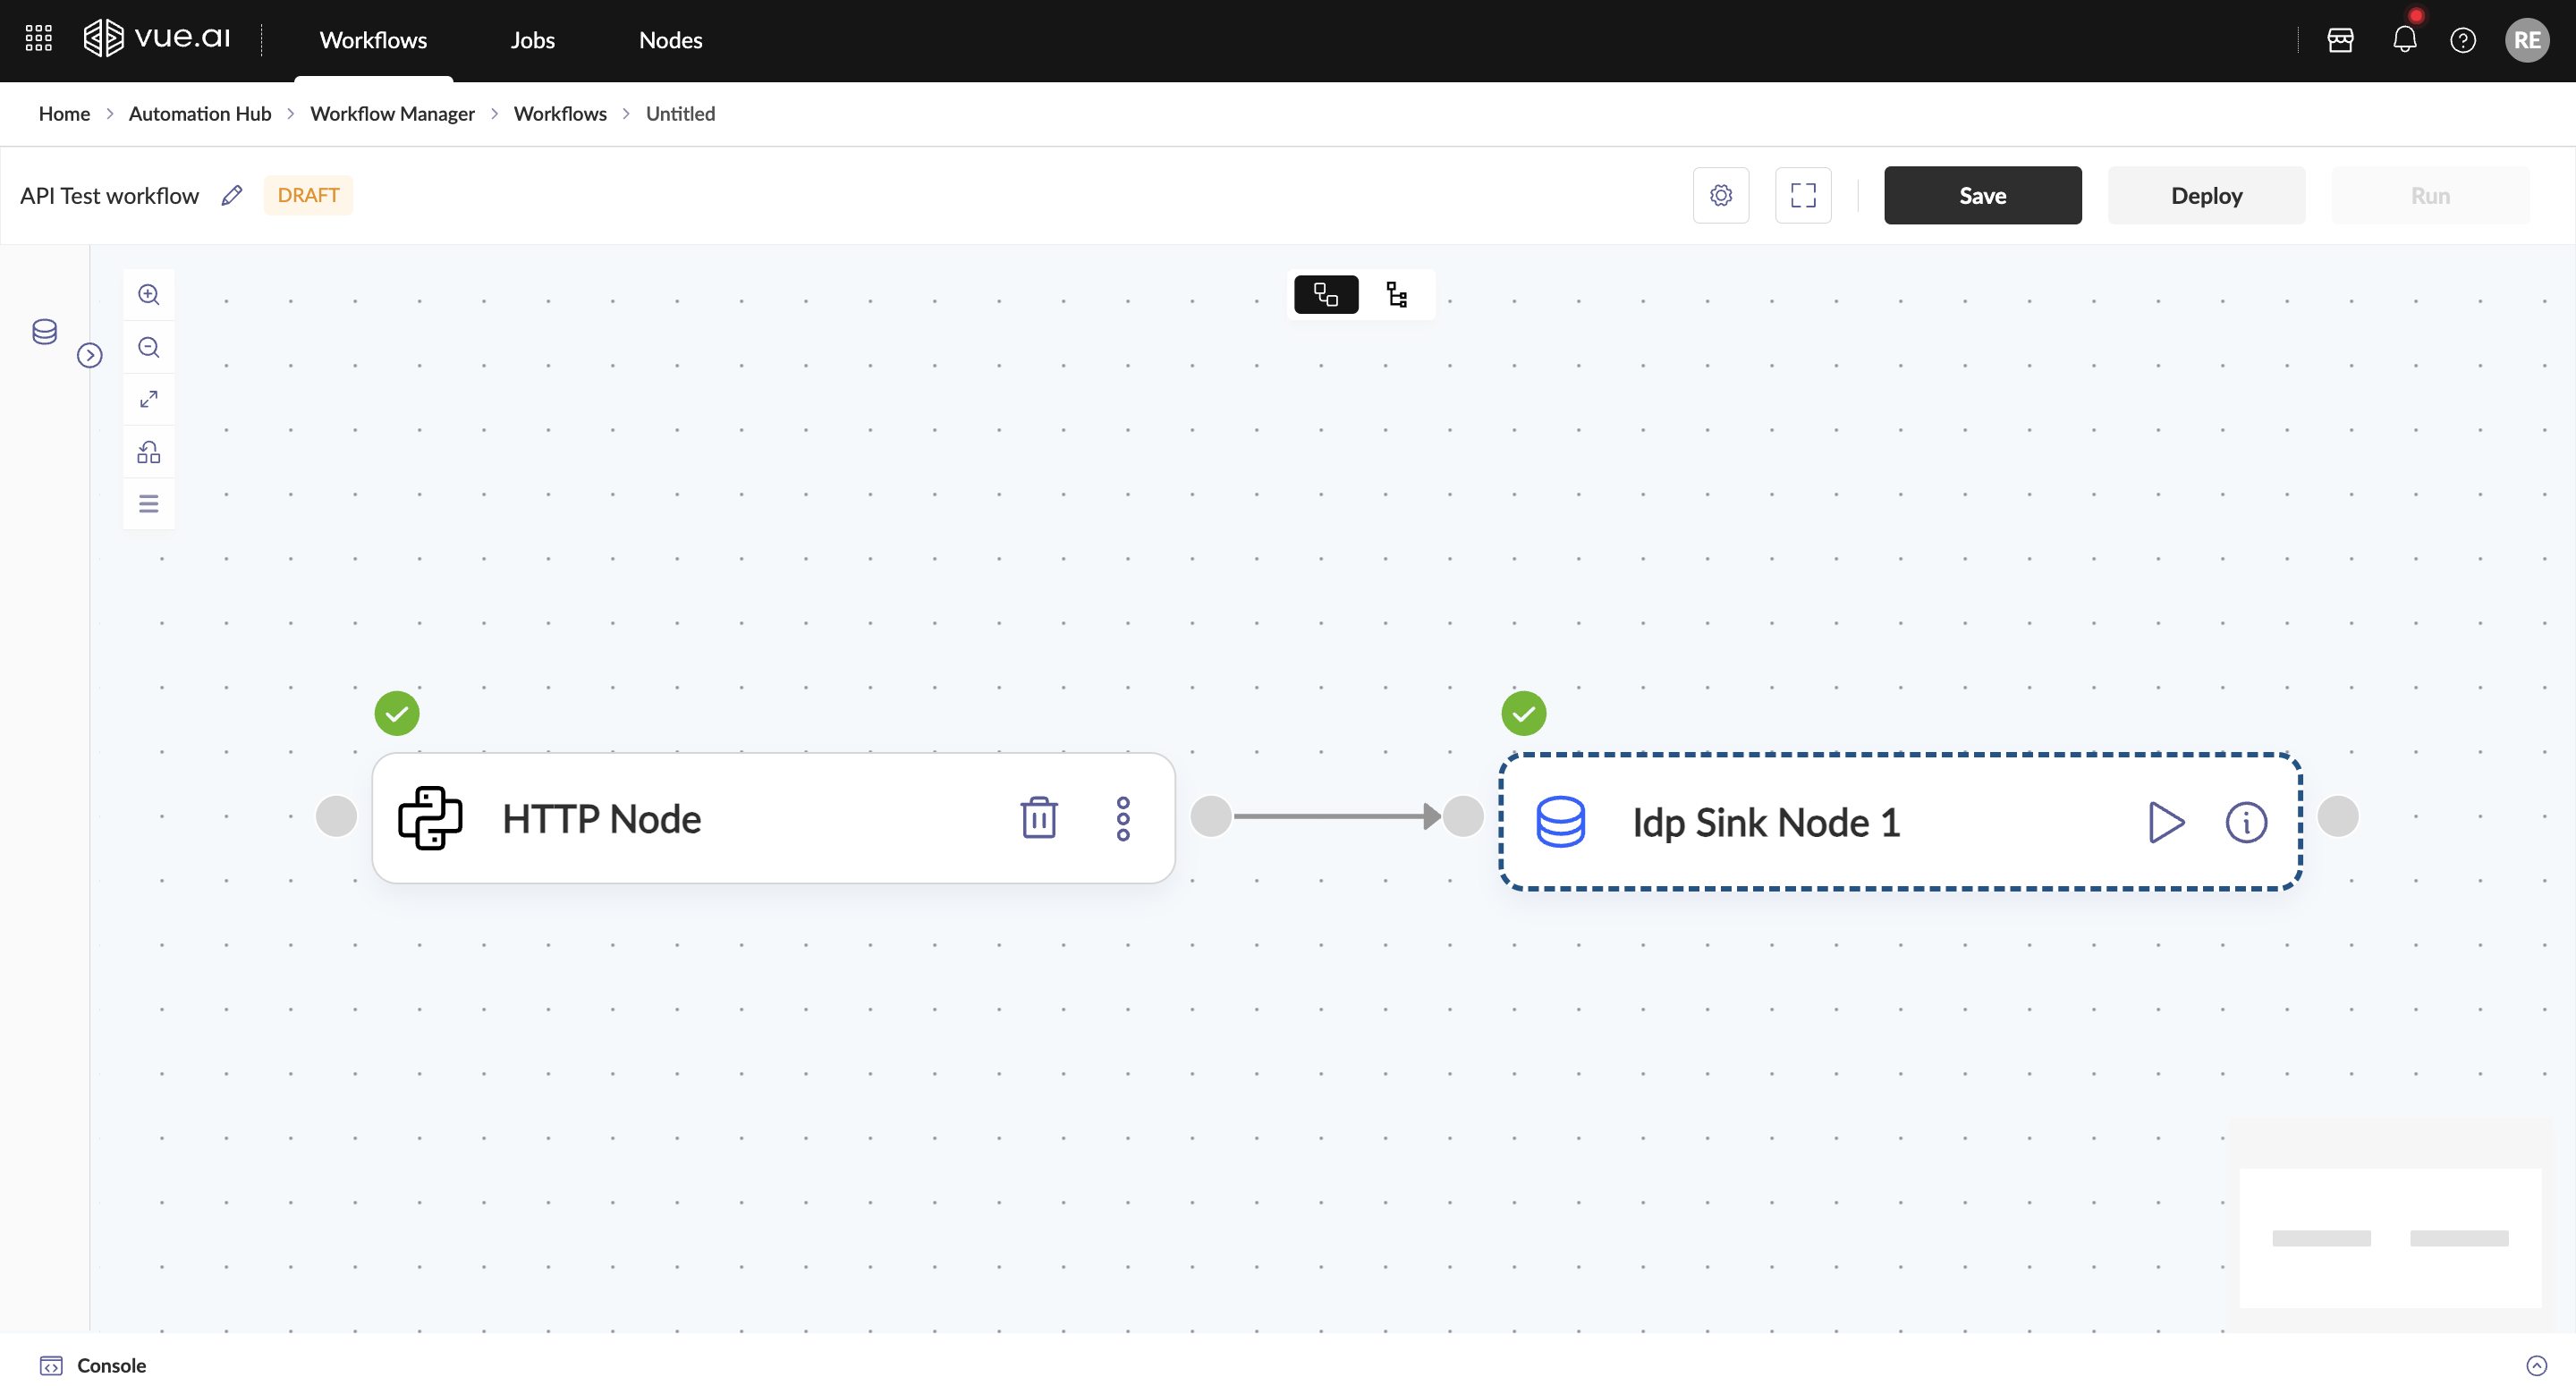
Troubleshooting
1. The HTTP Node is not appearing in the workflow canvas Possible Cause: The node may not be enabled for the account. Solution: If the node is missing, check with the administrator to see if preset nodes are added.
2. API request is failing with a 401 Unauthorized error Possible Cause: Missing or incorrect authentication credentials. Solution: Verify that the correct API key, token, or credentials are provided in the headers or authentication fields.
3. API response returns an empty or unexpected result Possible Cause: Incorrect query parameters, request body, or endpoint. Solution: Double-check the API documentation and ensure the parameters match the expected format.
4. The response format is incorrect or unreadable Possible Cause: API returns data in a different format (XML, plain text, etc.). Solution: Check the API's Content-Type and use a transformation node if necessary to parse the response.
5. API call is timing out Possible Cause: Slow API response or network issues. Solution: Increase the timeout setting, optimize the request payload, or check for API performance issues.
6. API call works in Postman but fails in the workflow Possible Cause: Differences in headers, authentication, or request body formatting. Solution: Compare request details and ensure they match what works in Postman, including headers and payload structure.
Additional Information
Best Practices for Using HTTP Nodes
- Use the HTTP Node efficiently to integrate APIs and automate processes without unnecessary API calls.
- Minimize the number of query parameters and headers to optimize request performance.
- Ensure API authentication is securely managed to prevent unauthorized access.
- Validate API responses to handle errors and unexpected data effectively.
- Structure API calls in a way that enhances workflow efficiency and minimizes execution delays.
Integration with Other Nodes
- The HTTP Node can be used in conjunction with other automation nodes to balance efficiency and flexbility of retrieving data from external environments.
- Ensure that the API's response within the HTTP Node is properly utilized to retrieve relevant information and automate subsequent tasks within the workflow.
FAQ
Can I dynamically set query parameters, headers, or request bodies?
Yes, you can use variables or workflow outputs to dynamically populate fields in the HTTP Node, allowing flexible API calls based on workflow data.
Summary
This guide covered how to use the HTTP Node to send API requests and retrieve external data for workflow automation.
Branching Node
Welcome to the Branching Node guide! This guide will assist users in understanding how to use the Branching Node to make decisions based on previous node values and utilizing the Branching Node to allow workflows to take different execution paths depending on specified conditions.
Who is this guide for? This guide is designed for users who need to implement conditional logic in workflows on the Vue.ai platform.
Overview
The Branching Node enables dynamic decision-making within workflows by evaluating the output of a preceding node and directing execution along different paths based on predefined conditions. Similar to an if-else statement, it allows workflows to adapt to varying inputs, ensuring that the appropriate actions are taken based on the context. This enhances automation flexibility, optimizes processing efficiency, and supports complex logic by enabling conditional execution at key decision points.
Prerequisites Before using the Branching Node, it is recommended that the following documentation be reviewed for a better understanding of workflows and related components:
- Getting Started with Workflows – Provides foundational knowledge about workflows and their structure.
- Code Node Creation Guide – Explains how to create a Code Node that can send values as input for decision-making.
- HITL Node Documentation – Describes how the HITL Node can be used for human-in-the-loop validation.
Navigation To begin, head to a Workflow Canvas to make use of the Branching Node: Home/Landing Page → Automation Hub → Workflow Manager → Workflows → New Workflow
Step-by-Step Instructions
Adding and Configuring the Branching Node
To integrate a Branching node into the workflow, the following steps should be followed:
- Add a Branching Node
- Drag and drop the Branching Node onto the workflow canvas from the control panel.
- Connect the Branching Node to a preceding node, such as a Custom Code Node or a HITL Node.
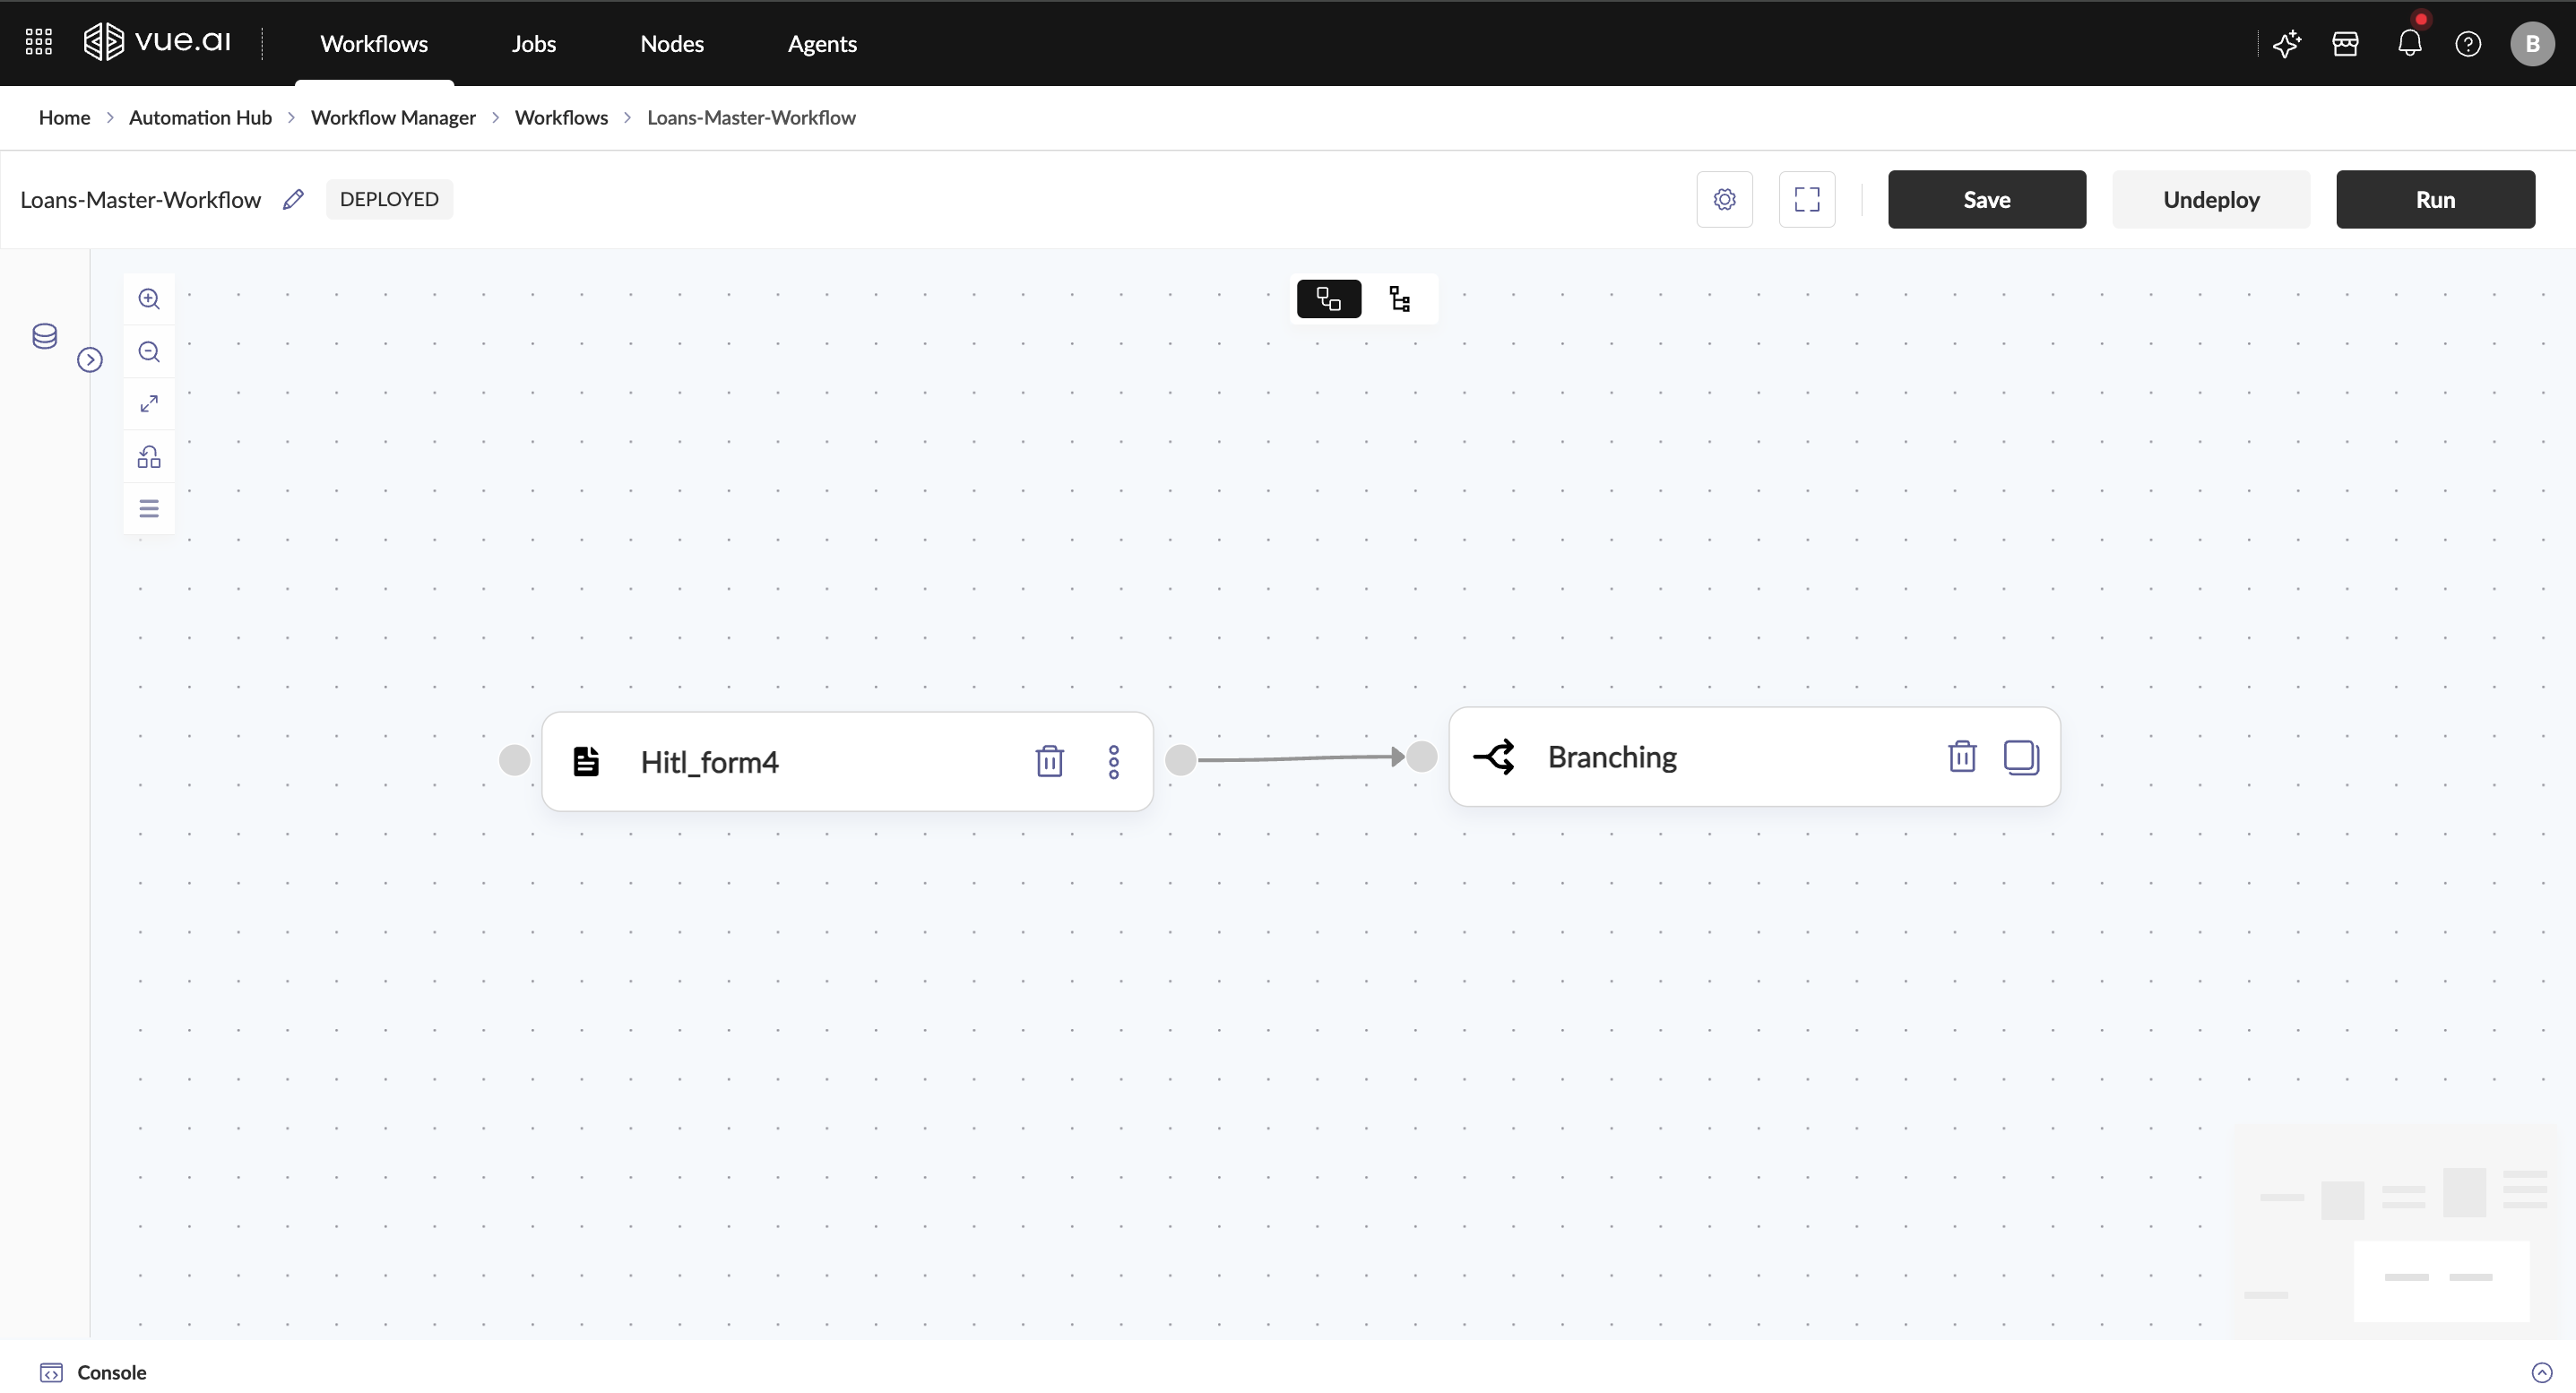
- Configure the Branching Node
- Using the Form Builder
- Click on Add Item to create a Condition in Branching Node.
- Specify the Field to be evaluated.
- Choose the Comparison Operator
- Select one of the available operators: ==, !=, >, <, >=, <=, in, isin, beginswith, endswith, like, is_empty.
- Set the value to be compared against.
- Using the Form Builder
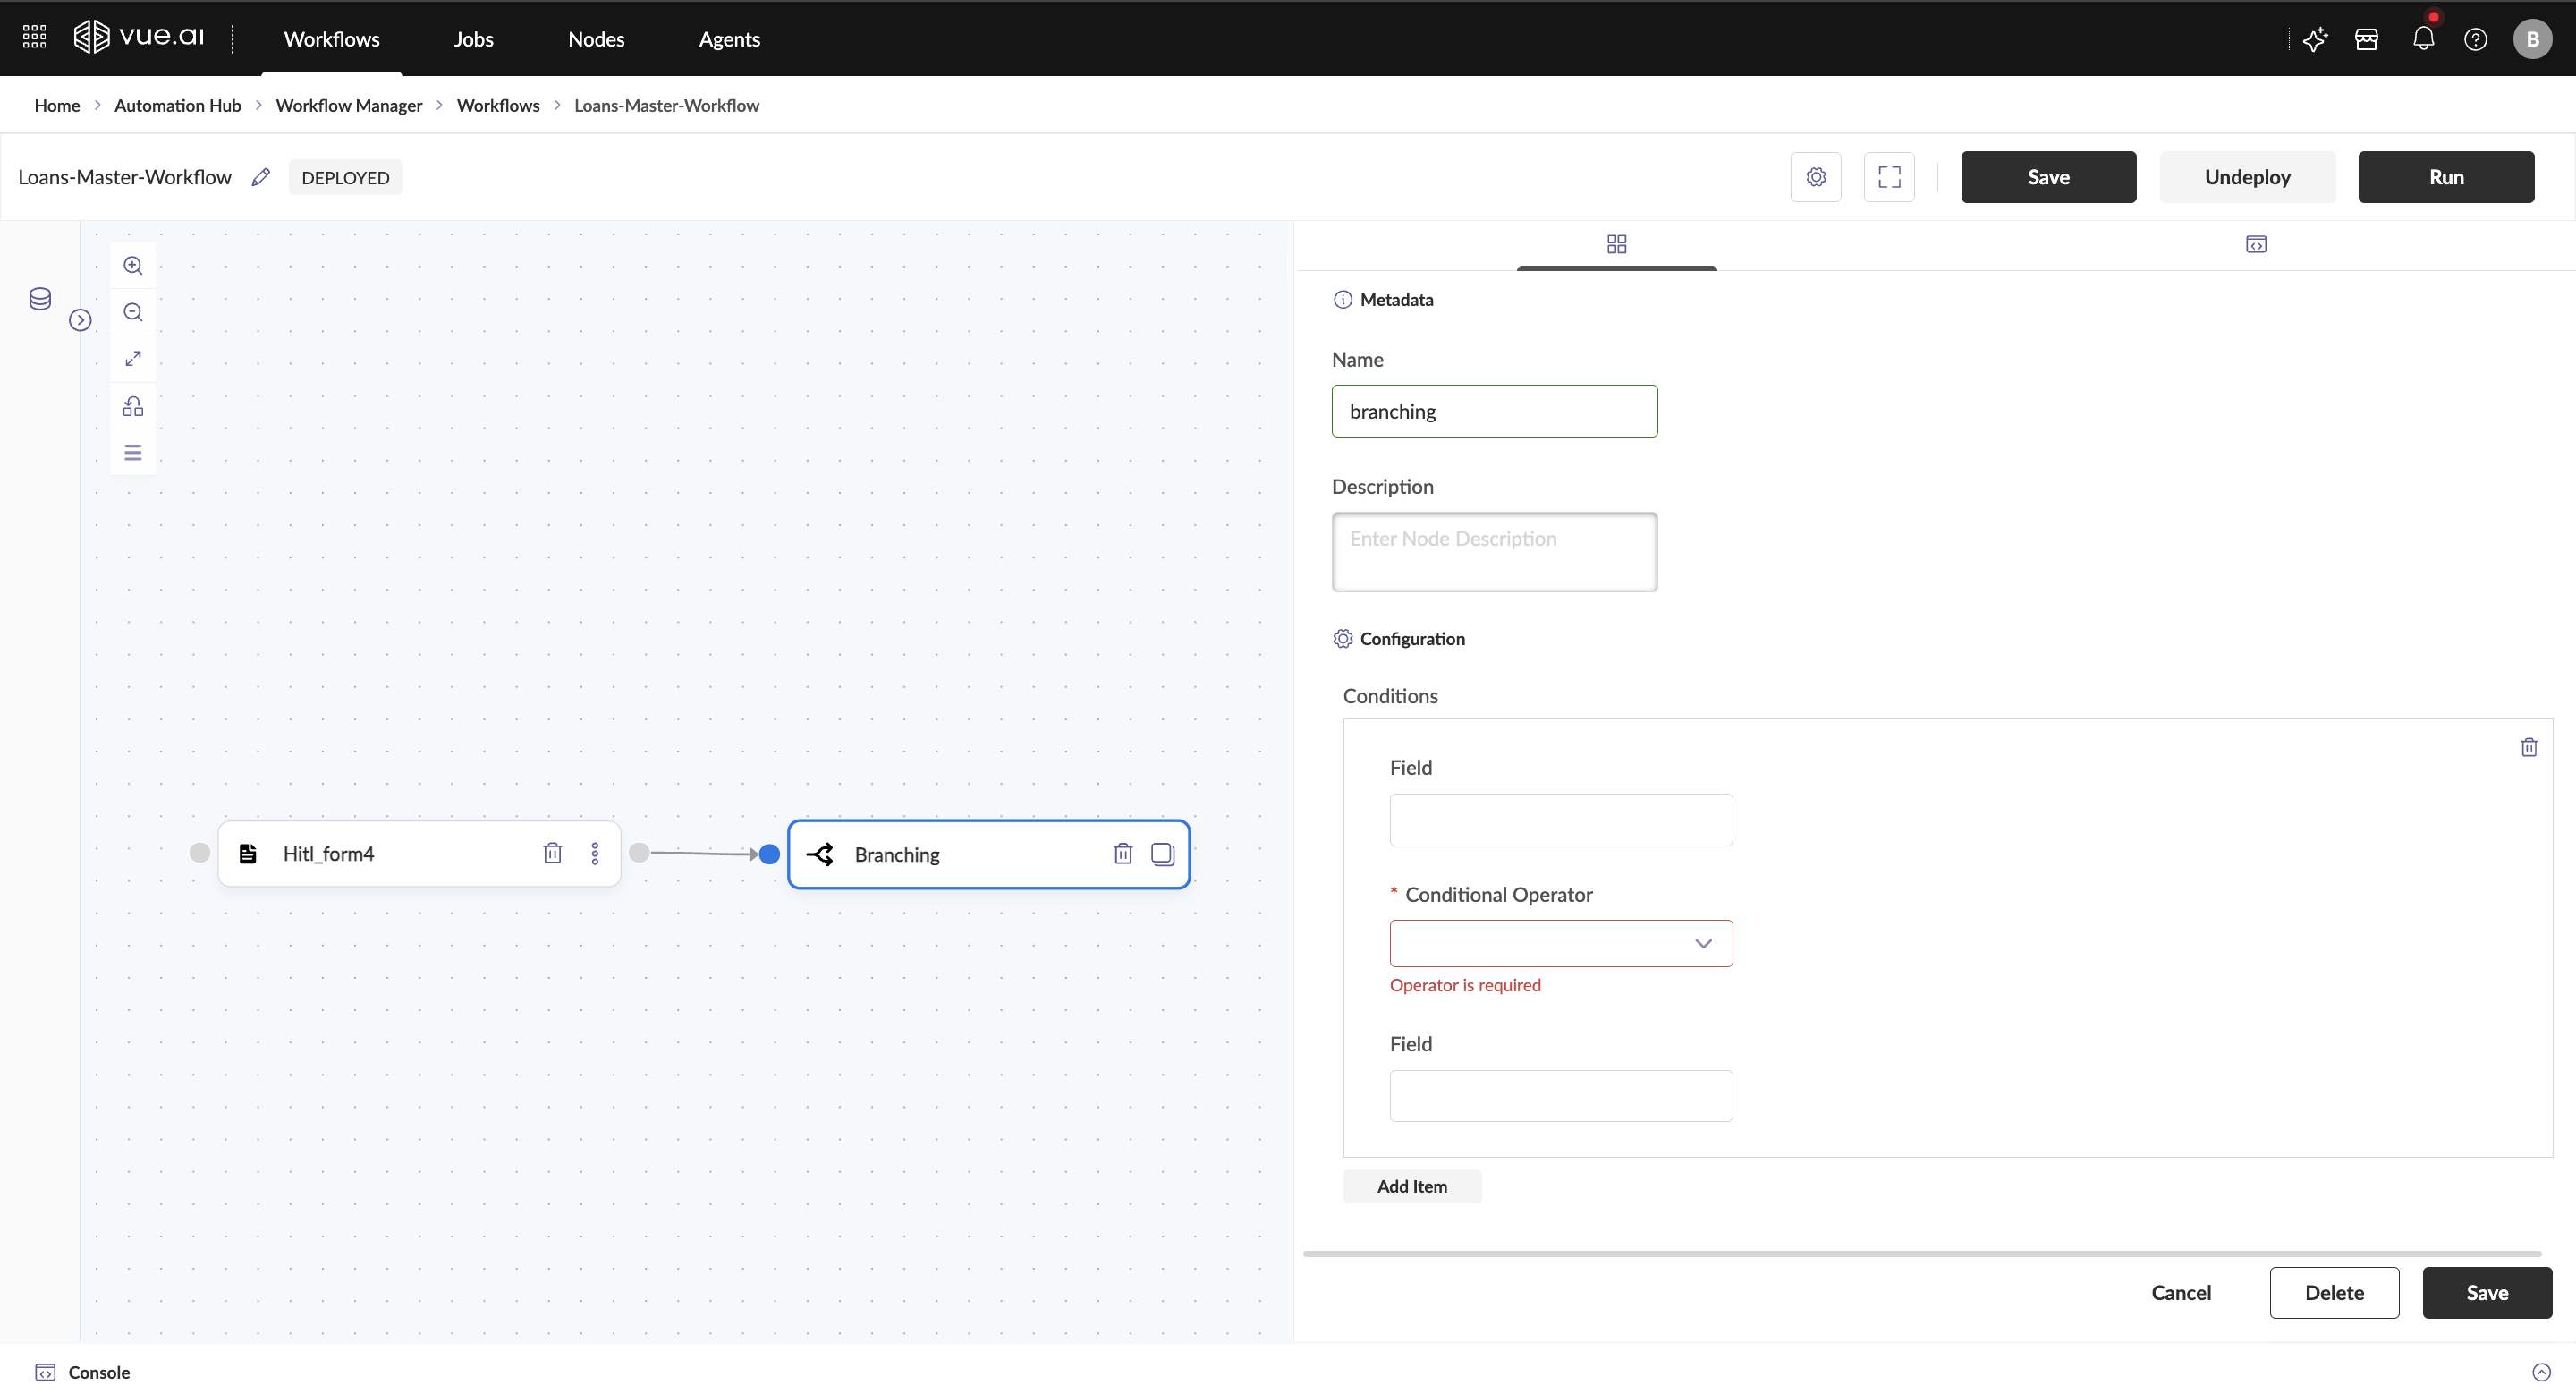
- Using the JSON Schema View
- The Branching Node Form can be directly edited by viewing the exact JSON schema section at the top right of the node pane.
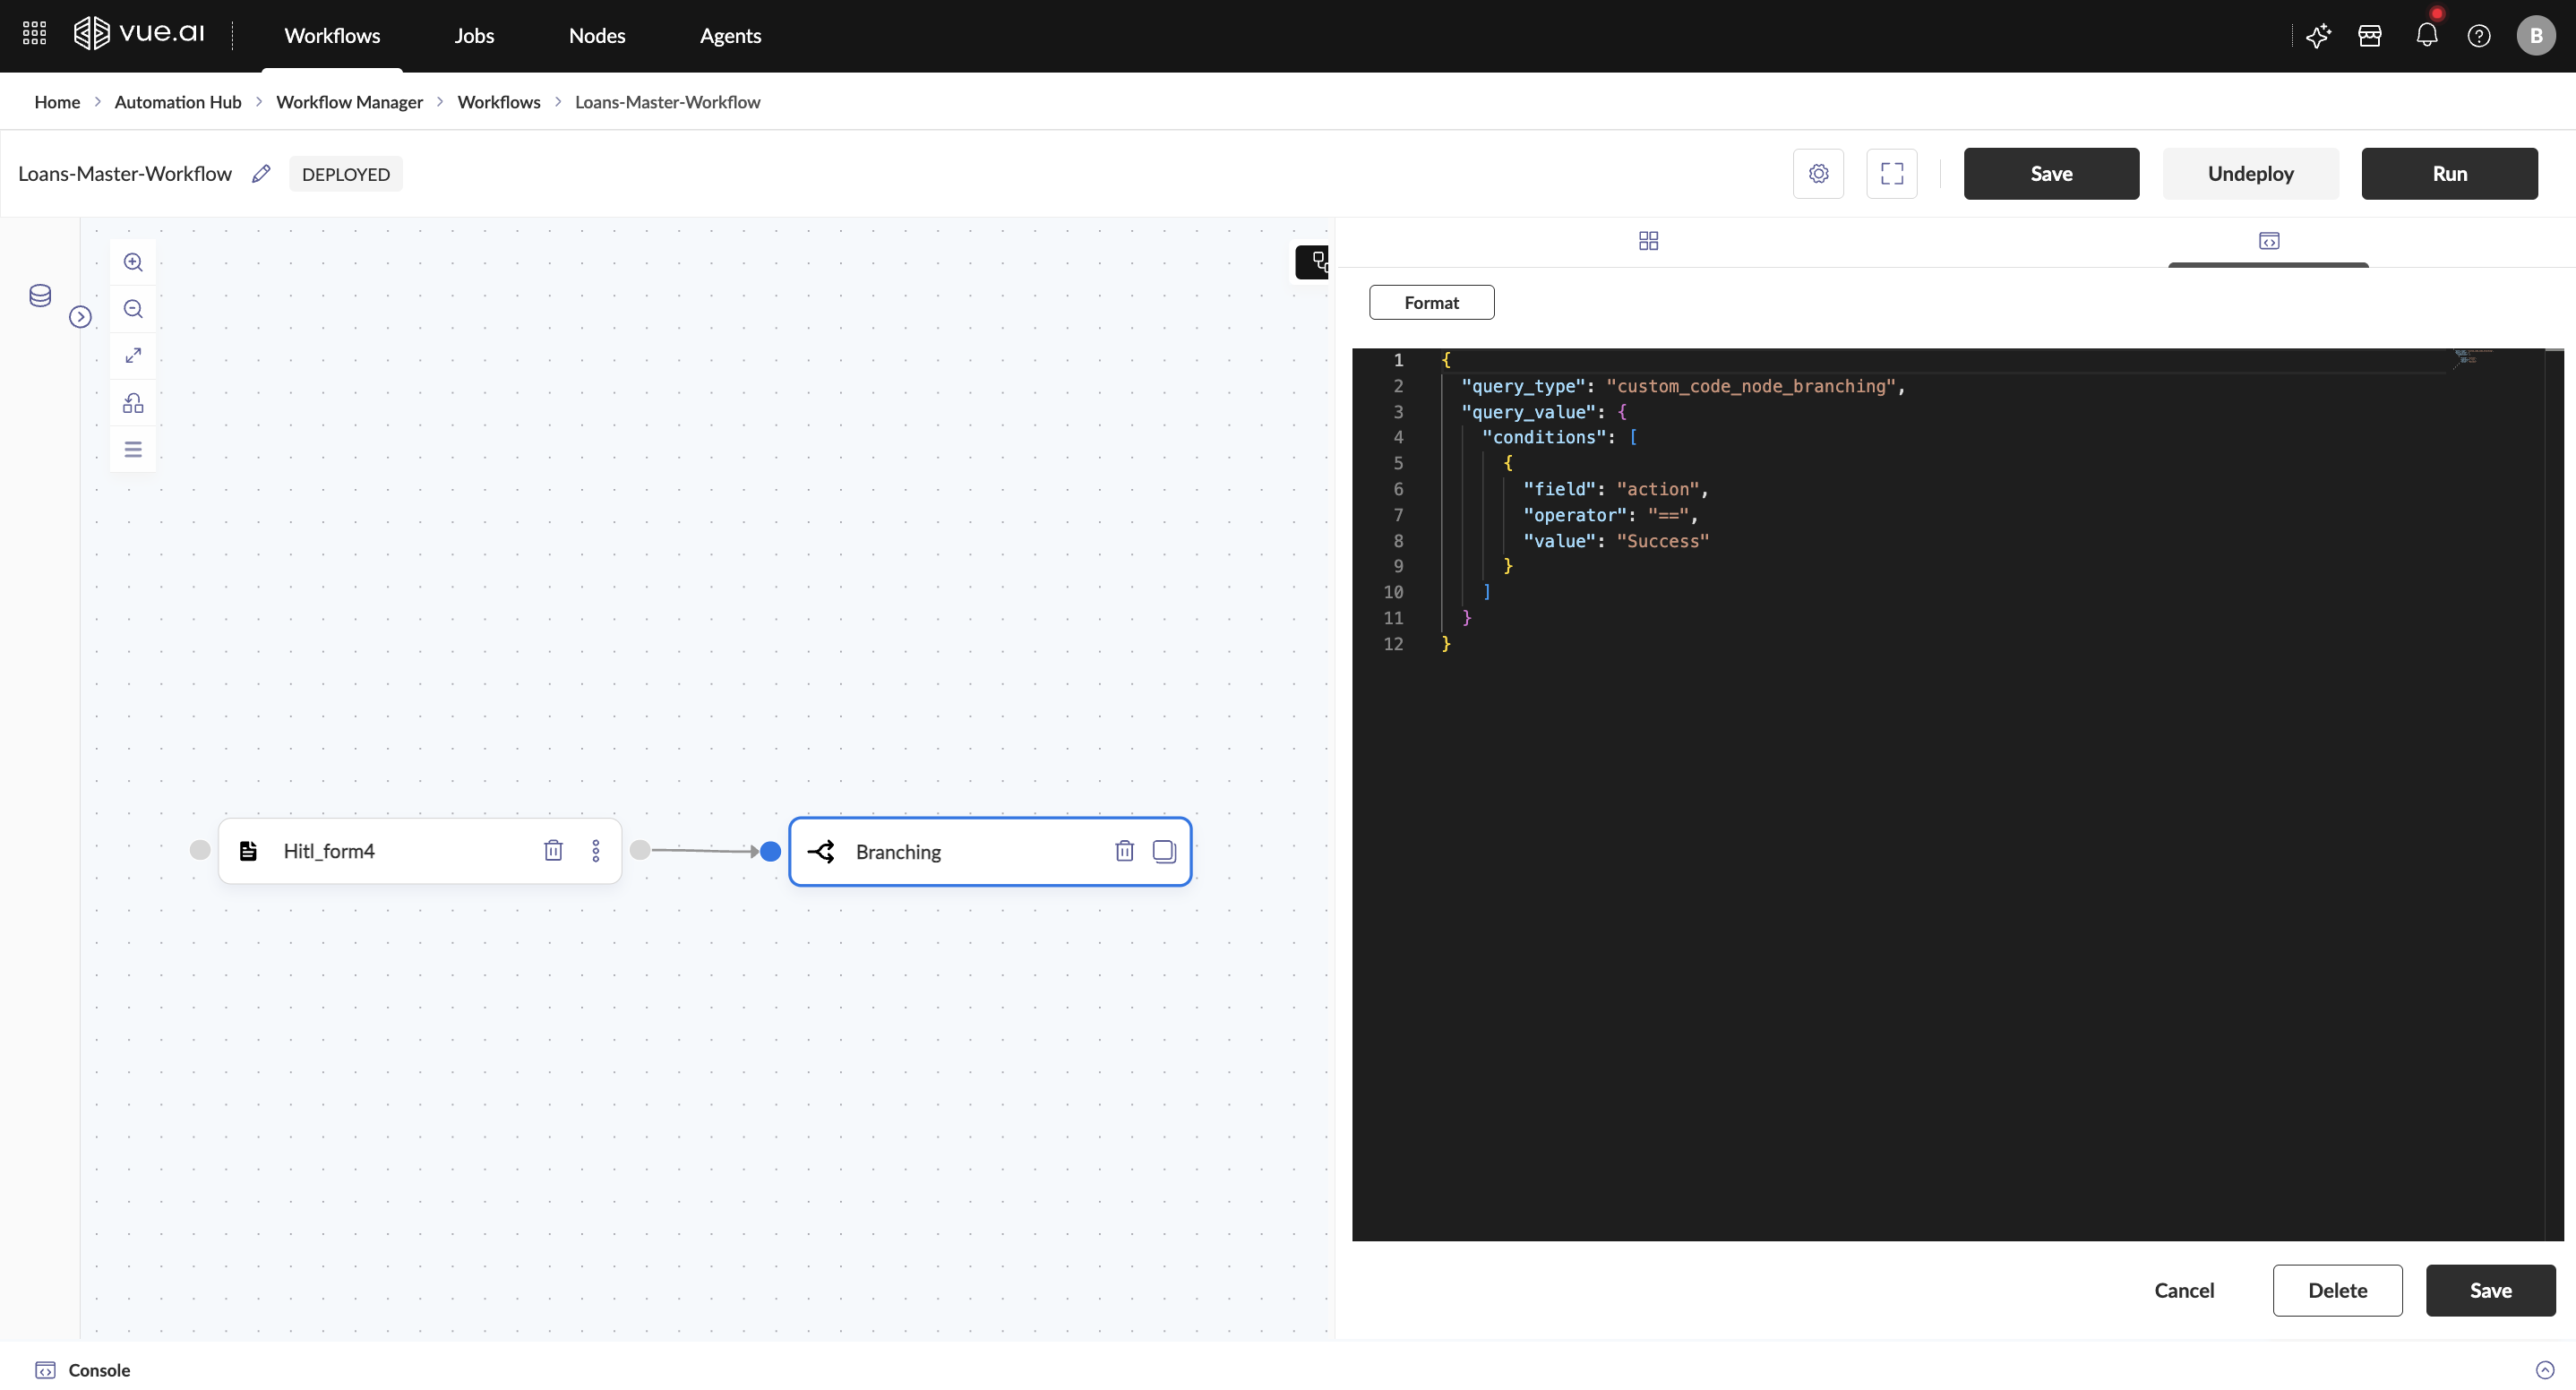
Field and Value Format Requirements Based on the Preceding Node
HITL Node
- If the HITL Node has an input with the label
action, it should be referenced in the Branching Node using{{data.0.action}}as the field.
- If the HITL Node has an input with the label
Custom Code Node
- If the Custom Code Node returns a dictionary with a key like
{"action": "Success"}, this can be referenced in the same way as{{data.0.action}}to be used as field.
- If the Custom Code Node returns a dictionary with a key like
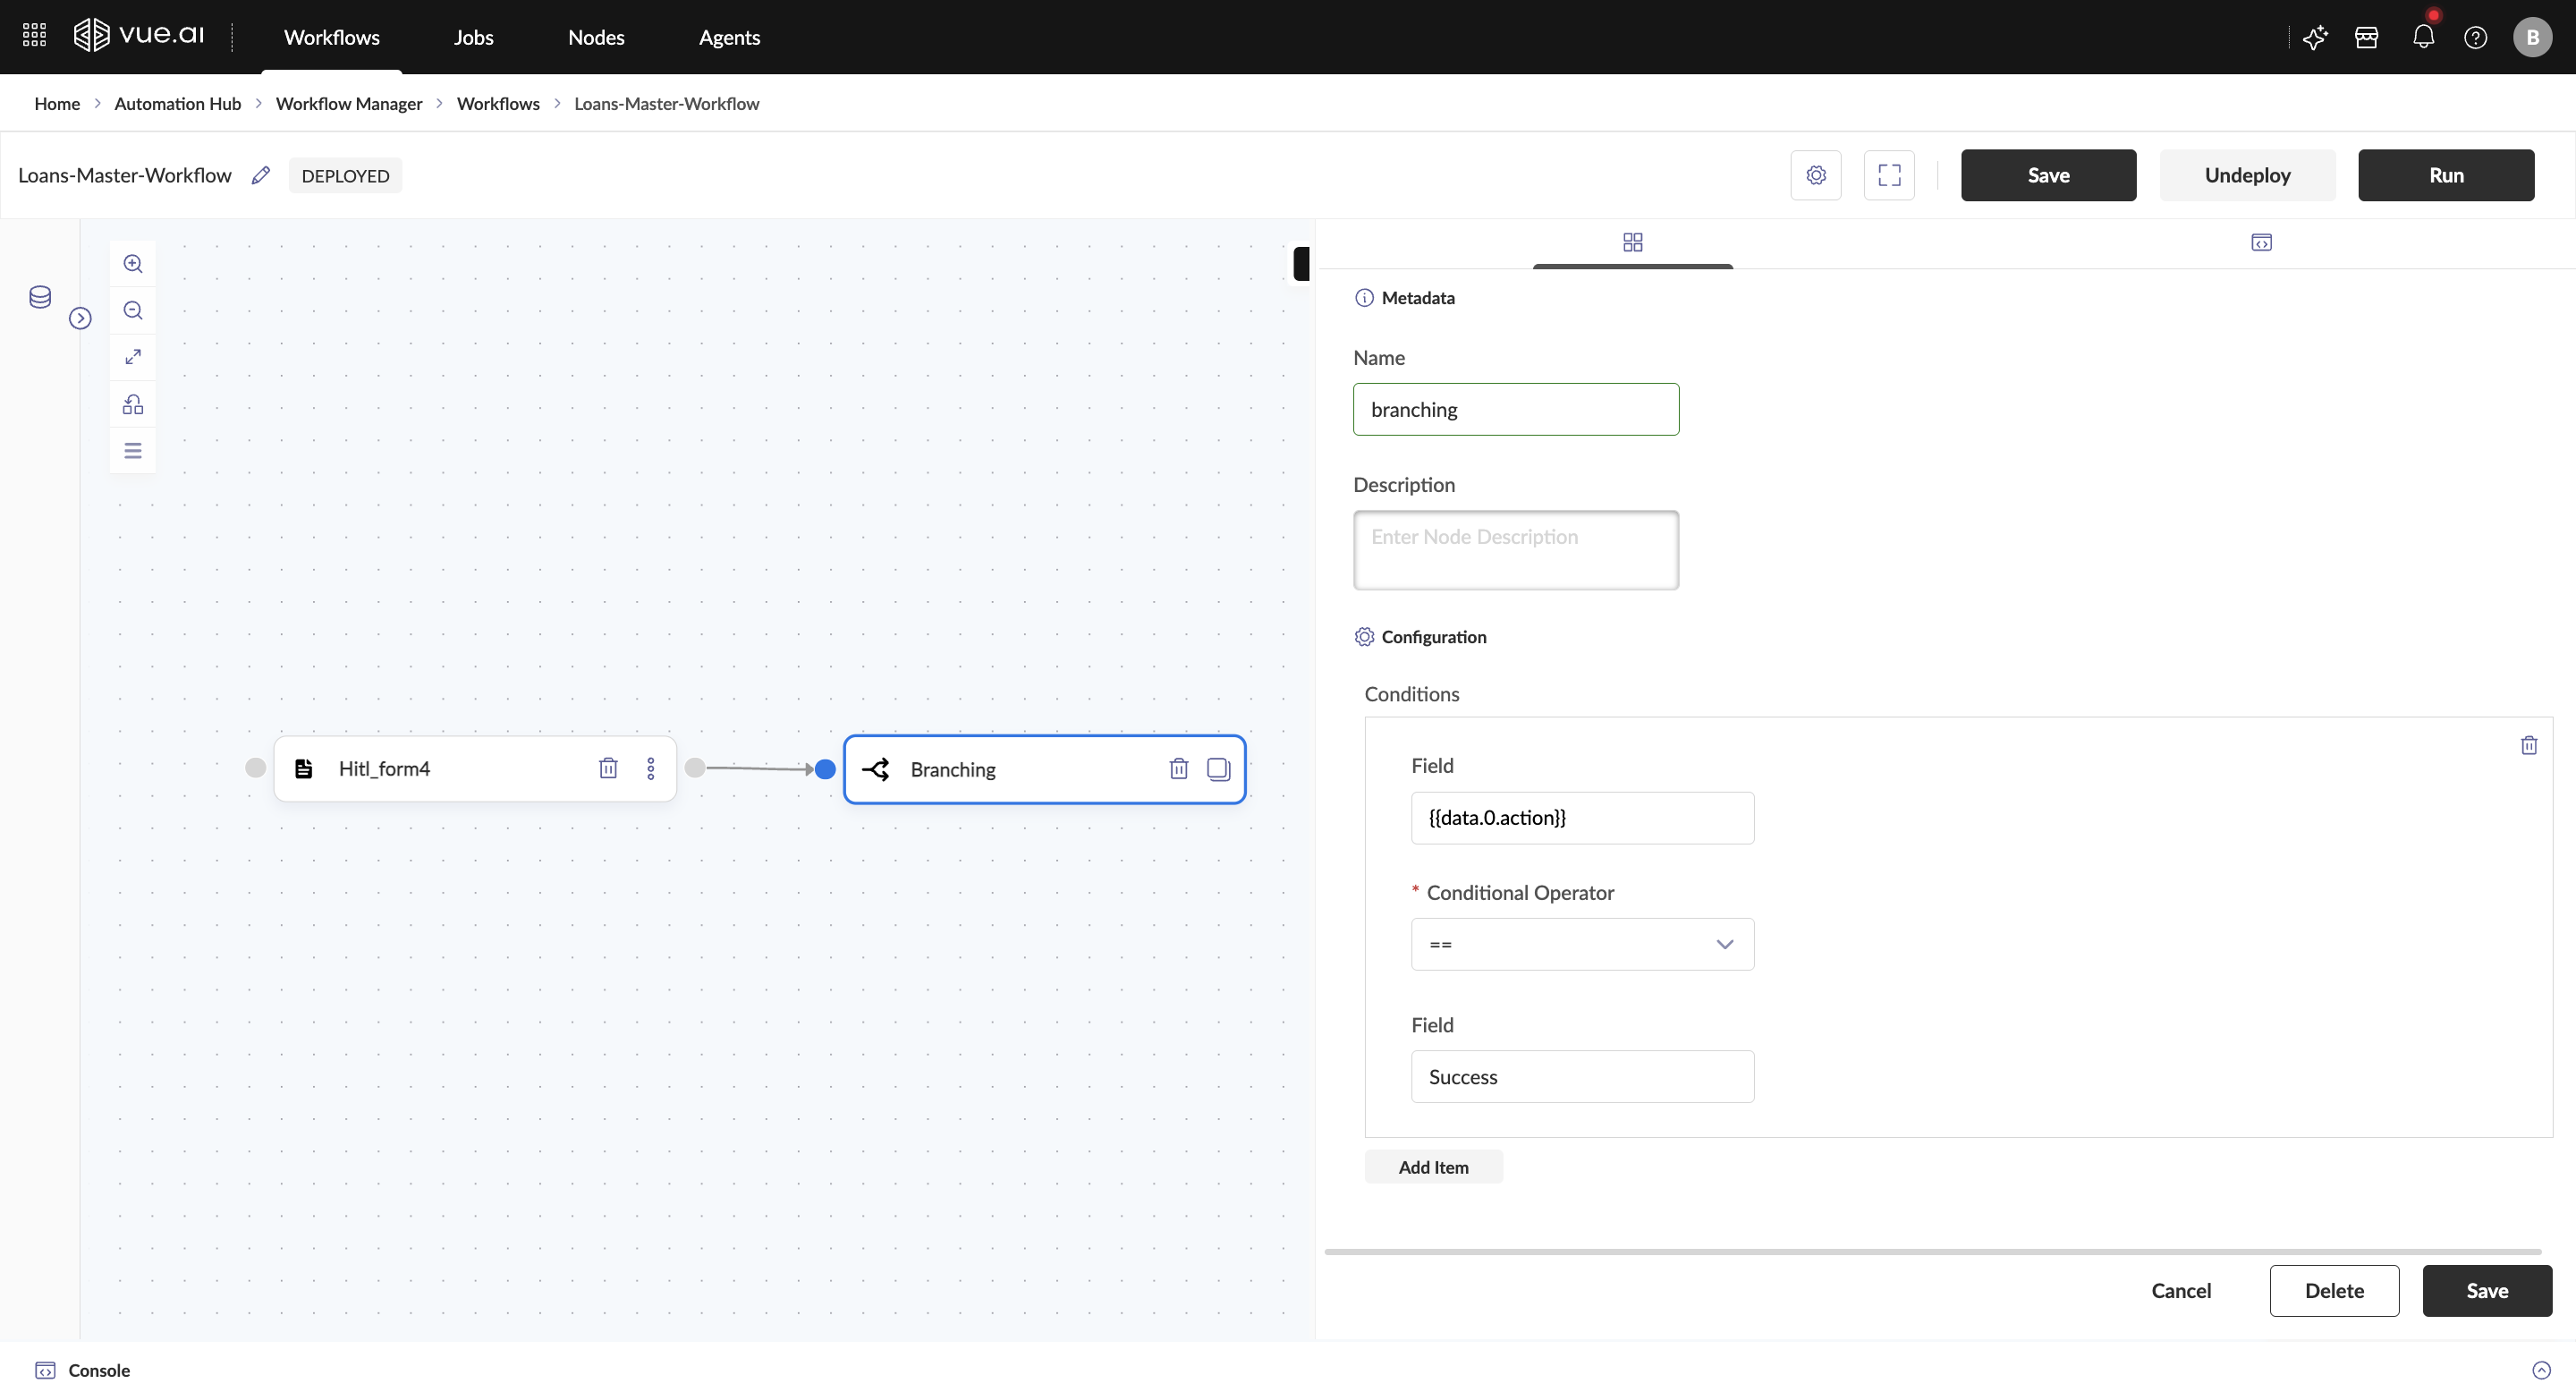
Defining Multiple Conditions (if-elif-else Logic)
Multiple conditions can be added, and these will be evaluated sequentially:
- The first condition that matches will execute its corresponding action.
- If it does not match, the next condition will be checked, and so on.
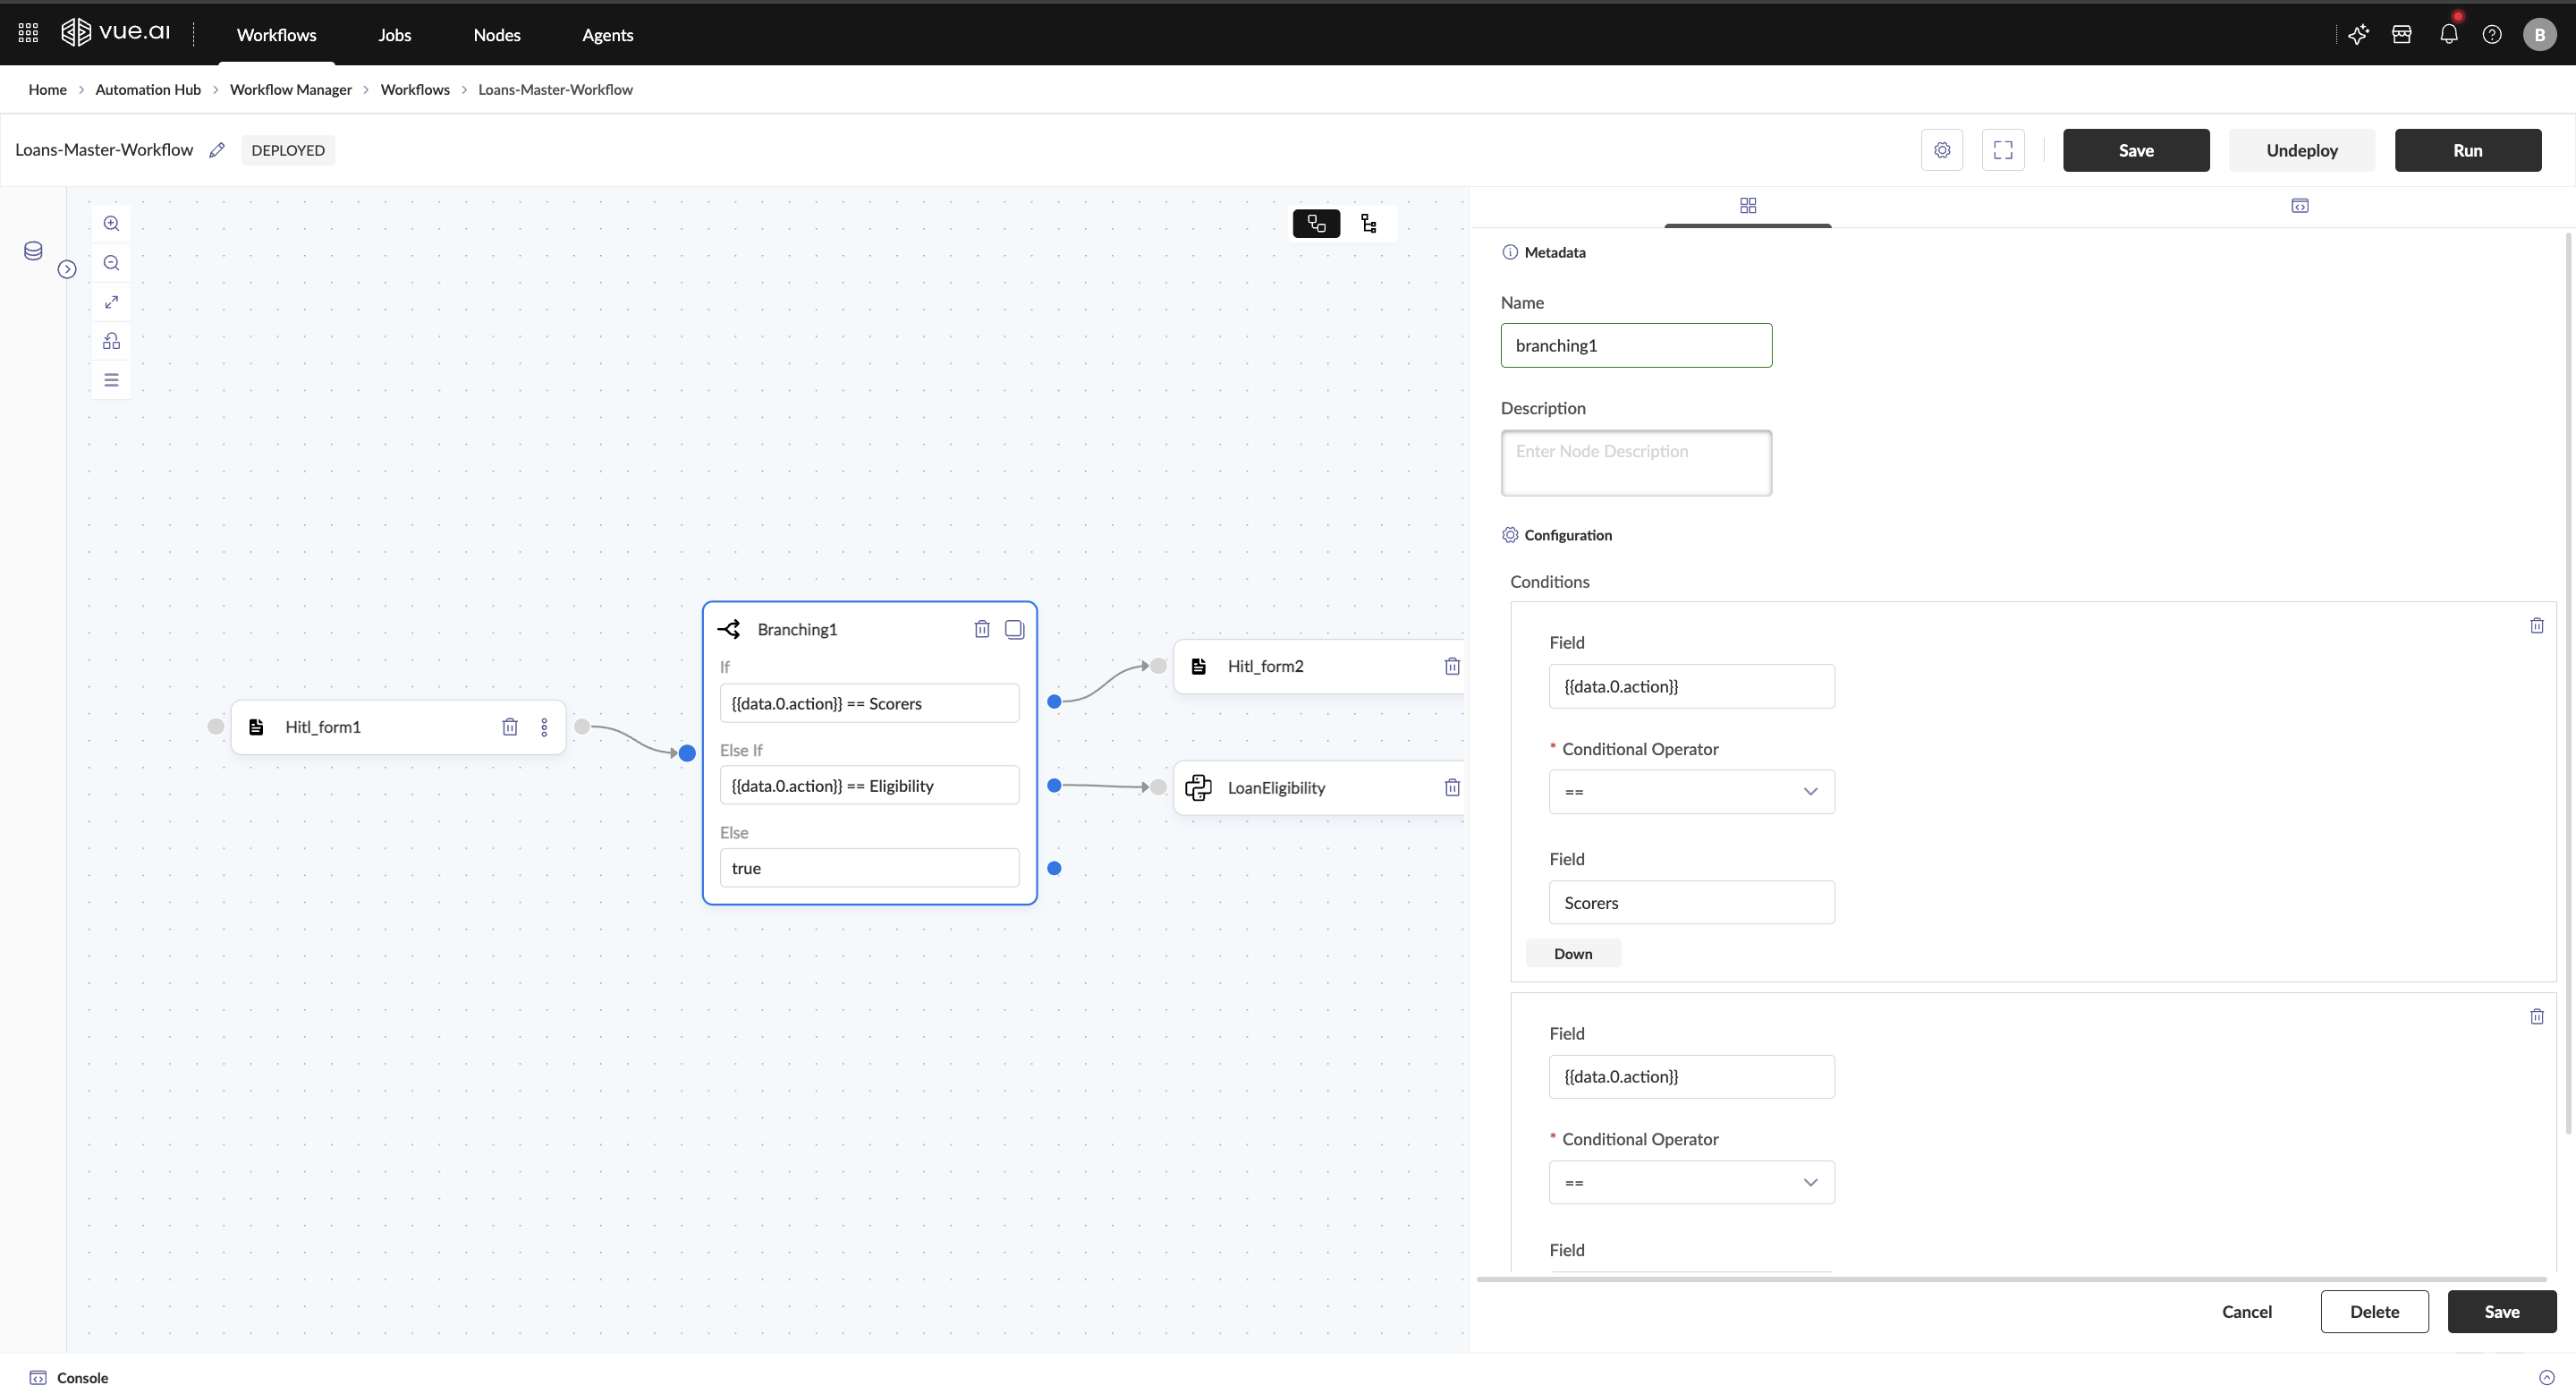
Connecting Subsequent Nodes
For each condition added in the Branching Node, connect the corresponding endpoint to the next required node, which could be a Custom Code Node or other preset nodes. The workflow will dynamically follow the designated path based on the evaluated condition, ensuring smooth execution.
Make sure that every condition, including the else clause, is linked to a successor node to ensure proper execution.
Troubleshooting
Workflow Failure in the Branching Node
Possible Cause: The specified field name in the Branching Node conditions might be incorrect. Solution:
- Verify that the condition logic and input field name match the output key from the preceding node.
- Confirm the data format is structured as expected.
Unexpected Execution Path in the Branching Node
Possible Cause: An incorrect comparison operator or mismatched value may have been used. Solution:
- Validate that the specified value is accurate and the appropriate comparison operator is applied, or it will default to the else clause of the branching node.
Additional Information
Branching Node Permissions
- Ensure that the appropriate users have access to review and modify Branching Node Conditions.
- Workflow administrators may need to configure permissions based on business requirements.
Best Practices for Using Branching Node Use Descriptive Field Names: When configuring conditions, ensure that the field names are clear and align with the output from preceding nodes. Optimize Condition Order: Arrange conditions in a logical sequence to minimize unnecessary evaluations and improve workflow efficiency.
FAQ
Can multiple conditions be defined in the Branching Node?
Yes, the Branching Node allows multiple conditions, which are evaluated sequentially in an if-elif-else manner.
Can the Branching Node have multiple active paths?
No, the Branching Node follows a single execution path at a time. Conditions are evaluated in sequence, and once a matching condition is found, the corresponding path is taken while the others are ignored.
Which node types can be connected after a Branching Node?
The Branching Node can be followed by any node type, including Custom Code Nodes, HITL Nodes, and other preset nodes.
Summary
This guide covered the functionality of the Branching Node in Vue.ai workflows, including its role in decision-making based on the defined conditions. It explained how to configure conditions, connect preceding and subsequent nodes, and troubleshoot common issues.
Trigger Node
Welcome to the Trigger Node guide! This guide will assist users in understanding the Trigger Node, its functionality, and how it enables seamless workflow execution within the Vue.ai platform.
Expected Outcome By the end of this guide, you will have a clear understanding of the Trigger Node, its role in automating workflows, and how it facilitates workflow transitions within the Vue.ai platform.
Overview
The Trigger Node in the Vue.ai platform enables seamless workflow automation by initiating a new workflow from an existing one without relying on specific conditions or events. It allows users to link workflows together, ensuring smooth transitions and eliminating the need for manual intervention. By automating workflow execution, the Trigger Node enhances efficiency, scalability, and flexibility, making it easier to manage complex processes while reducing repetitive tasks.
Prerequisites For a better understanding of workflows, it is recommended to review the Getting Started with Workflows documentation.
Navigation To begin, the following path should be navigated: Home/Landing Page → Automation Hub → Workflow Manager → Workflows → New Workflow
Step-by-Step Instructions
- Build Your Workflow – Start by adding the required code nodes to construct your workflow.
- Add the Trigger Node – Drag and drop the Trigger Node into your workflow and connect it to the node from which you want to trigger another workflow.
- Multiple trigger nodes can be added in a workflow.
- Configure the Trigger Node – In the Trigger Node panel, select the workflow that should be triggered. You can also choose whether to enable the "Wait Till Job Completes" option:
- Enabled – The current workflow will pause until the triggered workflow finishes execution.
- Disabled – The current workflow will continue running without waiting for the triggered workflow to complete.
- Save and Deploy – Click the Save button and deploy your workflow.
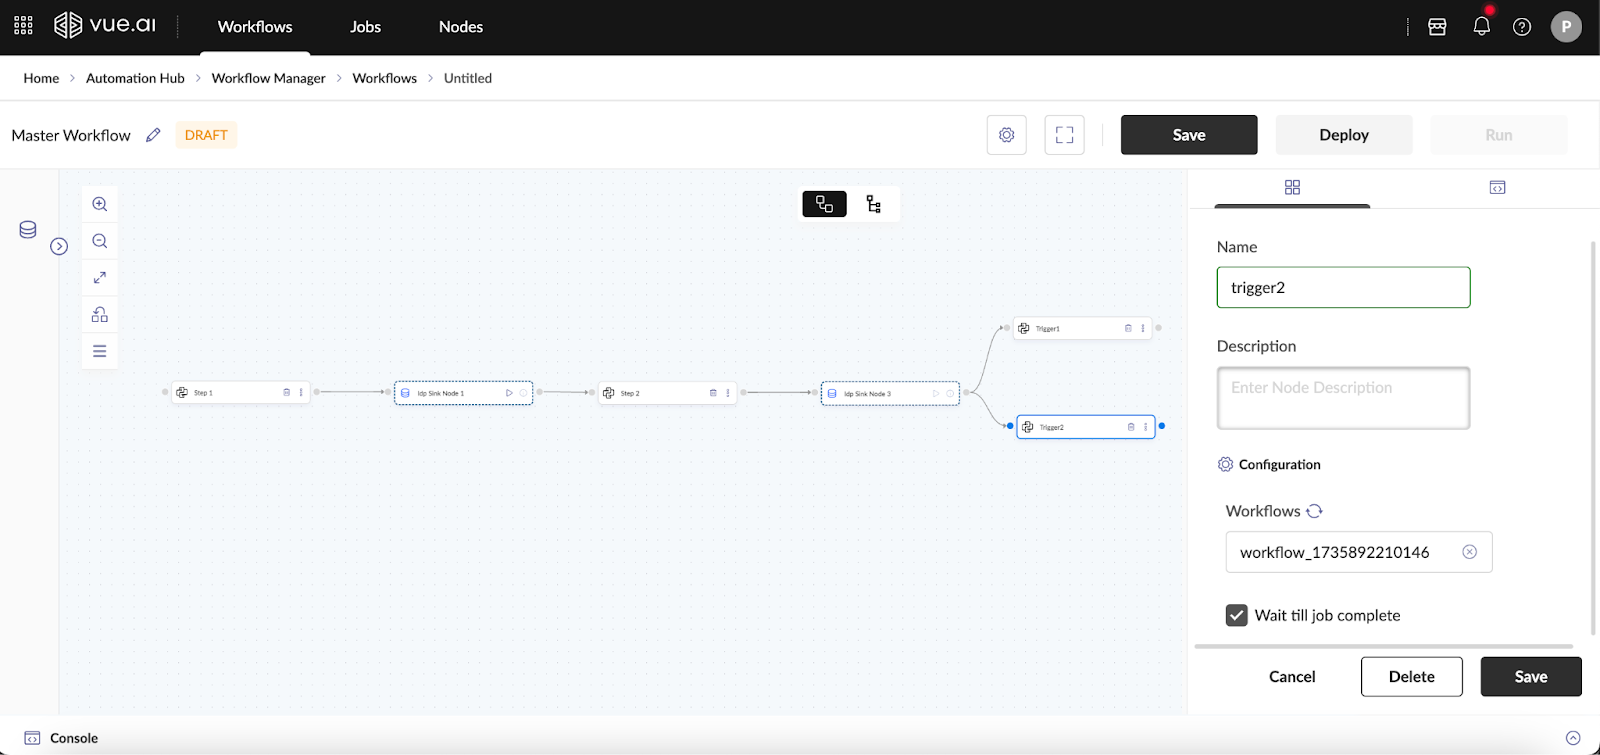

Troubleshooting
Common Issues and Solutions
- Problem 1: If your workflow doesn't show up in the trigger workflow listing panel
- Solution: Click on the refresh button to ensure the latest workflows show up there.
- Problem 2: Trigger node is in progress for a long time
- Solution: Ensure the workflow that needs to be triggered is deployed.
Additional Information
Note:
- The workflow being triggered must also be deployed for successful execution.
- Speed Run doesn't work in workflows where trigger nodes are involved.
FAQ
- Can multiple Trigger nodes be attached to a single code node?
- Yes, multiple trigger nodes can be present in a workflow and also attached to a single code node.
- Do Trigger nodes work in Speed Run?
- No, the workflow has to be deployed for it to work.
- Can Trigger node be used along with any custom code node?
- Yes, it is possible to use it with a custom code node.
Summary
This guide covered the following:
- Clear understanding of the Trigger Node.
- How to build workflows using Trigger Node.
ML/DS Nodes
Machine Learning and Data Science nodes provide automated model training, inference, and data preprocessing capabilities.
AutoML - Data Preprocessor
Welcome to the AutoML - Data Preprocessor guide! This guide will assist users in understanding the features and benefits of the AutoML - Data Preprocessor node and learning how to set up and use the node effectively.
Who is this guide for? This guide is designed for users who are working with custom AutoML - Data Preprocessors in a workflow.
Ensure access to a registered dataset and a basic understanding of data preprocessing for ML models.
Overview
The AutoML - Data Preprocessor node refines input data by handling missing values, encoding categorical variables, scaling numerical features, and applying necessary transformations to optimize model performance. The node:
- Converts raw data into a structured Pandas DataFrame.
- Outputs the processed DataFrame for seamless integration with custom Model Training Nodes.
Prerequisites Before beginning, the following are required:
- A registered dataset for processing.
- A custom AutoML - Data Preprocessor in the workflow that requires a Pandas DataFrame as input.
- Knowledge of Data Preprocessing for ML models
Adding AutoML - Data Preprocessor to the Workflow
Two methods can be followed to add a AutoML - Data Preprocessor:
Drag and Drop Method
- The node is selected from the left pane.
- It is then dragged onto the workflow canvas.
Right-Click Method
- The canvas is right-clicked.
- The node is selected from the context menu.
- It is then placed on the canvas.
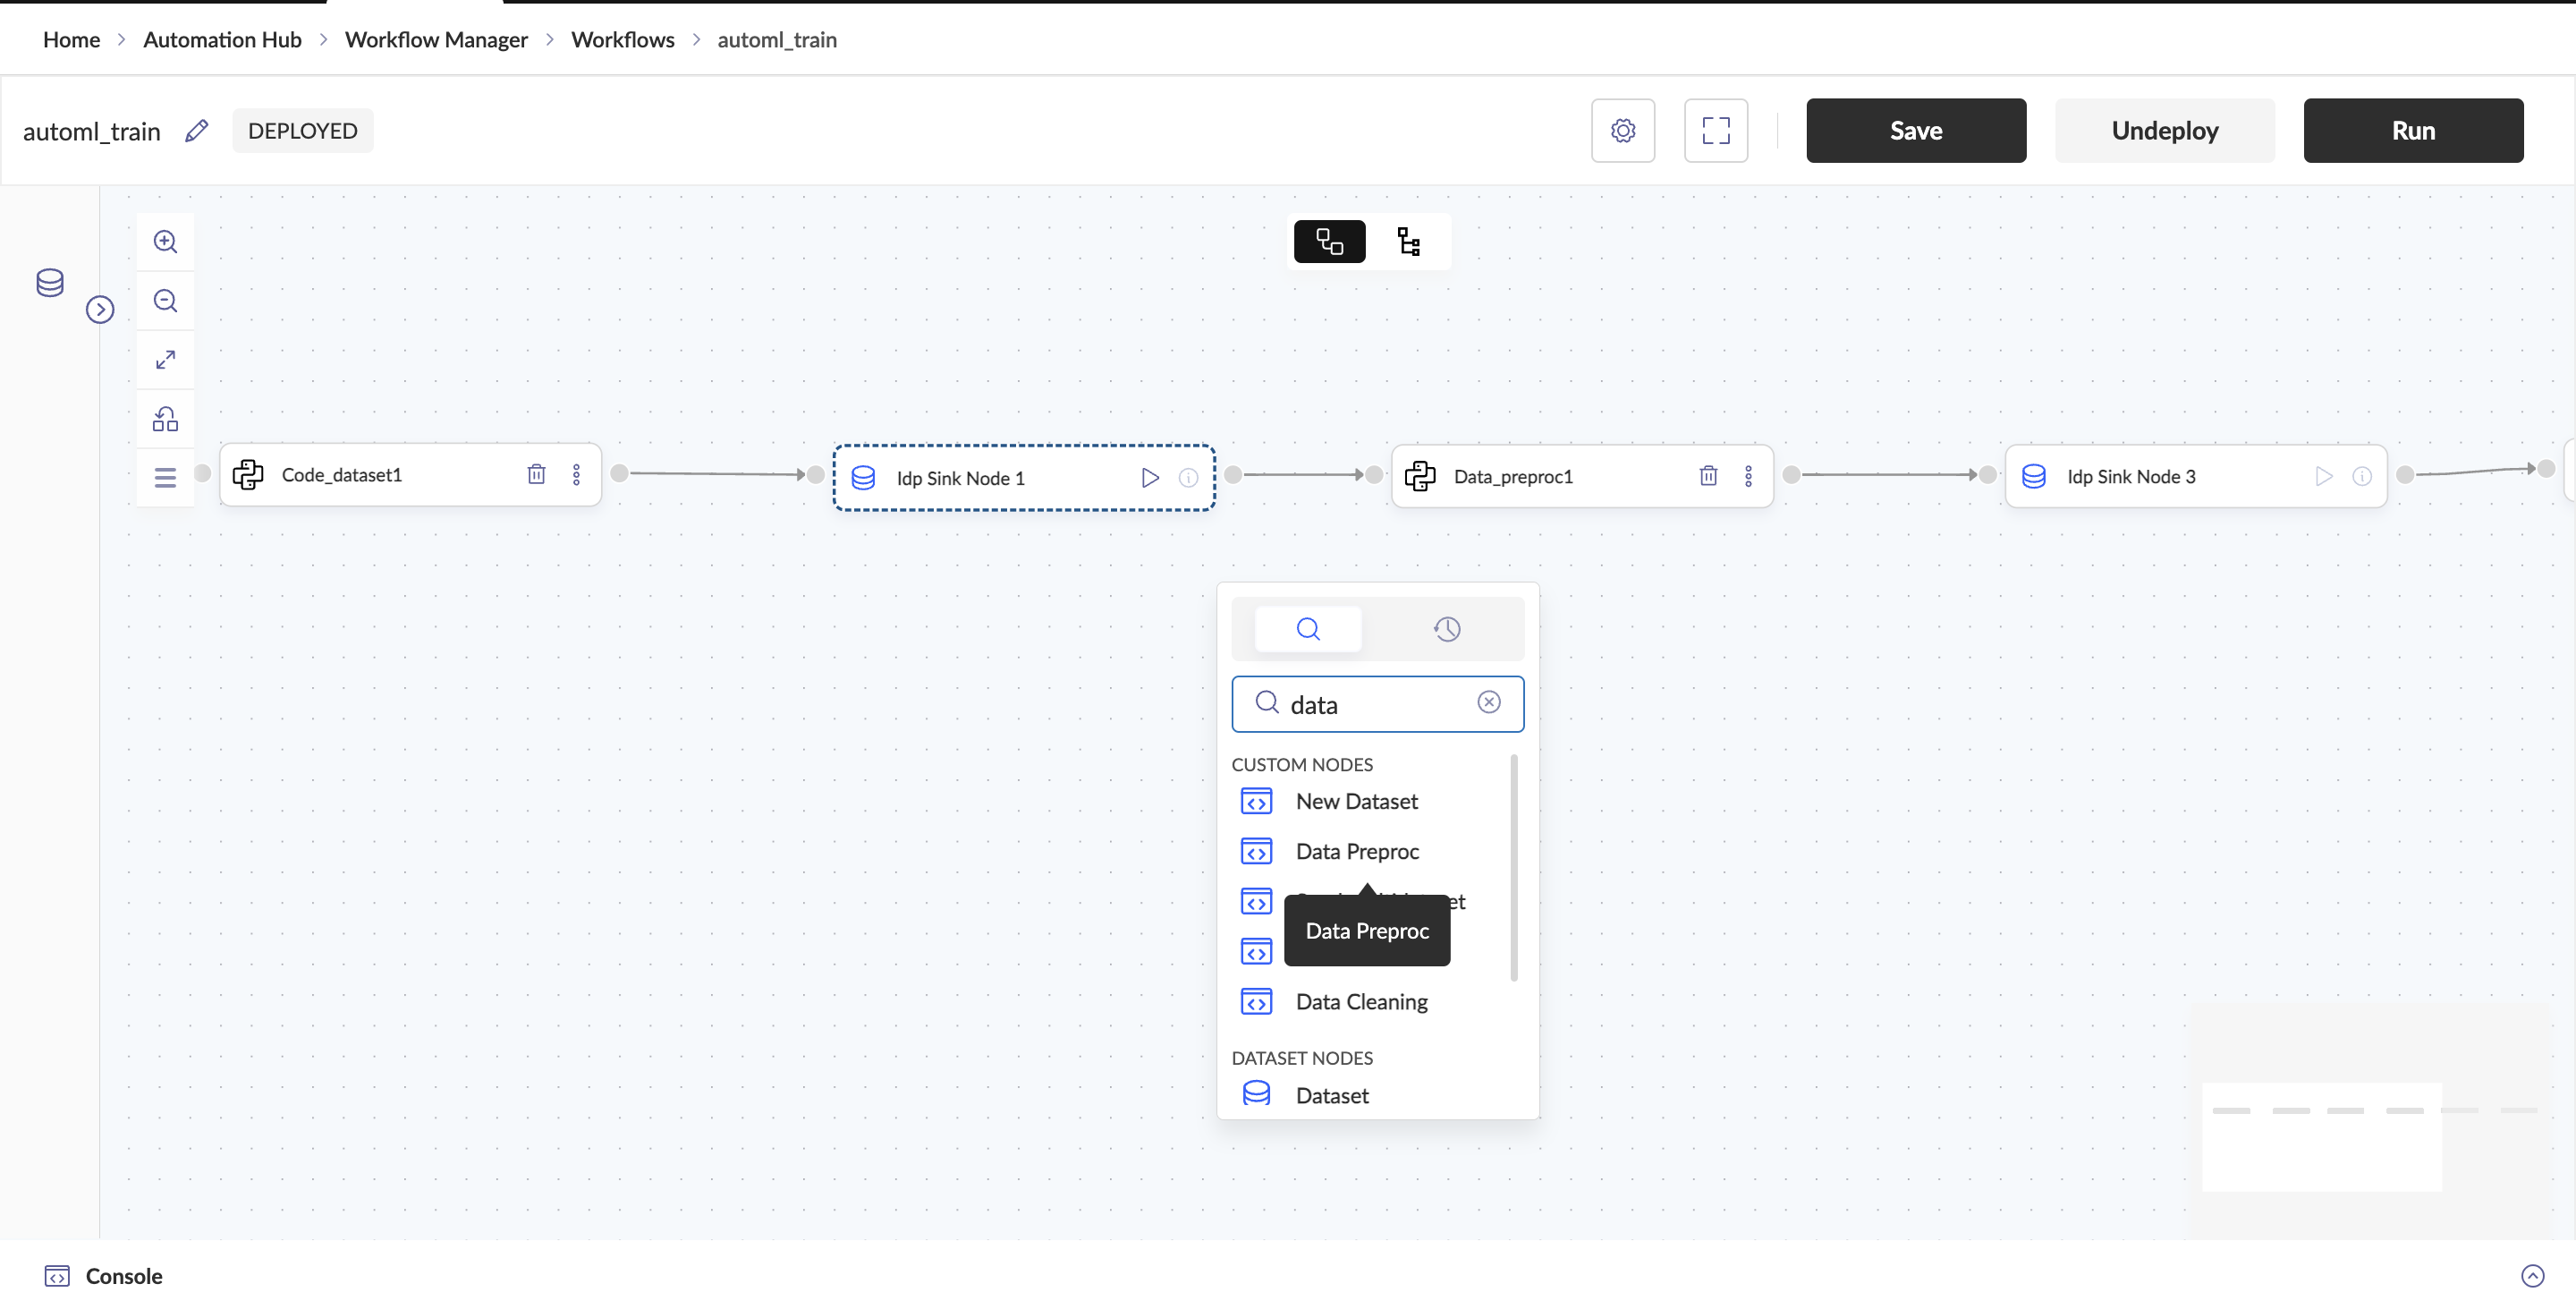
Configuring the AutoML - Data Preprocessor
Once the node is added, it can be configured with the following parameters:
Name
- A unique name is entered (must be under 18 characters).
Description
- Optionally, a description is provided for clarity.
ignore_columns_for_training
- Specifies columns that should be excluded from training the machine learning model. These might include identifiers, metadata, or features not relevant to the prediction task.
fit_numerical_to_categorical
- Lists numerical columns that should be treated as categorical features. This is useful when certain numbers represent categories rather than continuous values.
preproc_steps Defines a sequence of preprocessing steps applied to the dataset before model training. Each step includes:
Step Attributes
- step - The type of preprocessing (e.g., imputation, encoding, scaling, handling skewness, or managing outliers).
- method - The specific approach used for the selected preprocessing step.
- columns_to_include - Specifies which columns the preprocessing step should be applied to.
Step Options:
Step Method Description Impute meanReplaces missing values with the mean of the column. medianReplaces missing values with the median of the column. modeReplaces missing values with the most frequently occurring value in the column. Encode labelAssigns a unique integer to each category. Suitable for ordinal categorical variables. one_hotCreates binary columns for each category, representing presence (1) or absence (0). Ideal for nominal categorical data. Scale standardTransforms data to have a mean of 0 and a standard deviation of 1, useful for models sensitive to scale. min_maxRescales data to a fixed range, typically [0,1], preserving relative distances between values. Skew yeo_johnsonHandles both positive and negative skewness without requiring non-negative values. cube_rootApplies the cube root transformation, reducing right-skewed distributions. exponentialRaises values to an exponent, which can be used to compress large values. absoluteConverts all values to their absolute form, reducing the impact of negative values. squareSquares the values, amplifying larger values and potentially reducing left-skewed distributions. Outlier handleModifies outliers, such as capping extreme values to a predefined threshold. dropRemoves rows containing outliers, ensuring they do not influence model training. persist
- A boolean which indicates whether the processed pipeline and steps should be saved for reuse, ensuring consistency during model inference.
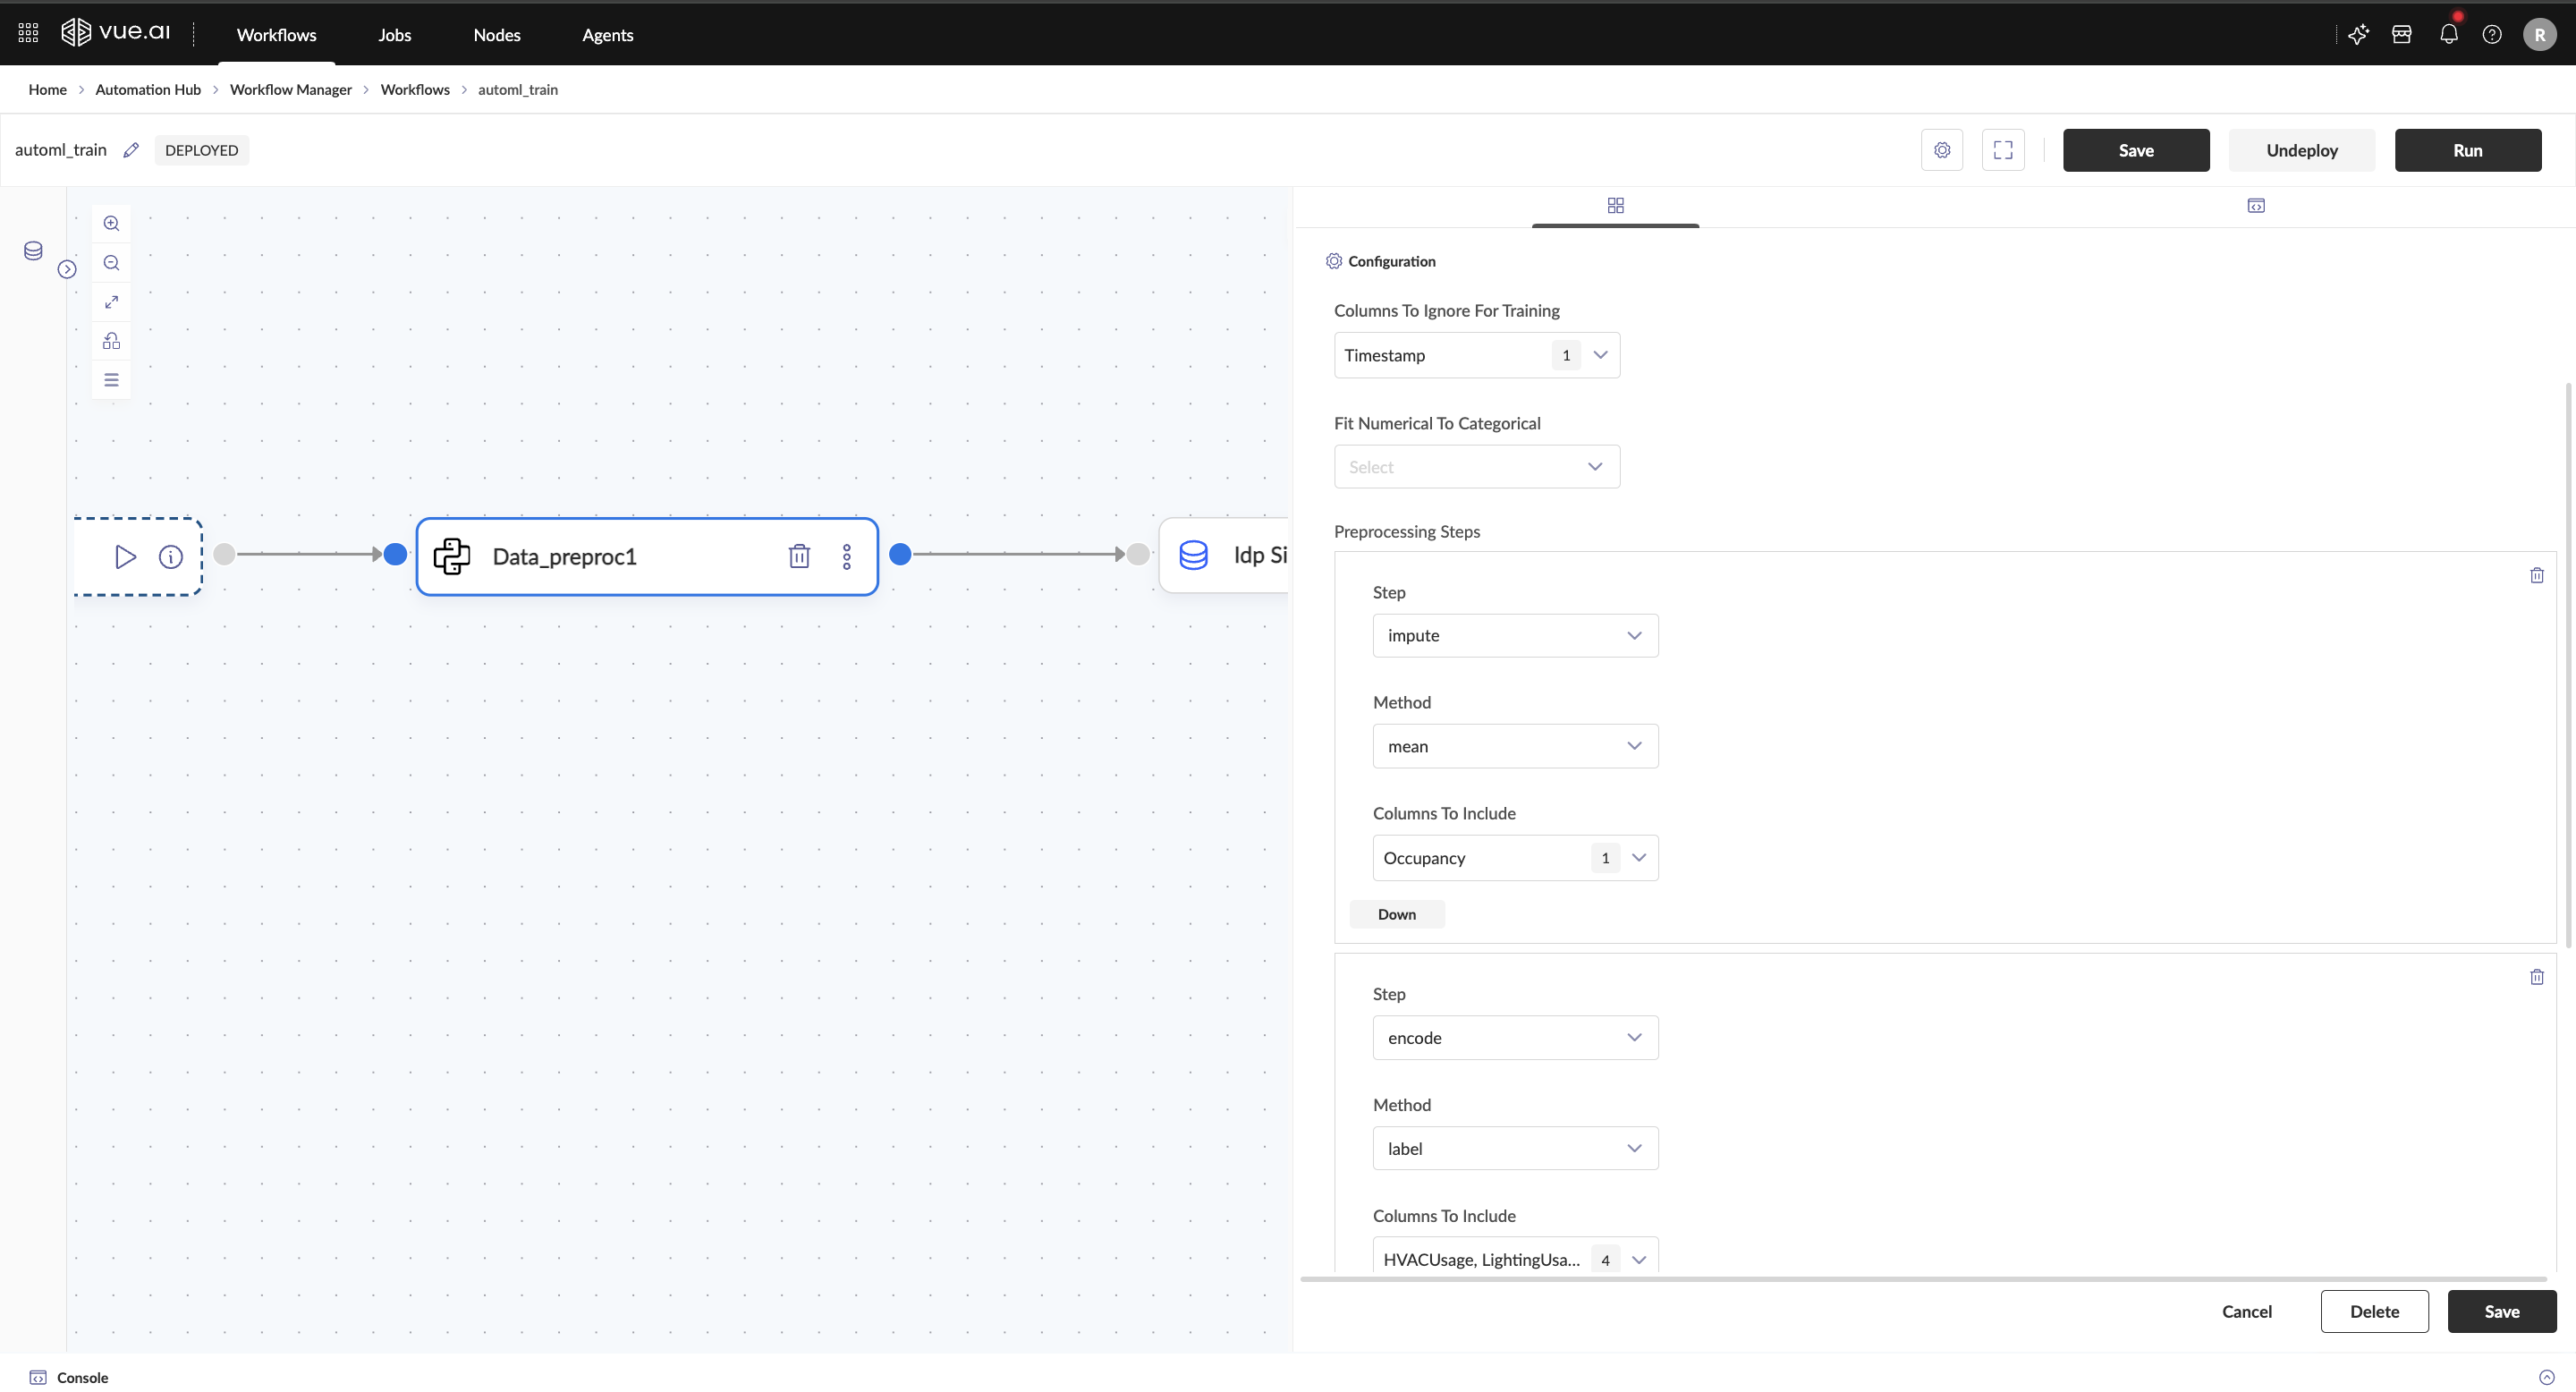
Output
If persist is enabled:
pipeline_path– File path where the trained model pipeline is saved for future use.preproc_config_path– Path storing preprocessing settings to maintain consistency in data transformation.processed_data– The dataset after preprocessing, prepared for training or inference.
If persist is not enabled:
processed_data– The dataset after preprocessing, prepared for training or inference.
Avoid including target variable in data preprocessing steps
Best Practice of using AutoML Nodes: Vue.ai provides two approaches for AutoML training and inference:
Case 1: Standard Workflow
- Training: Use Vue.ai's built-in data preprocessing and AutoML trainer.
- Inference:
- Generate predictions using Vue.ai's AutoML inference code.
- Store the results as a dataset and load them into a notebook via the SDK for further analysis.
Case 2: Custom Workflow
- Training: Perform custom data preprocessing before training with Vue.ai's AutoML trainer.
- Inference:
- Develop custom inference code.
- Ensure test data undergoes the same preprocessing steps as the training data.
Troubleshooting
Common Issues and Solutions
Problem 1: The dataset is not recognized Cause: The dataset may not be correctly registered in the system. Solution: Ensure that the dataset is correctly registered in the system.
Problem 2: If different preprocessing steps are applied to overlapping column sets without clear rules, it can lead to unintended feature transformations Cause: Inconsistent Column Selection in preprocessing steps. Solution: Carefully choose columns during preprocessing.
Additional Information
The AutoML - Data Preprocessor node aids in structuring data for workflows involving machine learning, data preprocessing, and analysis. It eliminates the need for manual data conversion, making workflows more efficient.
All preprocessing steps, such as handling missing values, encoding categorical variables, and scaling numerical features, are performed on the entire dataset before it is split into training and testing sets. This ensures consistency in feature transformations and prevents data leakage.
FAQ
Can multiple datasets be used as input to AutoML - Data Preprocessor node?
No, each AutoML - Data Preprocessor node processes only one dataset at a time. Multiple nodes can be used if multiple datasets need to be handled.
What if the dataset is too large?
Consider using data sampling to test the workflow in speed run and deploy run the workflows to handle large datasets.
Summary
The Data Preprocessing Node in machine learning transforms raw data into a structured format by handling missing values (imputation), encoding categorical variables, scaling numerical features, correcting skewness, and managing outliers. It also excludes irrelevant columns and ensures consistency in data processing. These steps improve model performance by enhancing data quality, reducing bias, and preventing inconsistencies in training and evaluation.
AutoML - Model Trainer
Welcome to the AutoML Trainer Node guide! This guide will help users understand the features and benefits of the AutoML Trainer Node, learn how to set up and use the node effectively for training models. Vue provides two preset Model Trainer Nodes: one for Regression models and another for Classification models. Additionally, Vue provides tailored traditional regression and classification models as distinct presets.
Who is this guide for? This guide is intended for users integrating an AutoML Trainer Node within a workflow to automate machine learning model training.
Ensure access to a preprocessed dataset and a basic understanding of model training techniques for optimal results.
Overview
The AutoML Trainer Node streamlines model training by selecting the best algorithm, tuning hyperparameters, and optimizing performance based on input data. The node:
- Automates model selection and hyperparameter tuning.
- Trains multiple models and selects the best-performing one.
- Optionally logs the trained model, metrics, and artifacts to MLflow for streamlined tracking and further evaluation.
Prerequisites
Before using the AutoML Trainer Node, ensure the following:
- A preprocessed dataset formatted as a Pandas DataFrame.
- An AutoML Trainer Node integrated into the workflow for automated model training.
- Basic knowledge of various machine learning models, techniques, and evaluation metrics.
Adding AutoML Model Trainer to the Workflow
Two methods can be followed to add a AutoML Model Trainer:
Drag and Drop Method
- The node is selected from the left pane.
- It is then dragged onto the workflow canvas.
Right-Click Method
- The canvas is right-clicked.
- The node is selected from the context menu.
- It is then placed on the canvas.
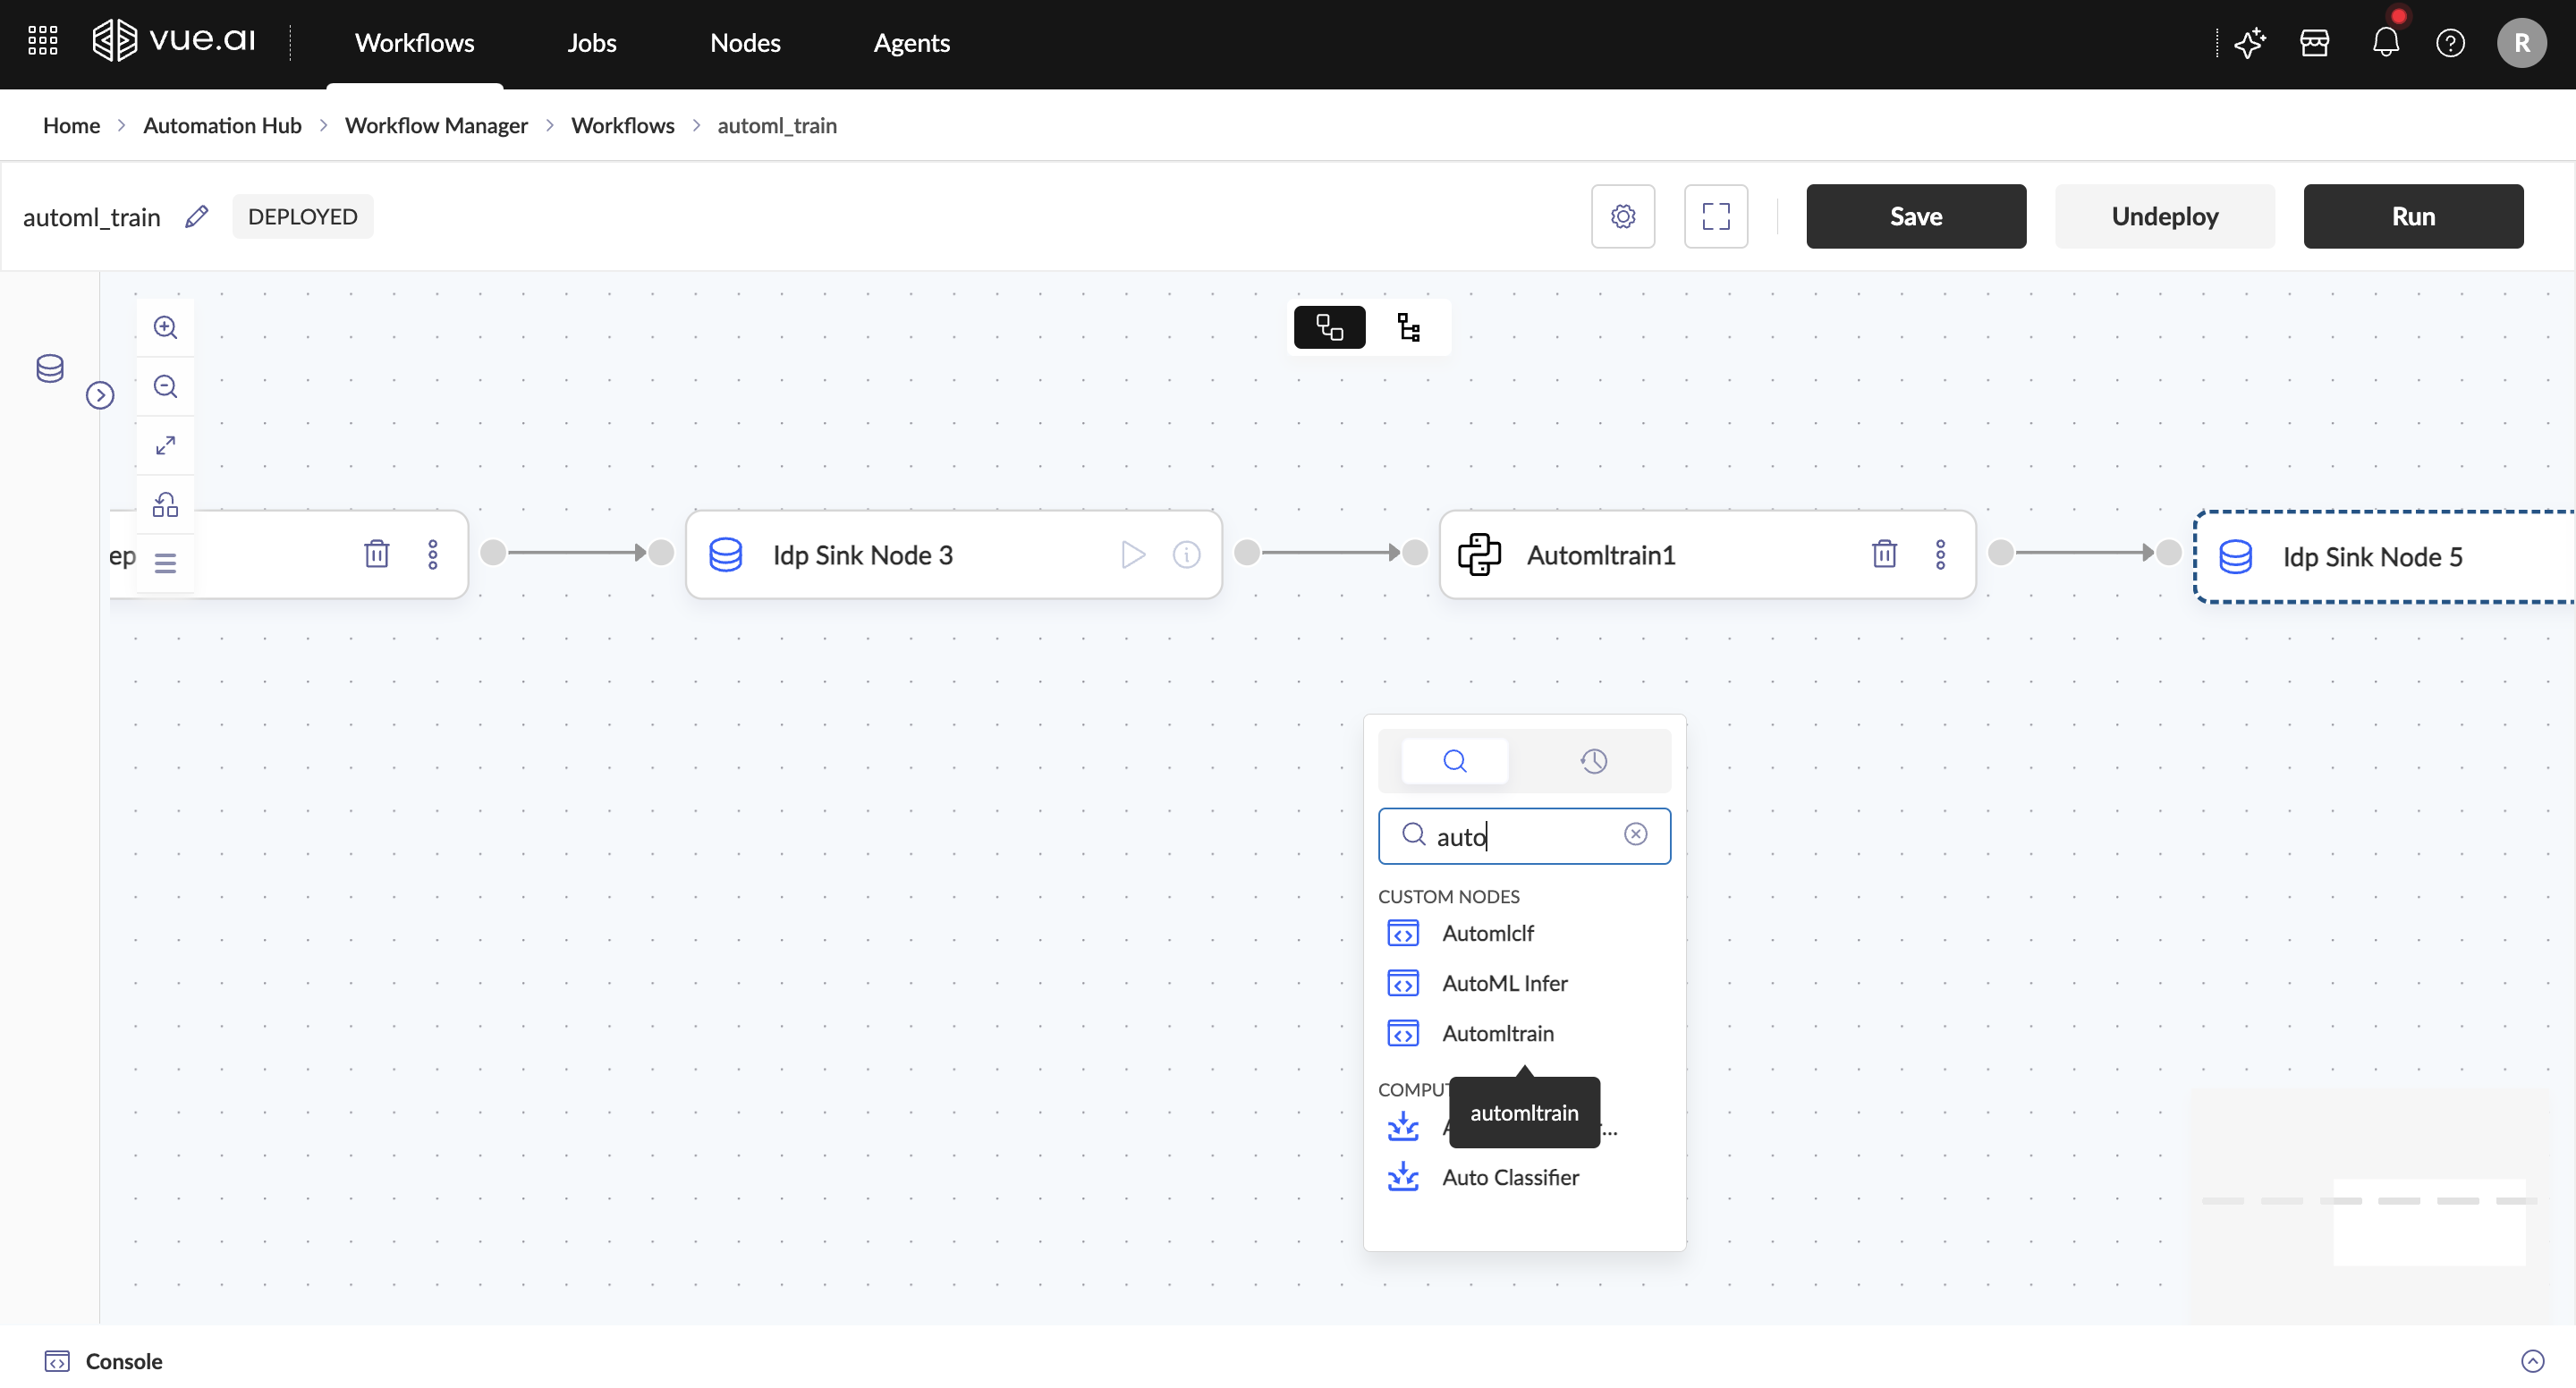
Input Requirements This node supports the following types of datasets:
- Fully Processed Datasets: These are preprocessed datasets that are ready for model training. You can preprocess datasets in Jupyter Notebooks available within the Developer Hub.
- Refer to Vue.ai Notebooks User Guide for more information on Notebooks.
- Raw Datasets: These datasets require preprocessing, which can be handled directly within the workflow using available preprocessing nodes.
Configuring the AutoML Model Trainer
Once the node is added, it can be configured with the following parameters:
| Parameter | Description | Default & Accepted Values |
|---|---|---|
| Name | A unique name (must be under 18 characters). | None (String, max 18 chars) |
| Description | Optional description for clarity. | None (String) |
| Target Column | Specifies the dependent variable (output). | None (Column Name) |
| Include Features | Number of features to select (all for all). | all (Integer ≥1 or all) |
| Validation Split Size | Proportion of data used for validation. | 0.2 (Float between 0 and 1) |
| Number of CV Folds | Number of cross-validation folds. | None (Integer ≥2) |
| Ensemble | Use ensemble techniques to improve performance. | False (True or False) |
| Stacking | Enable stacking of multiple models. | False (True or False) |
| Tune | Perform hyperparameter tuning. | False (True or False) |
| Include Models | Models to be considered for training. | All available (List of models below) |
| Focus | Key evaluation metric for optimization.(See Below) | r2 (Regression) or accuracy (Classification) |
| Register Model | Register the trained model in MLflow. | False (True or False) |
| Experiment Name | Experiment name for tracking the model. | None (String) |
Include Models
Specifies the models to be considered during training.
Available Regression Models
Linear RegressionK-Nearest Neighbors RegressorLasso RegressionDecision Tree RegressorRandom Forest RegressorXGBoost RegressorSupport Vector RegressorStochastic Gradient Descent RegressorRidge RegressorMulti-Layer Perceptron RegressorPoisson RegressionElastic Net Regression
Available Classification Models
K-Nearest Neighbors ClassifierNaive Bayes ClassifierDecision Tree ClassifierRandom Forest ClassifierXGBoost ClassifierSupport Vector ClassifierStochastic Gradient Descent ClassifierMulti-Layer Perceptron ClassifierRidge Classifier
Focus
Specifies the key evaluation metric used to optimize the model's performance. Helps in guiding the selection of the best model configuration.
Available Focus Metrics For Regression Tasks (Defaults to r2)
r2mean_absolute_errormean_squared_errorroot_mean_squared_errorexplained_variancemean_absolute_percentage_error
Available Focus Metrics For Classification Tasks (Defaults to accuracy)
precisionrecallaccuracyf1
The Focus metric and Number of CV Folds is taken into account only when Tuning is enabled
Experiment Name is required when Register Model is enabled
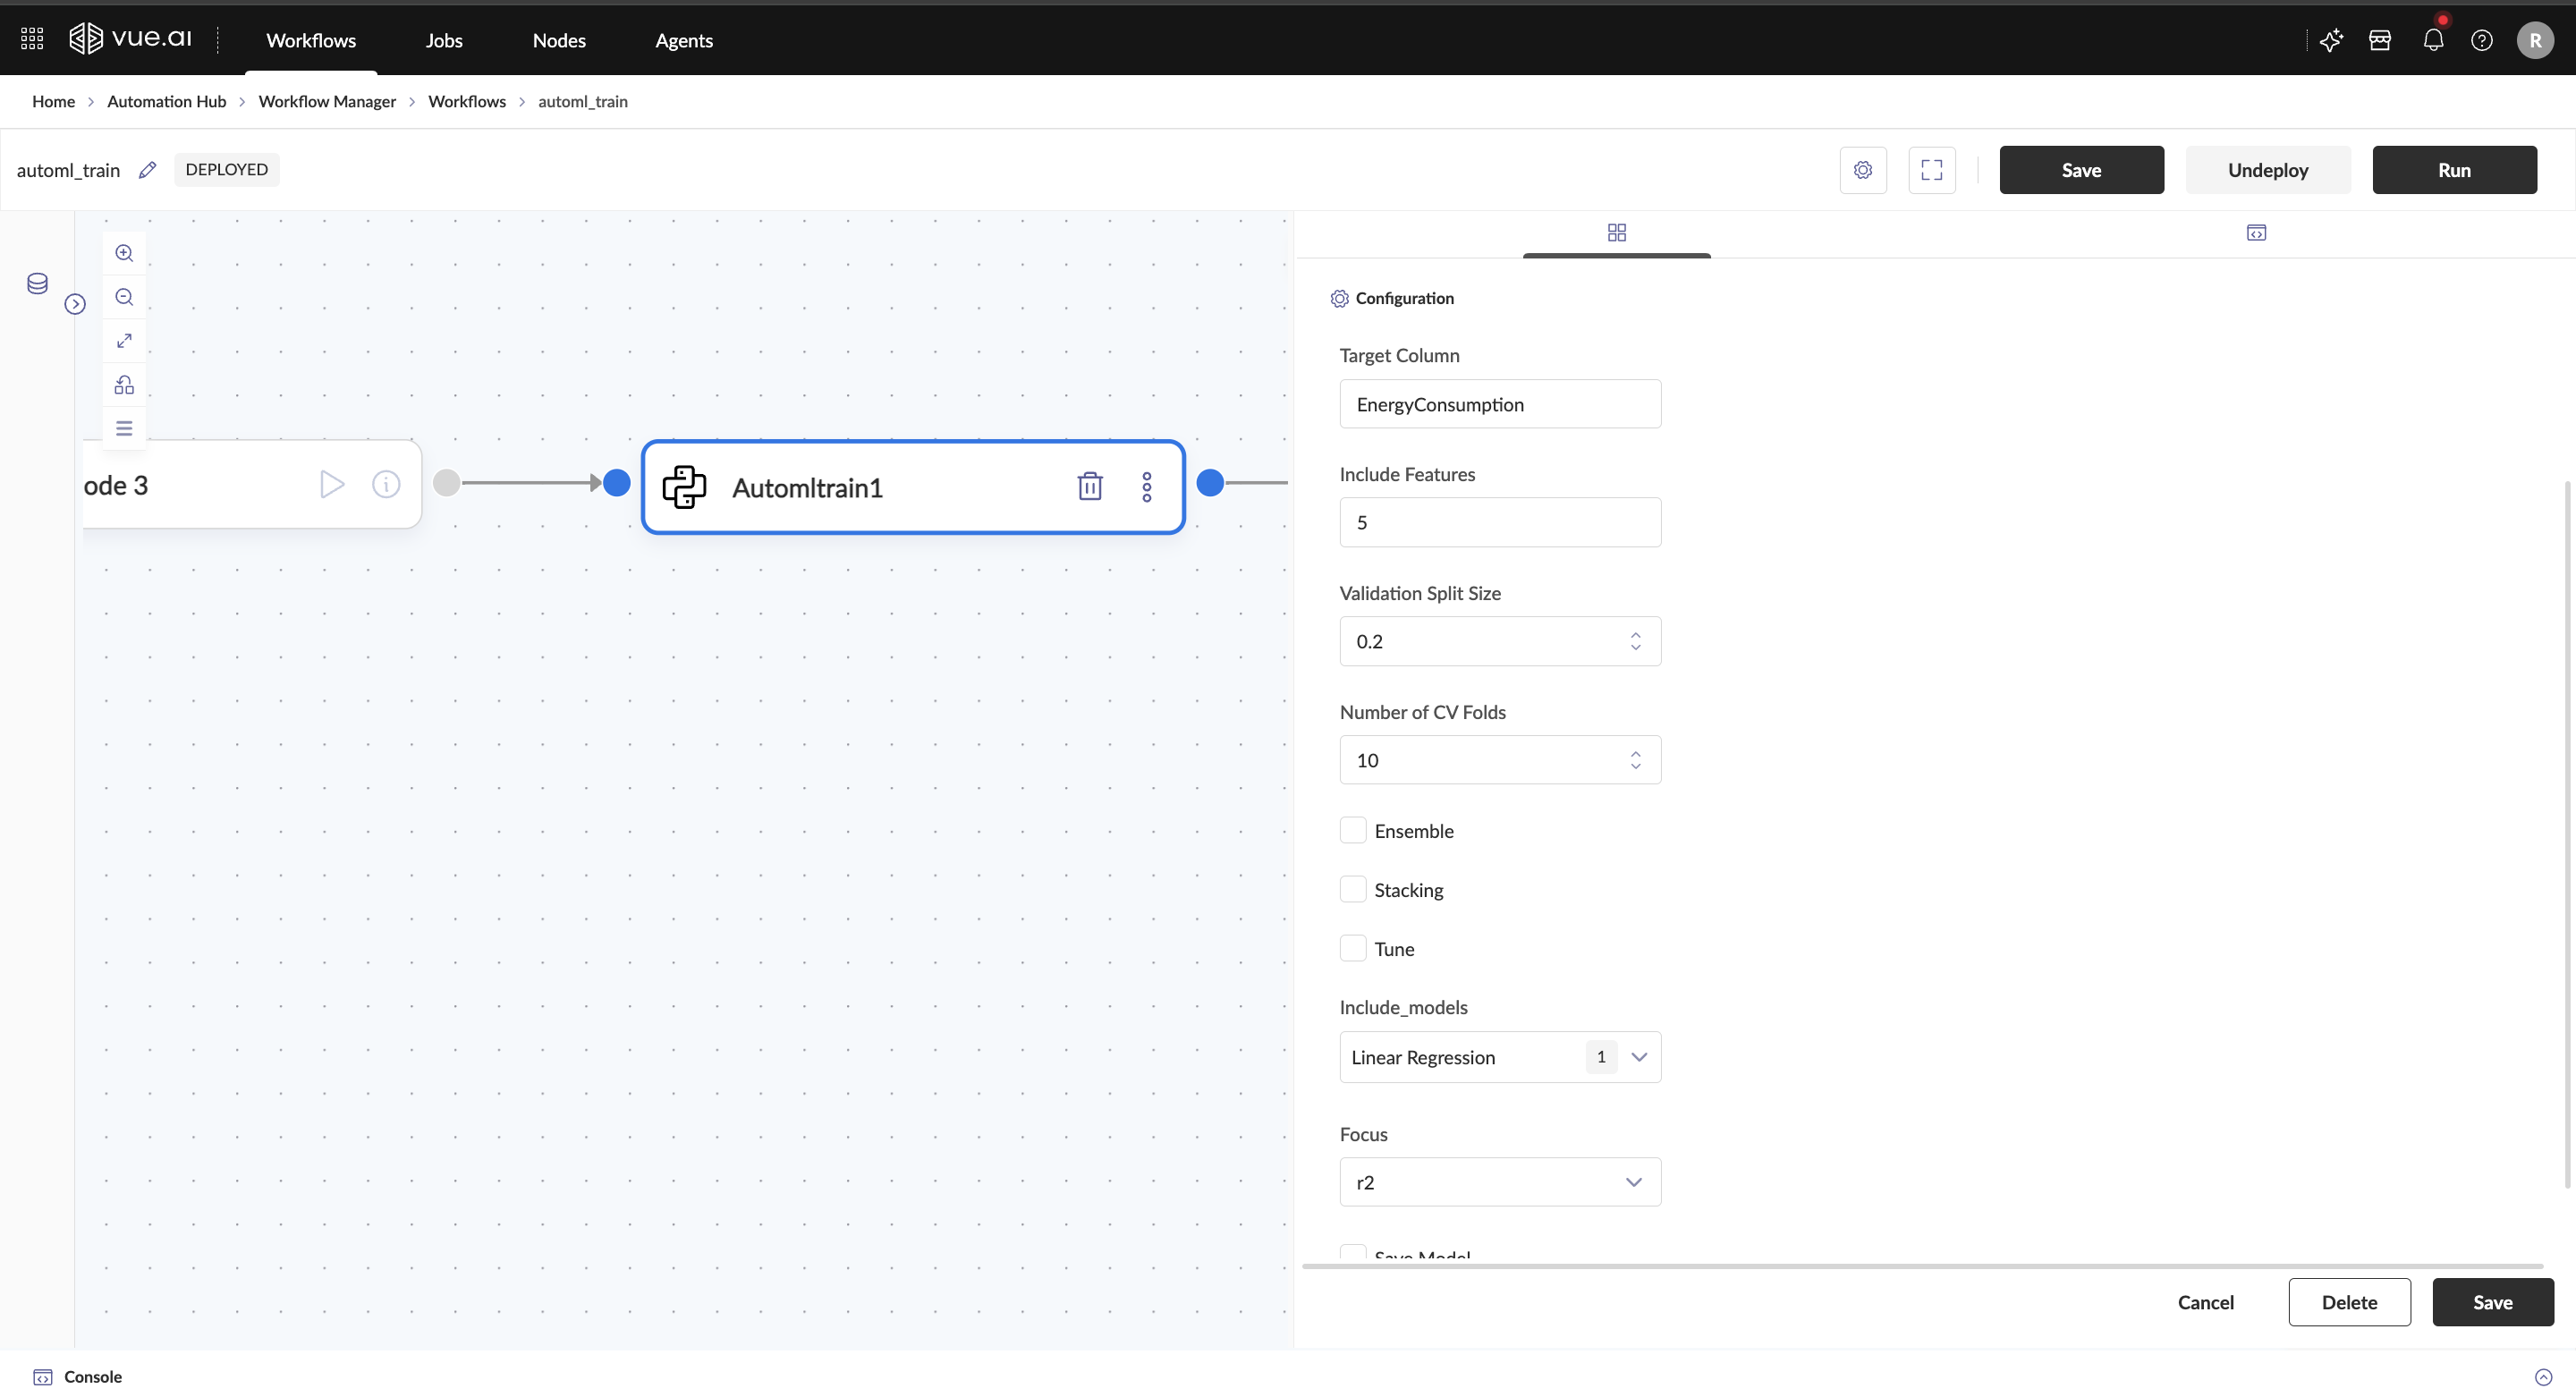
Output For each model listed in Include Models, the following outputs are provided:
- MLflow Run Link: Provides direct access to the registered model and its metadata for tracking, analysis, and reuse.
- Metrics and Model Artifact Path: Enables retrieval of model details and artifacts for further evaluation or deployment when Register Model is enabled.
- Metrics Only: If Register Model is not enabled, the output includes only performance metrics for evaluation.
For more information about model artificats and mflow refer to MLOps : Experiment and Model Tracking Flow
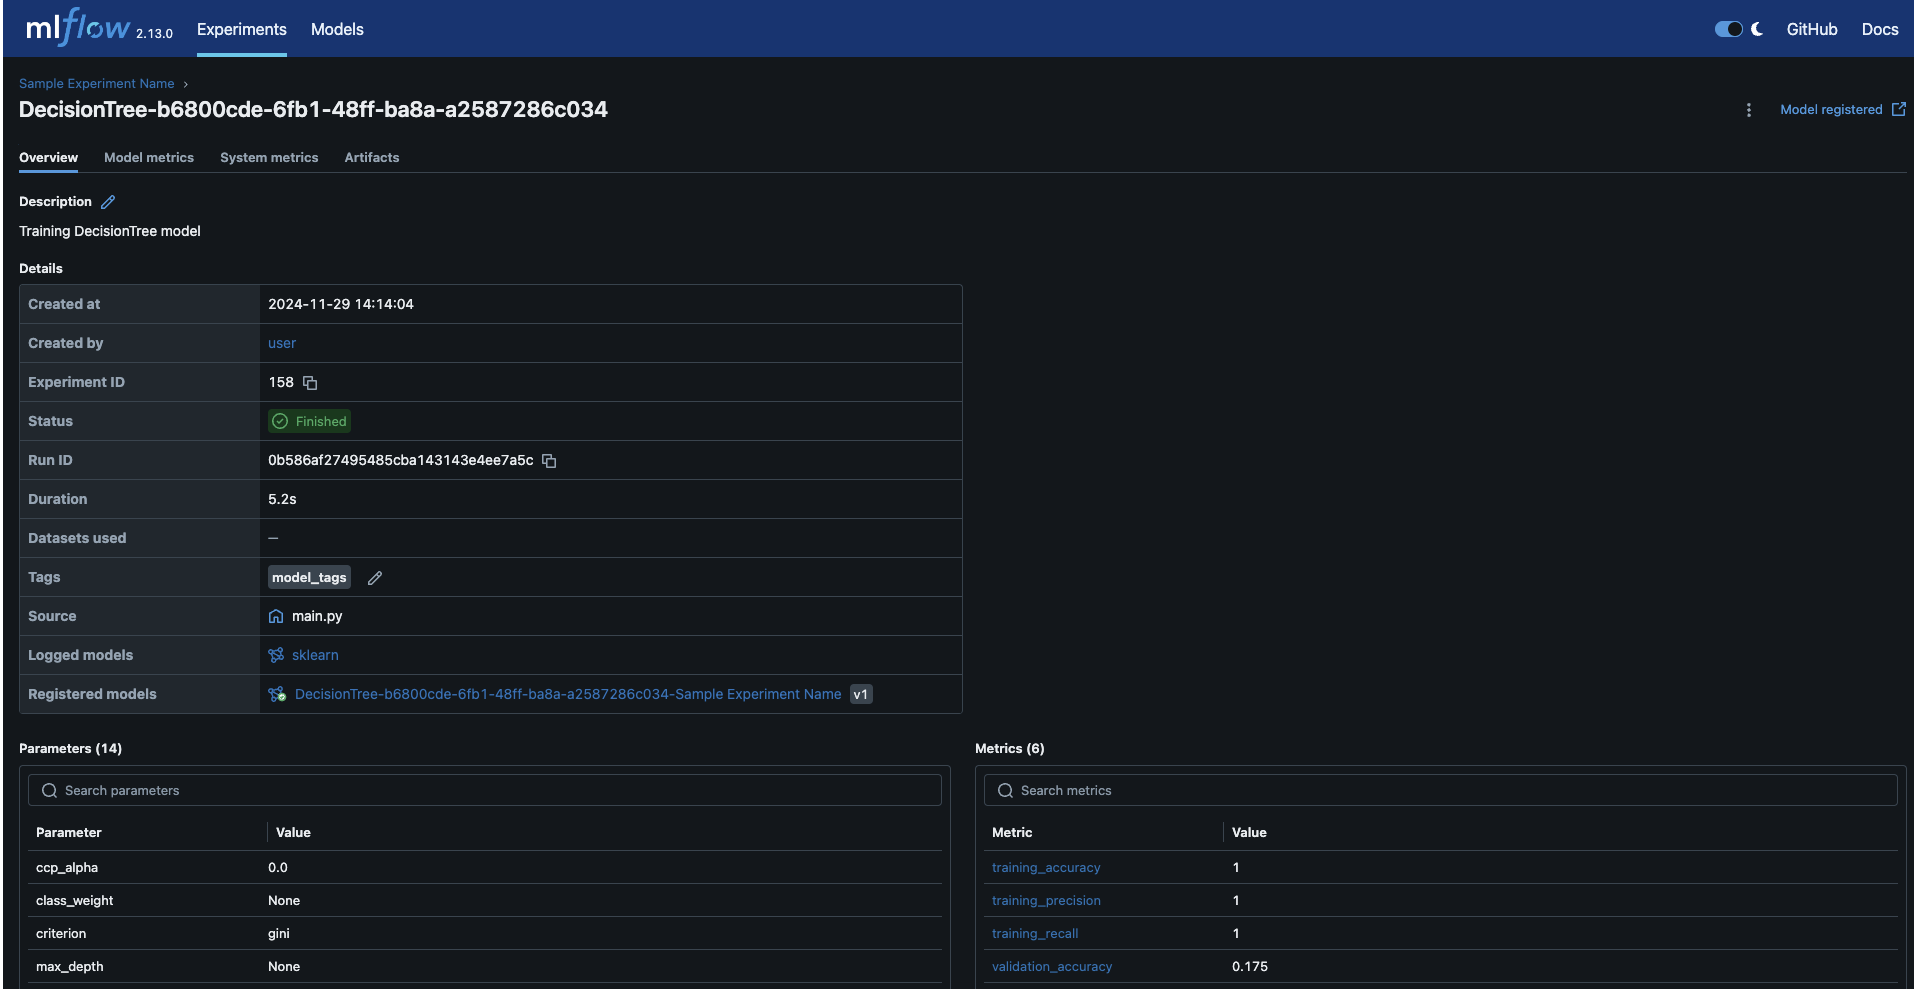
Best Practice of using AutoML Nodes: Vue.ai provides two approaches for AutoML training and inference:
Case 1: Standard Workflow
- Training: Use Vue.ai's built-in data preprocessing and AutoML trainer.
- Inference:
- Generate predictions using Vue.ai's AutoML inference code.
- Store the results as a dataset and load them into a notebook via the SDK for further analysis.
Case 2: Custom Workflow
- Training: Perform custom data preprocessing before training with Vue.ai's AutoML trainer.
- Inference:
- Develop custom inference code.
- Ensure test data undergoes the same preprocessing steps as the training data.
Troubleshooting
Common Issues and Solutions
Problem 1: The dataset is not recognized Cause: The dataset may not be correctly registered in the system. Solution: Ensure that the dataset is correctly registered in the system.
Problem 2: Model training is taking too long Cause: Large dataset, excessive hyperparameter tuning, or complex models. Solution: Reduce dataset size, limit tuning space, increase node deployment resources or choose simpler models.
Problem 3: Model performance is unexpectedly low Cause: Poor feature selection, incorrect hyperparameters, or data imbalance. Solution: Perform feature engineering, tune hyperparameters, and balance the dataset using custom workflows or jupyter notebook
Additional Information
The AutoML Model Trainer node aids in structuring data for workflows involving machine learning, data preprocessing, and analysis. It eliminates the need for manual data conversion, making workflows more efficient.
FAQ
Can multiple datasets be used as input to the AutoML Model Trainer node?
No, each AutoML Model Trainer node processes only one dataset at a time. Multiple nodes can be used if multiple datasets need to be handled.
What if the dataset is too large?
Consider using data sampling to test the workflow in speed run and deploy the workflow to handle large datasets.
Do I need to preprocess my data before using AutoML?
Vue.ai's AutoML trainer includes built-in preprocessing, but for custom workflows, you may need to perform preprocessing steps such as handling missing values, encoding categorical features, or normalizing numerical data.
Can I specify which features to include in the model?
Yes, you can define the number of features to select using the Include Features parameter. You can specify an integer value to select the top-ranked features or use all to include all features.
Does AutoML support hyperparameter tuning?
Yes, AutoML includes an option for hyperparameter tuning. Enabling the Tune parameter will automatically optimize model configurations for better performance.
How does AutoML handle model evaluation?
AutoML evaluates models using predefined metrics. You can specify an evaluation metric using the Focus parameter (e.g., accuracy for classification or r2 for regression).
Can trained models be registered for tracking?
Yes, AutoML supports model registration. Enabling the Register Model option will store the trained model in MLflow for tracking, evaluation, and reproducibility.
What happens if the target column is missing?
The model training process will fail. Ensure the target column exists in the dataset before proceeding.
Can I enable both ensemble and stacking?
Yes, but stacking requires a large dataset to avoid overfitting. Ensure model diversity for effective ensemble learning.
Why is my model taking too long to train?
This may be due to hyperparameter tuning (tune = true), a large dataset, or complex models like XGBoost Regressor. Consider reducing the search space or using fewer models.
What if I forget to provide an experiment name when registering a model?
If register = true, an experiment name is required. Otherwise, the model registration process will fail.
Summary
The AutoML - Model Trainer Node trains selected models using the scikit-learn library, analyze performance metrics, and optionally log the model, metrics, and artifacts to MLflow for streamlined tracking and management.
AutoML Inference
Welcome to the AutoML Inference Node guide! This guide will help users understand the purpose and capabilities of the AutoML Inference Node and learn how to set up and use the node effectively for generating predictions.
Who is this guide for? This guide is intended for users integrating an AutoML Inference Node within a workflow to automate predictions using trained machine learning models.
Ensure access to a trained model and a properly formatted dataset for accurate predictions.
Overview
The AutoML Inference Node simplifies the prediction process by leveraging a pre-trained model to generate outputs based on new input data. The node:
- Loads a trained model for inference.
- Processes new data using the stored preprocessing pipeline in AutoML - Data Preprocessor node and generates predictions efficiently.
- Optionally logs inference results to MLflow for tracking and analysis.
Prerequisites
Before using the AutoML Inference Node, ensure the following:
- A trained machine learning model saved using mlops service.
- A properly formatted dataset for making predictions.
- An AutoML Inference Node integrated into the workflow to automate inference.
- Basic understanding of model deployment and evaluation.
Adding AutoML Inference to the Workflow
Two methods can be followed to add a AutoML Inference:
Drag and Drop Method
- The node is selected from the left pane.
- It is then dragged onto the workflow canvas.
Right-Click Method
- The canvas is right-clicked.
- The node is selected from the context menu.
- It is then placed on the canvas.
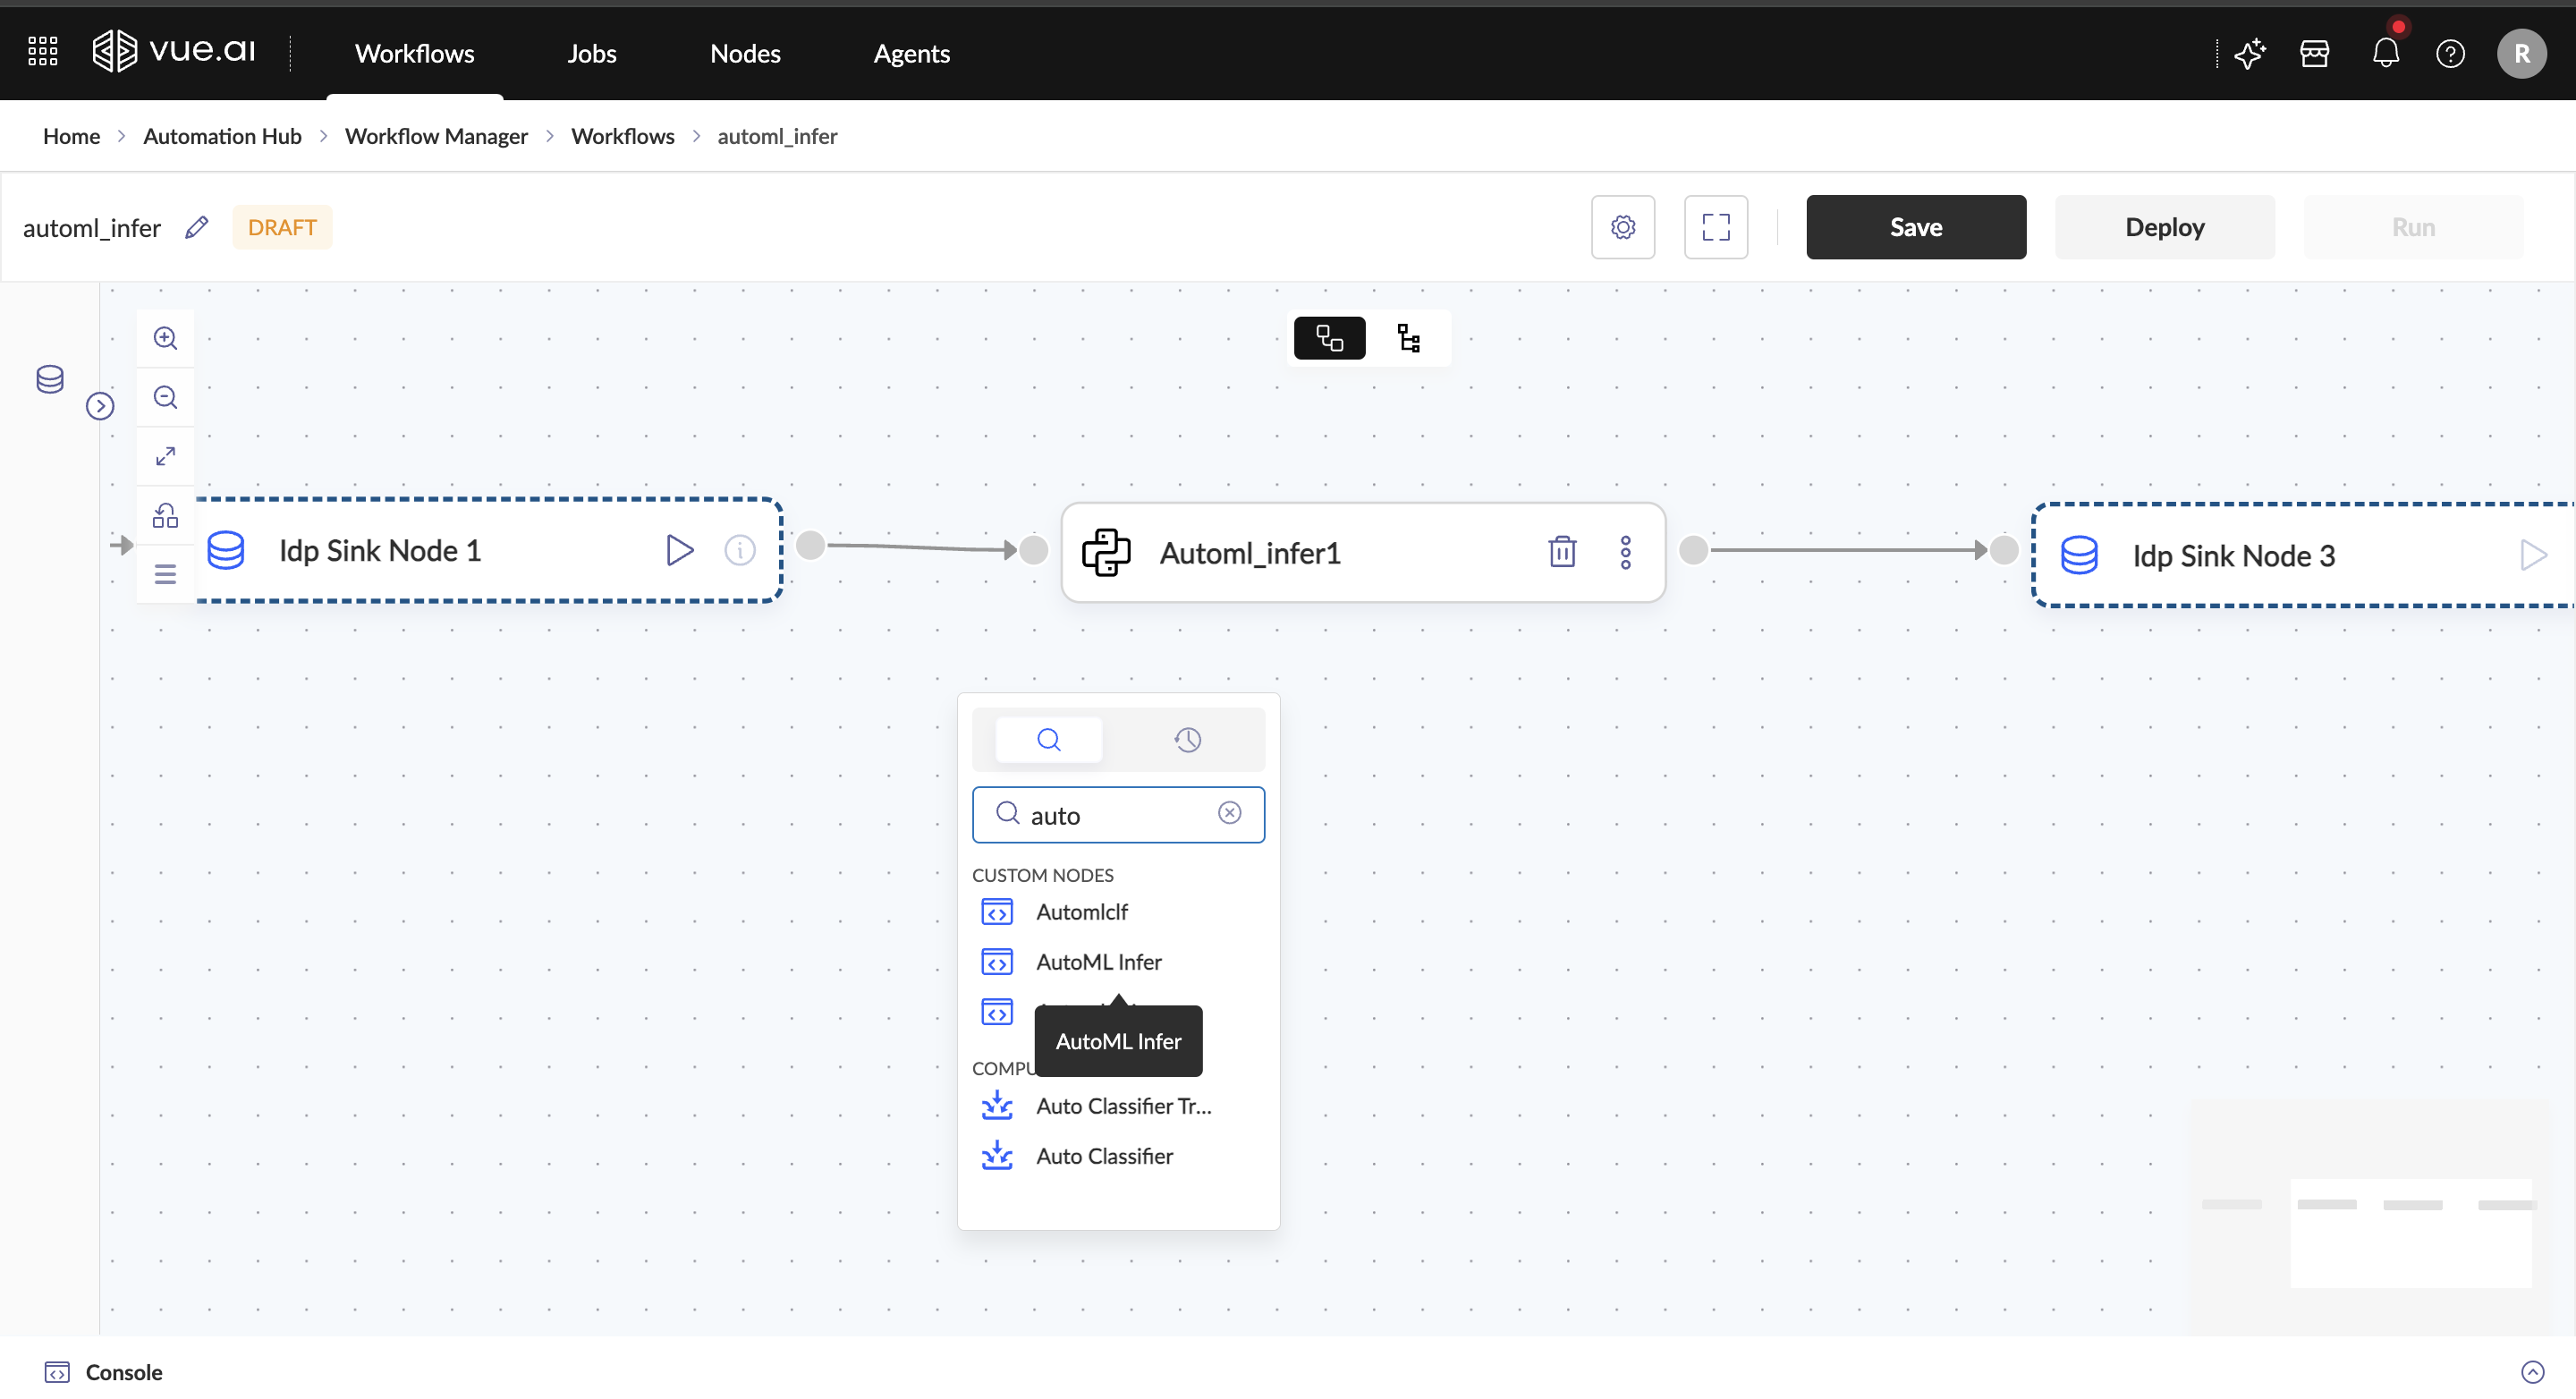
Input Requirements This node supports the following types of datasets:
Preprocessed Datasets: These datasets have already undergone feature engineering and transformation, making them ready for inference. You can preprocess datasets in Jupyter Notebooks available within the Developer Hub.
- Refer to Vue.ai Notebooks User Guide for more information on Notebooks.
- Ensure the dataset follows the same preprocessing steps used during model training for accurate predictions.
Raw Datasets: If the dataset is not preprocessed, it must be transformed to match the model's expected input format. This can be achieved in one of the following ways:
- Using preprocessing nodes within the workflow.
- Providing a custom saved pipeline path.
- Applying the preprocessing pipeline saved during model training.
Configuring the AutoML Inference
Once the node is added, it can be configured with the following parameters:
Name
- A unique name is entered (must be under 18 characters).
Description
- Optionally, a description is provided for clarity.
Experiment Name
- The specific trained model to be used for inference.
Model Name
- This field determines the number of features to select. It accepts either an integer or
all(default). If an integer is provided, a feature selection method ranks and selects the top n features based on their importance.
- This field determines the number of features to select. It accepts either an integer or
Experiment Name and Model Name can be retrieved from the AutoML Trainer Node Output.
Use Preprocessor Pipeline
- If enabled, applies the preprocessing pipeline saved in AutoML - Data Preprocessor node.
Get Object Paths from User
- If enabled user should provides paths for:
- Model Path (
model_path) – Trained model file. - Preprocessor Path (
preprocessor_path) – Saved preprocessing pipeline. - Preprocessor Config Path (
preprocessor_config_path) – Pipeline config file.
- Model Path (
- If enabled user should provides paths for:
If neither Use Preprocessor Pipeline nor Get Object Paths from User is selected, the provided input dataset will be used directly for inference with the trained model.
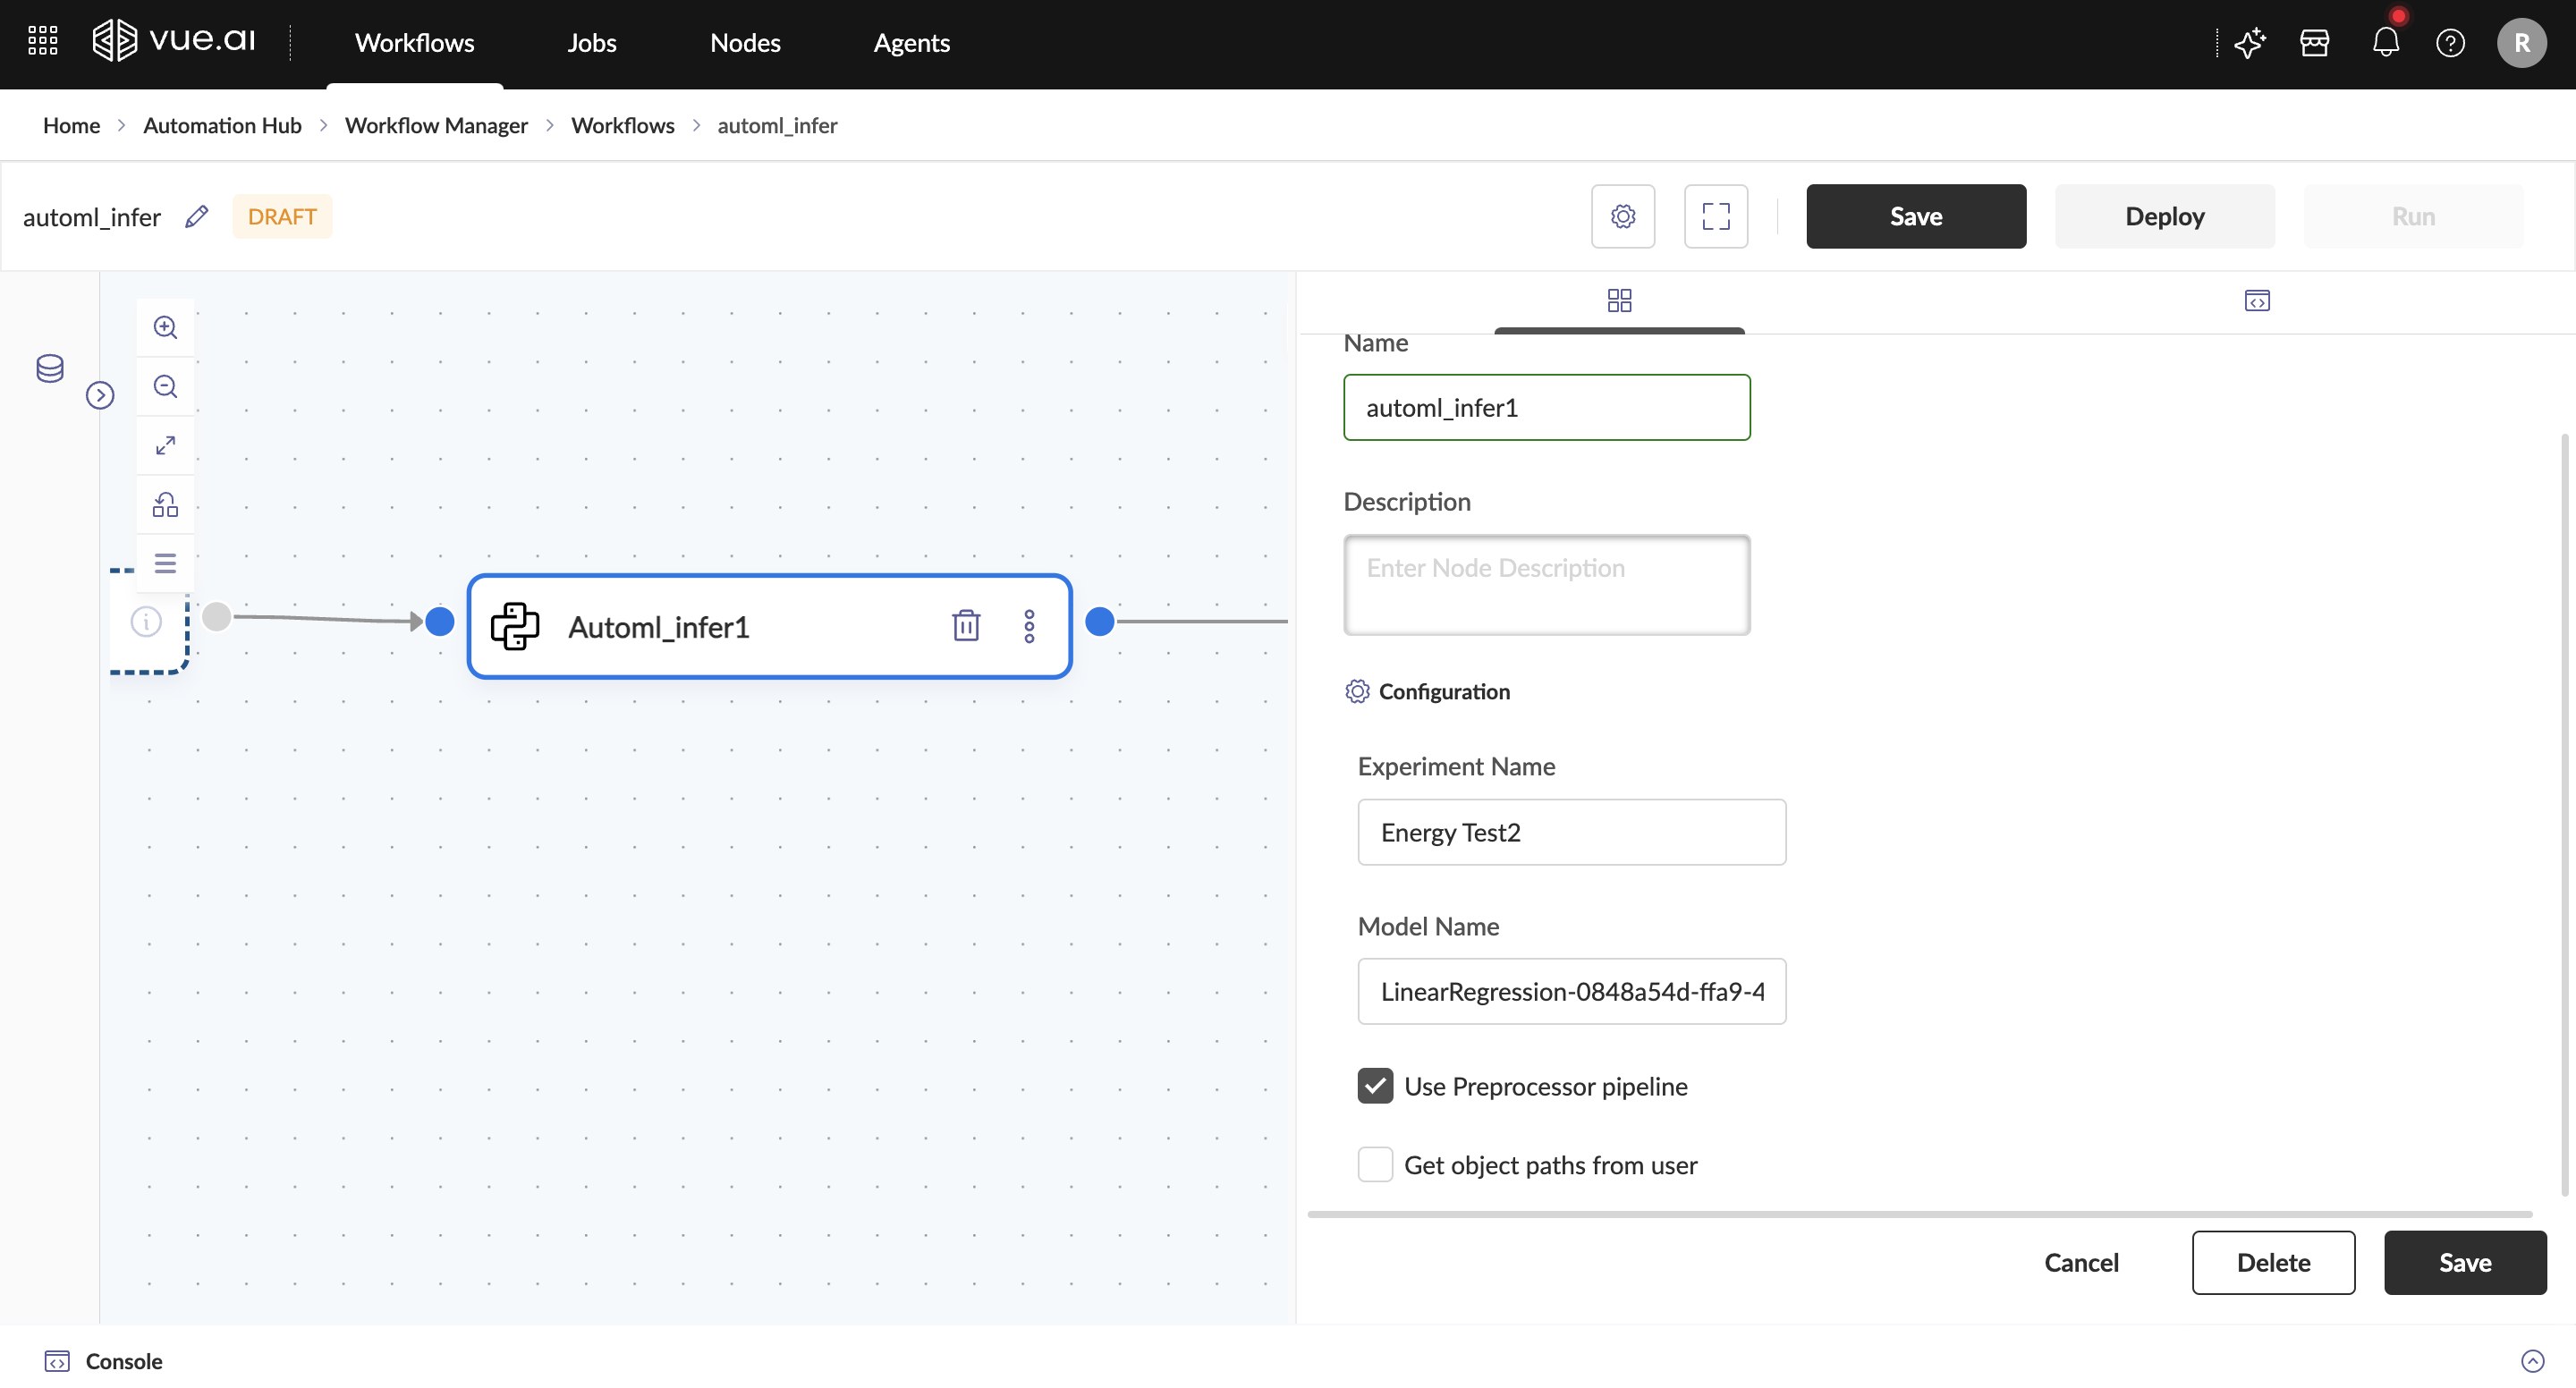
Output The output consists of the inference results generated by the trained model. This includes:
- Predictions: The model's output based on the provided test data.
Best Practice of using AutoML Nodes: Vue.ai provides two approaches for AutoML training and inference:
Case 1: Standard Workflow
- Training: Use Vue.ai's built-in data preprocessing and AutoML trainer.
- Inference:
- Generate predictions using Vue.ai's AutoML inference code.
- Store the results as a dataset and load them into a notebook via the SDK for further analysis.
Case 2: Custom Workflow
- Training: Perform custom data preprocessing before training with Vue.ai's AutoML trainer.
- Inference:
- Develop custom inference code.
- Ensure test data undergoes the same preprocessing steps as the training data.
Troubleshooting
Common Issues and Solutions
Problem 1: The dataset is not recognized Cause: The dataset may not be correctly registered or formatted as expected. Solution: Ensure the dataset is properly registered and matches the expected format.
Problem 2: Inference is taking too long Cause: Large dataset size, complex model, or insufficient computing resources. Solution: Reduce dataset size, optimize model selection, and increase node deployment resources if needed.
Problem 3: Model predictions are inaccurate Cause: Mismatched preprocessing, incorrect input format, or outdated model. Solution: Verify preprocessing steps, ensure input data is in the correct format, and use an updated model version.
Additional Information
The AutoML Inference Node automates model predictions by streamlining input preprocessing and inference execution, eliminating the need for manual intervention.
FAQ
Can multiple datasets be used as input to the AutoML Inference node?
No, the AutoML Inference Node processes one dataset at a time. Use multiple nodes if multiple datasets need to be handled.
What if the dataset format does not match the trained model?
Ensure the dataset is preprocessed using the same pipeline as used during training. Use preprocessing nodes or provide a saved preprocessing pipeline.
What happens if I don't provide a saved preprocessing pipeline?
If the model requires preprocessing, you must either apply it within the workflow or specify the saved pipeline path. Otherwise, the inference may fail.
Can I perform inference on raw datasets?
Yes, but preprocessing must be applied first using either workflow preprocessing nodes or a saved preprocessing pipeline.
Why is my model producing unexpected results?
Check if the input data matches the expected schema and ensure the correct preprocessing pipeline is applied before inference.
How can I speed up inference?
Reduce dataset size, use optimized model versions, and ensure sufficient computational resources are allocated.
What if the model path is incorrect or missing?
Inference will fail. Ensure the correct model path is provided, either manually or via an automated pipeline.
Summary
The Data Preprocessing Node in machine learning transforms raw data into a structured format by handling missing values (imputation), encoding categorical variables, scaling numerical features, correcting skewness, and managing outliers. It also excludes irrelevant columns and ensures consistency in data processing. These steps improve model performance by enhancing data quality, reducing bias, and preventing inconsistencies in training and evaluation.
VizQL Nodes
VizQL nodes provide comprehensive data manipulation capabilities with SQL-like operations for data transformation and analysis.
Select Node
Welcome to the Select Node guide! This guide will assist users in retrieving specific columns from a dataset, renaming a column while selecting it, and adding a new column using expressions.
Expected Outcome: By the end of this guide, you will gain an understanding of the Select Node and its applications in the Vue.ai platform.
Overview
The Select Node is utilized to refine and streamline a dataset by choosing specific columns for further processing. It enables the extraction of relevant data by selecting only the necessary columns, effectively reducing data clutter and optimizing workflow efficiency. With the capability to rename columns during selection, the Select Node ensures clarity and consistency in the dataset. Additionally, the Select Node enables the creation of new columns using Python expressions, providing flexibility in data transformation. This node is essential for organizing and preparing data for analysis or integration with other nodes in the workflow.
Prerequisites For a better understanding of Transform Nodes, it is recommended to review the Getting Started with Workflows documentation.
Navigation To begin, the following path should be navigated: Home/Landing Page → Automation Hub → Workflow Manager → Workflows → New Workflow
Step-by-Step Instructions
- Load a dataset by adding the Dataset Reader Node to the workspace.
- Drag and drop the Select node under the Transform node section in the left pane.
- Select the necessary columns from the Field dropdown.
- Add an Alias for the selected columns if required.
- Click Add Item to include new columns.

Use of Expressions in Select Node
You can use expressions in the Select node to perform calculations or transformations on existing fields
Example Usage If you want to add a new column salary_inr by performing calculations on salary_in_usd by multiplying it by 87, you can define the expression as follows:
Expression
salary_inr = salary_in_usd * 87
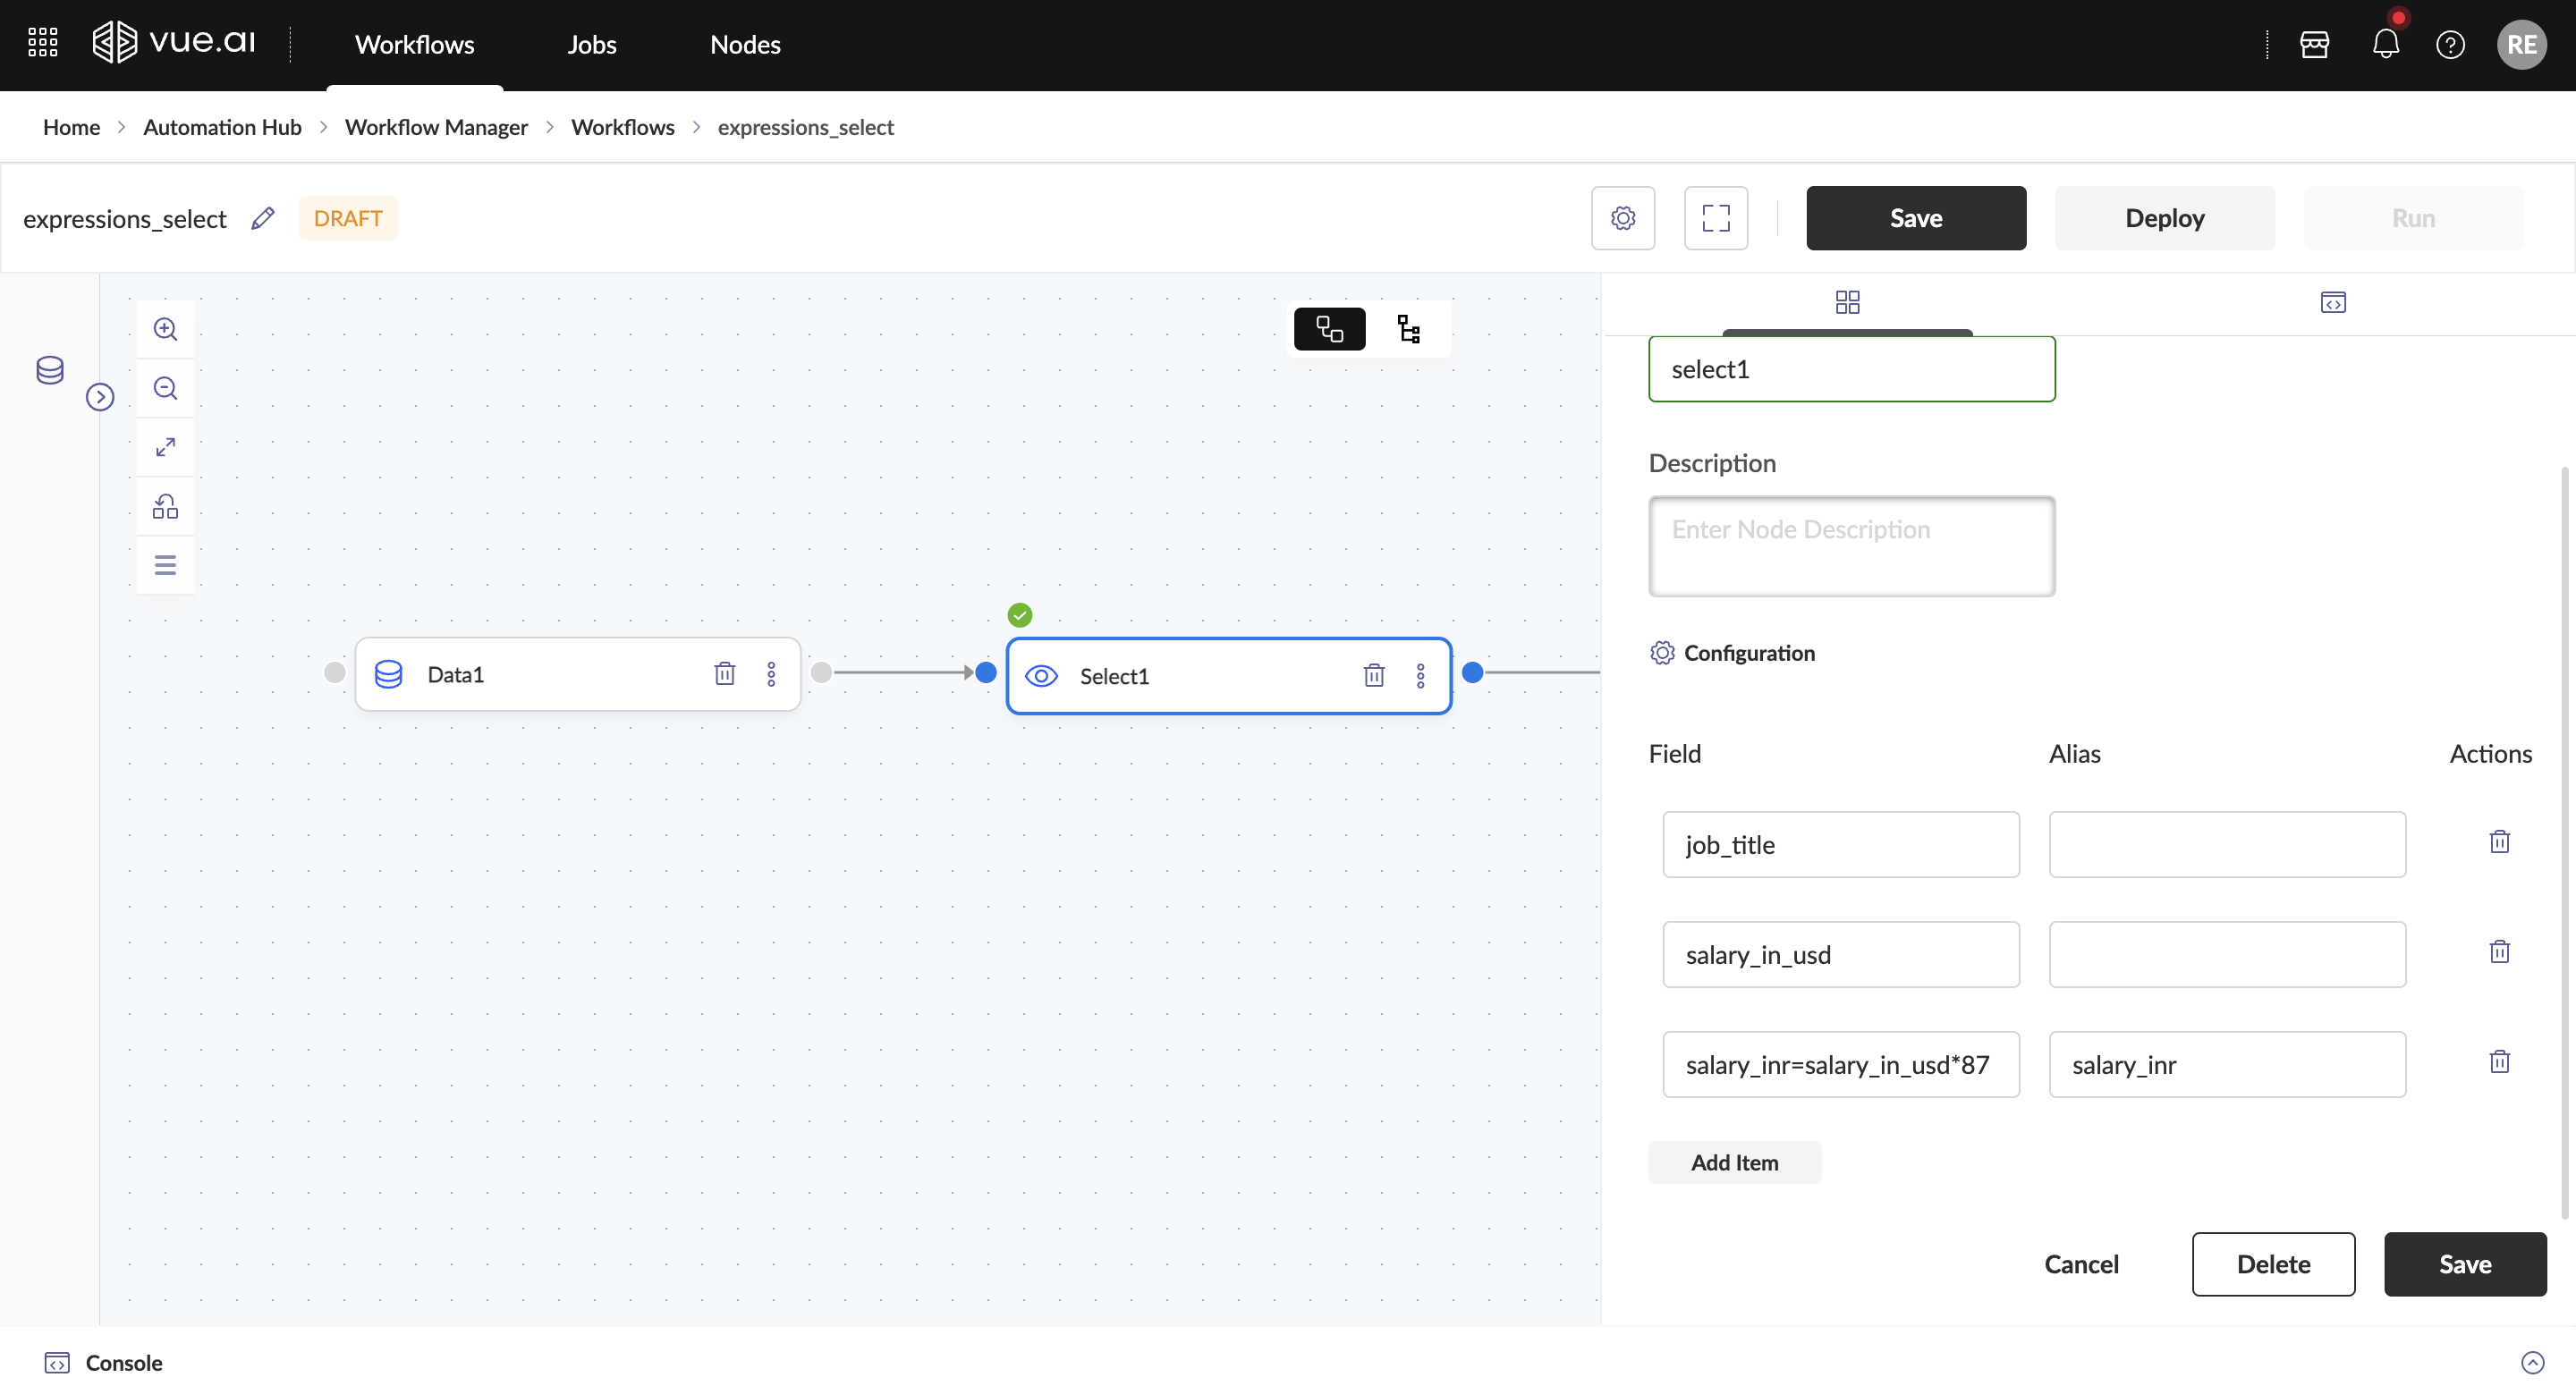
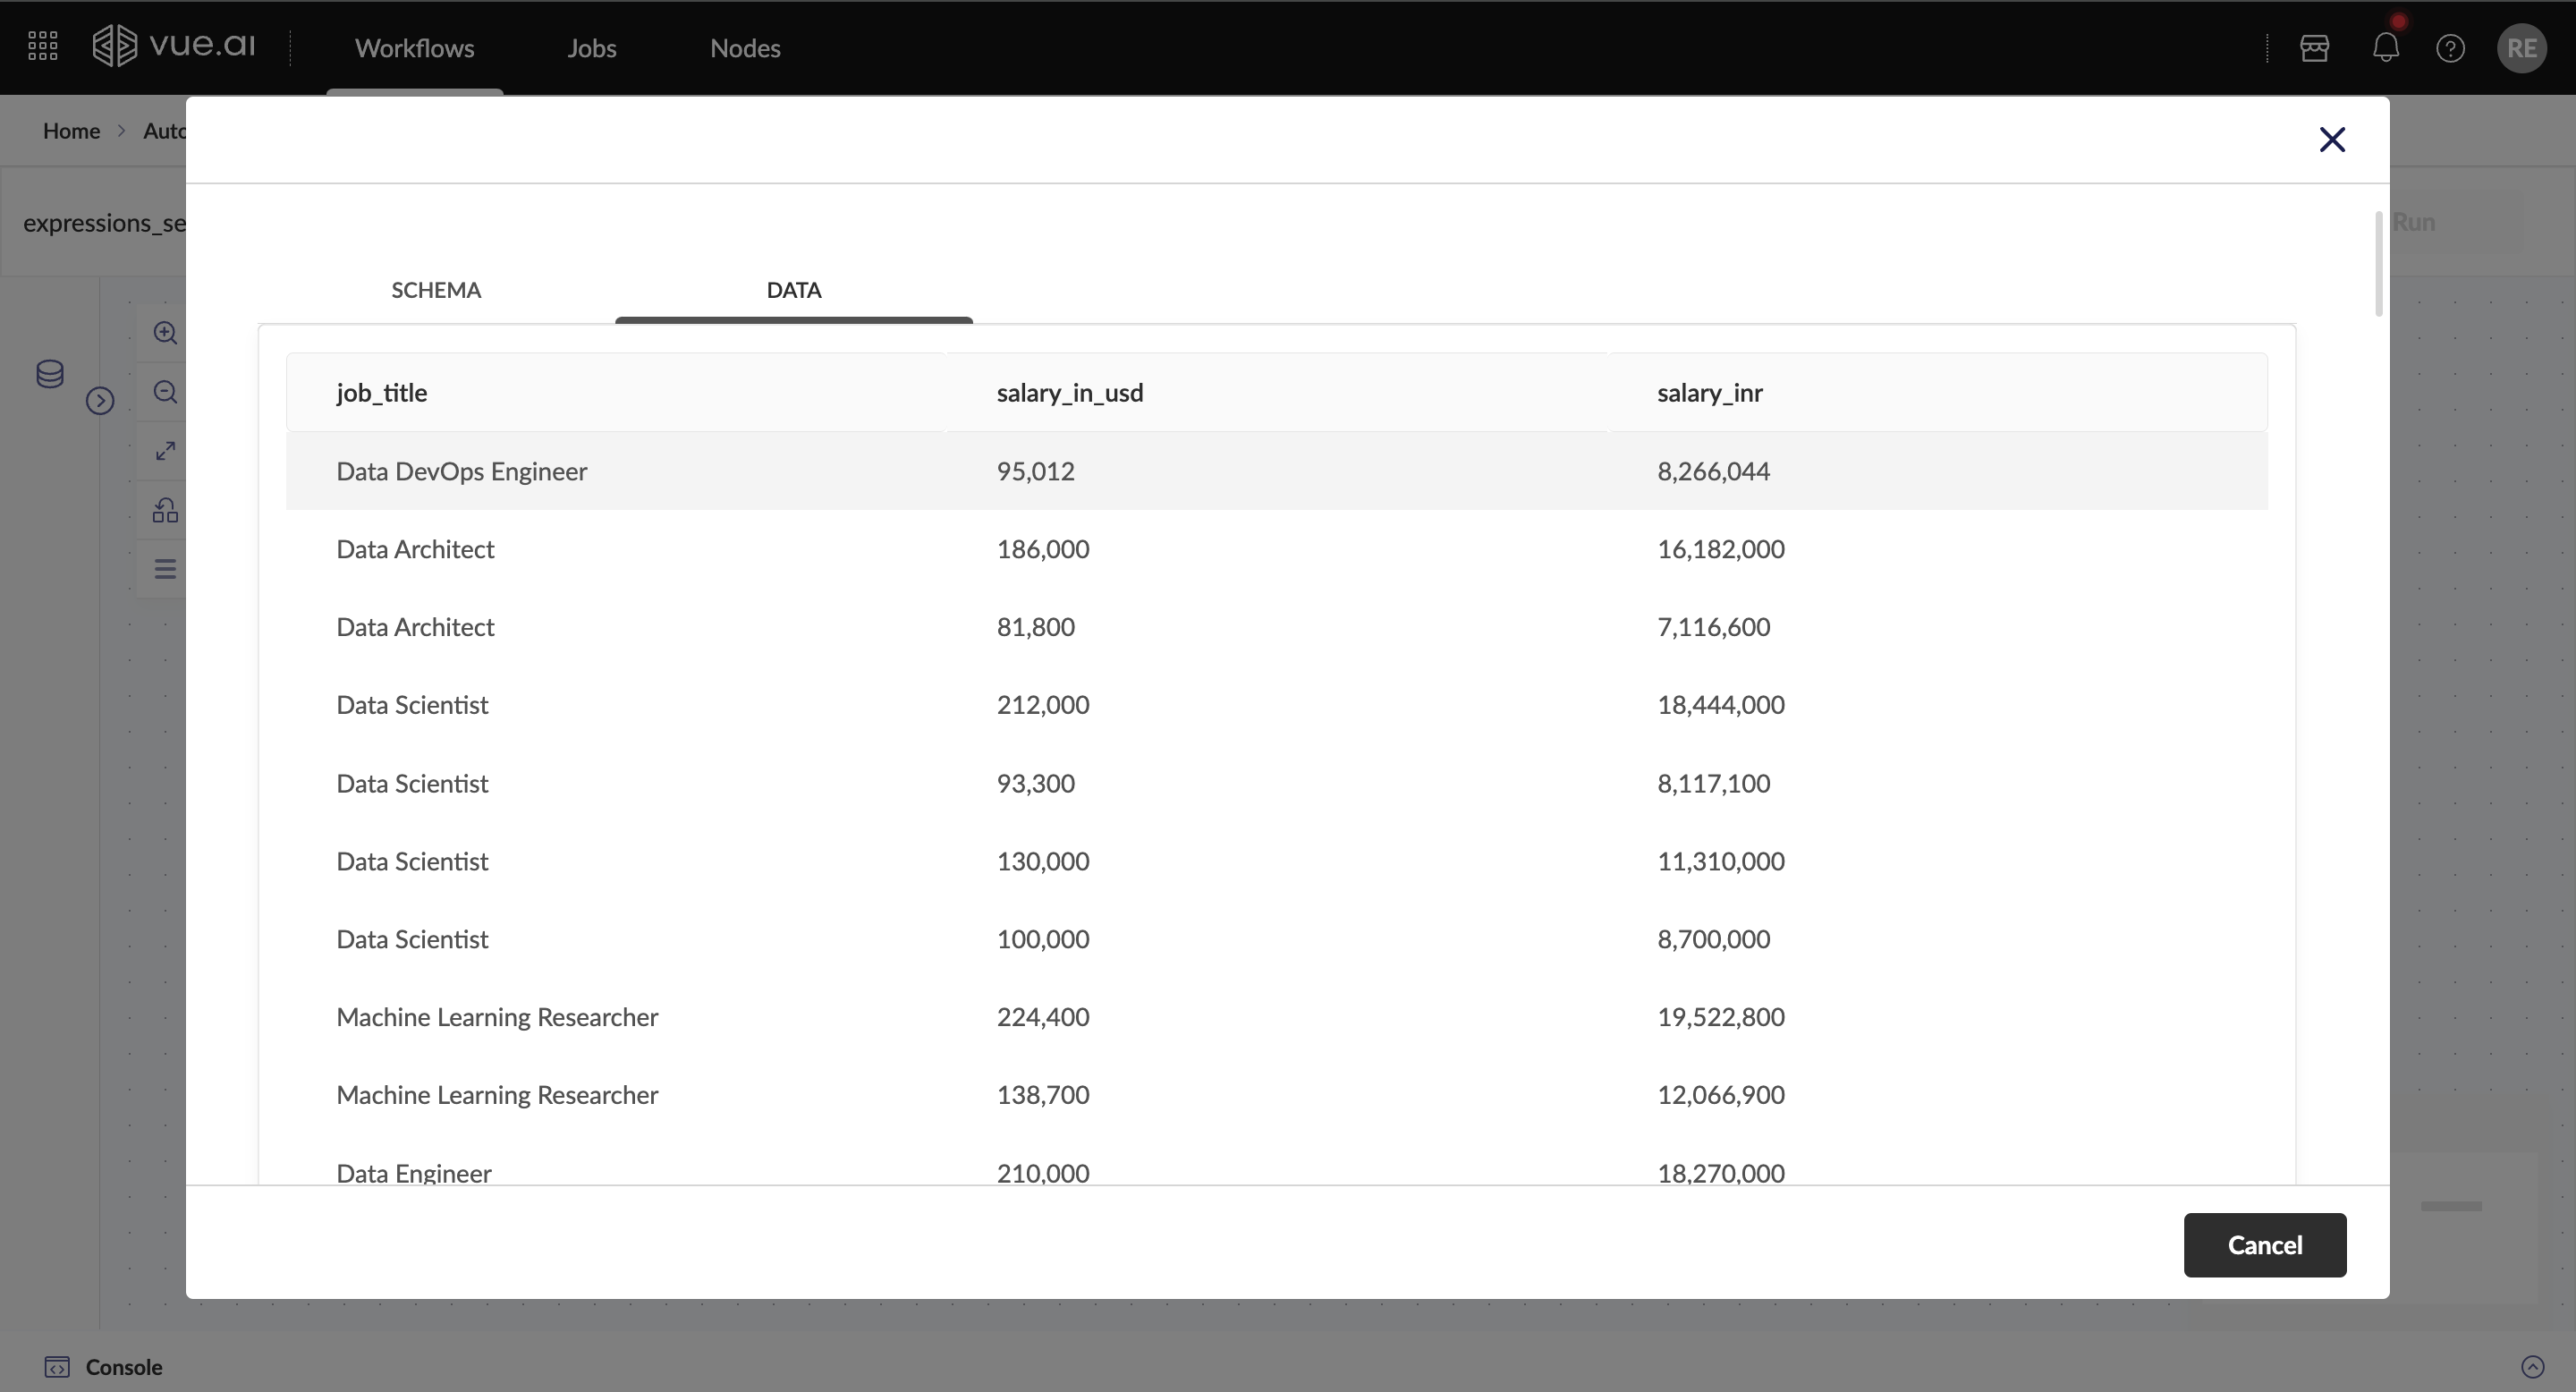
The transformed data will include a new field, salary_inr, containing the converted salary values.
The Select node allows you to apply similar expressions for arithmetic operations, string manipulations, or conditional logic, making it a powerful tool for data transformation.
The newly added column name should also be included under the alias field
Other Examples
null_comlumn=""
monthly_rent = annual_rent / 12
full_name = first_name + " " + last_name
temp_fahrenheit = (temp_celsius * 9/5) + 32
Troubleshooting
Common Issues and Solutions
Problem 1: No values are listed in the Fields dropdown Cause: A Dataset Reader Node is not added before the Select Node or it is not linked to it. Solution: Ensure that a Dataset Reader Node is added before the Select Node and it is linked to it.
Problem 2: Warning sign above the Select Node Cause: The Select Node is not successfully added. Solution: Click on Add to add the node to the workflow, the warning sign will disappear.
Additional Information
Ensure that a Dataset Reader Node is added before the Select Node and it is linked to it if no values are listed in the Fields dropdown.
FAQ
How to rename a column in the output?
The Alias text box can be used to rename a column in the output.
How to unselect a column?
The bin button under the Actions section associated with that column name can be used to unselect a column.
How to delete a Select Node?
The bin button that is present in the Select node can be used to delete a Select Node.
Summary
This guide covered the following:
- Retrieving specific columns from a dataset using select node.
- Renaming a column using select node.
Drop Node
Welcome to the Drop Node Guide! This guide will assist users in removing specific columns from a dataset.
Expected Outcome: By the end of this guide, you will gain an understanding of the Drop Node and their applications in Vue.ai platform.
Overview
The Drop Node is used to remove unwanted or unnecessary columns from a dataset. It allows you to clean up the data by keeping only the relevant fields required for further analysis or processing.
Prerequisites For a better understanding of Transform Nodes, it is recommended to review the Getting Started with Workflows documentation.
Navigation To begin, the following path should be navigated: Home/Landing Page → Automation Hub → Workflow Manager → Workflows → New Workflow
Step-by-Step Instructions
- Load a dataset by adding the Dataset Reader Node to the workspace.
- Drag and drop the Drop node under the Transform node section in the left pane.
- Choose the columns you want to exclude from a dataset from the Drop Columns dropdown.
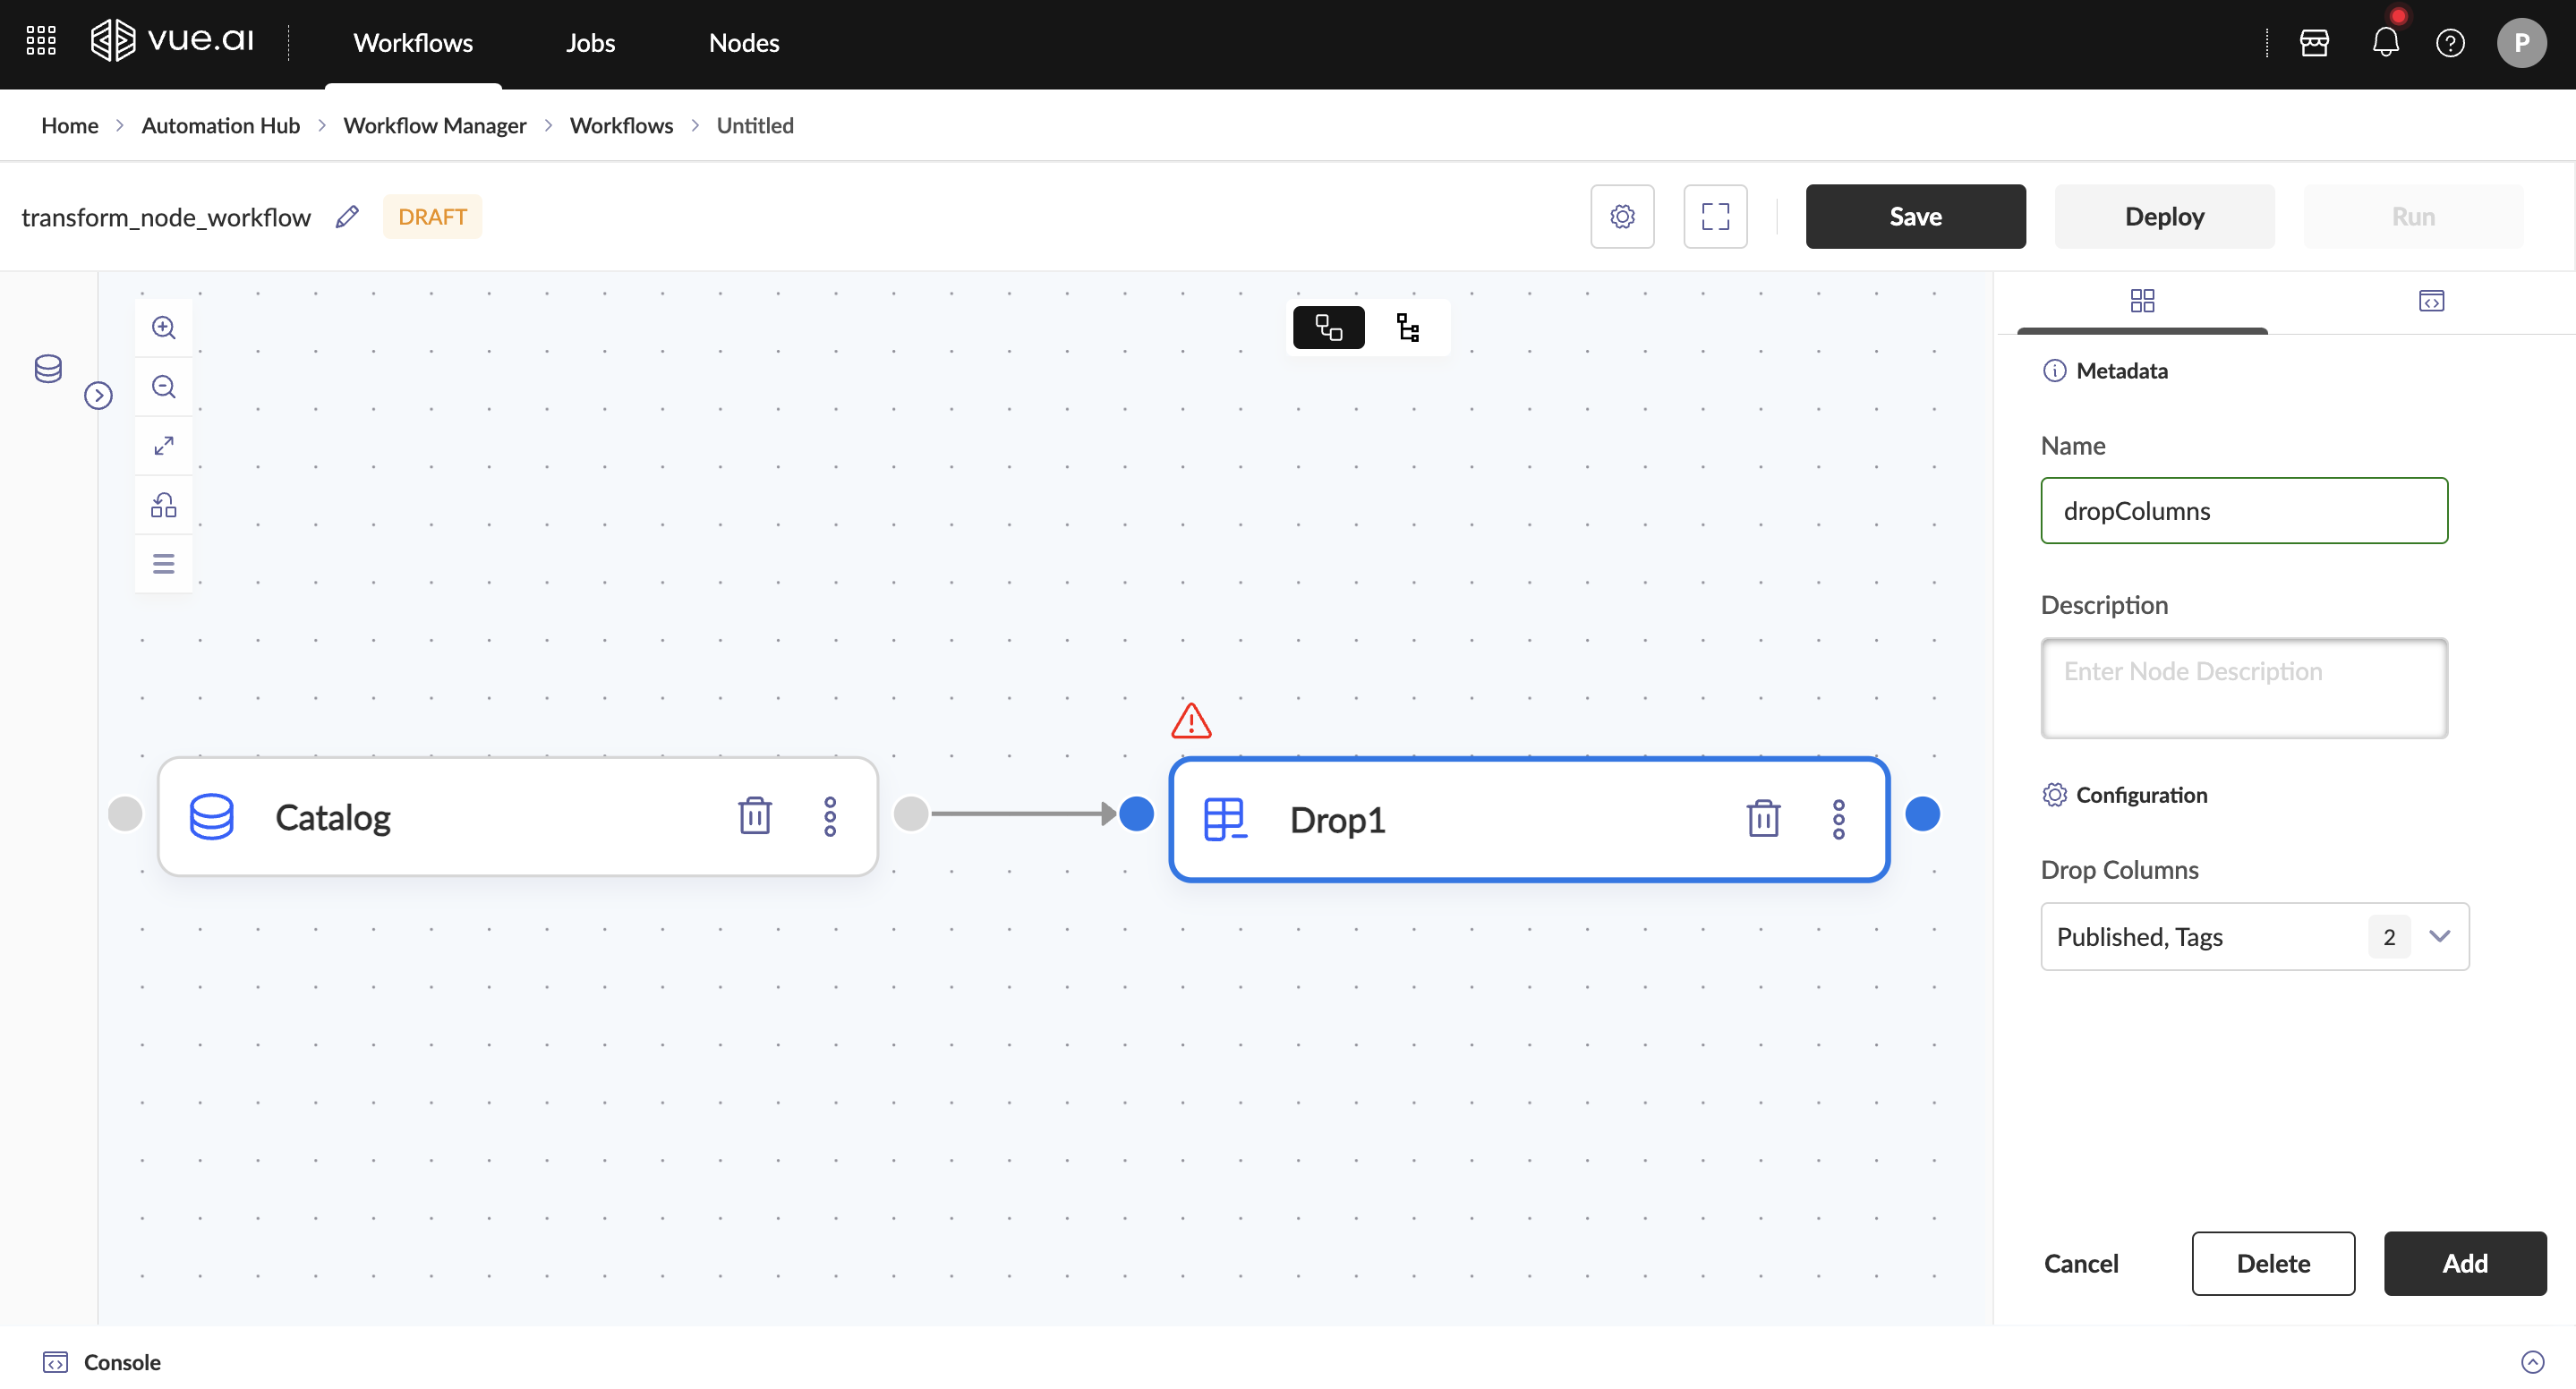
Troubleshooting
Common Issues and Solutions
Problem 1: Only Select All Value Listed in Drop Columns Dropdown Cause: Absence of a Dataset Reader Node before the Drop Node or lack of linkage between them. Solution:
- Ensure a Dataset Reader Node is added before the Drop Node.
- Ensure the Dataset Reader Node is linked to the Drop Node.
Problem 2: Warning Sign Above the Drop Node Cause: The Drop Node has not been successfully added. Solution:
- Click on Add to add the node to the workflow.
Expected Outcome: The warning sign will disappear upon successful addition of the Drop Node.
Additional Information
Ensure a Dataset Reader Node is added before the Drop Node and it is linked to it if only Select All value is being listed in the Drop Columns dropdown.
FAQ
Is it possible to drop multiple columns at once?
Yes, all the columns that need to be dropped can be selected in the Drop Columns dropdown at once.
How can a Drop Node be deleted?
The bin button present in the Drop node can be used for deletion.
Summary
The guide covered how to remove specific columns from a dataset using the Drop Node.
Filter Node
Welcome to the Filter Node guide! This guide will assist users in filtering the rows of a dataset based on defined criteria.
Expected Outcome: By the end of this guide, you will gain an understanding of the Filter Node and their applications in Vue.ai platform will be gained.
Overview
The Filter Node is utilized to refine datasets by applying specific conditions to include or exclude rows based on defined criteria. It allows focusing on relevant data by eliminating unnecessary or irrelevant records, thereby enhancing the quality and accuracy of the dataset. This node ensures that the data meets the required conditions before proceeding to subsequent steps, making it an essential tool for precise data preparation and analysis.
Prerequisites For a better understanding of Transform Nodes, it is recommended to review the Getting Started with Workflows documentation.
Navigation To begin, the following path should be navigated: Home/Landing Page → Automation Hub → Workflow Manager → Workflows → New Workflow
Step-by-Step Instructions
- A dataset should be loaded by adding the Dataset Reader Node to the workspace.
- Drag and drop the Filter node under the Transform node section in the left pane.
- The required columns should be selected from the Field dropdown.
- An appropriate condition operator (e.g., column value equals, not equals, greater than, less than, etc.) should be selected to filter the rows from the Conditional Operator dropdown.
- Multiple conditions can be combined using logical operators like AND or OR to refine the filter logic.
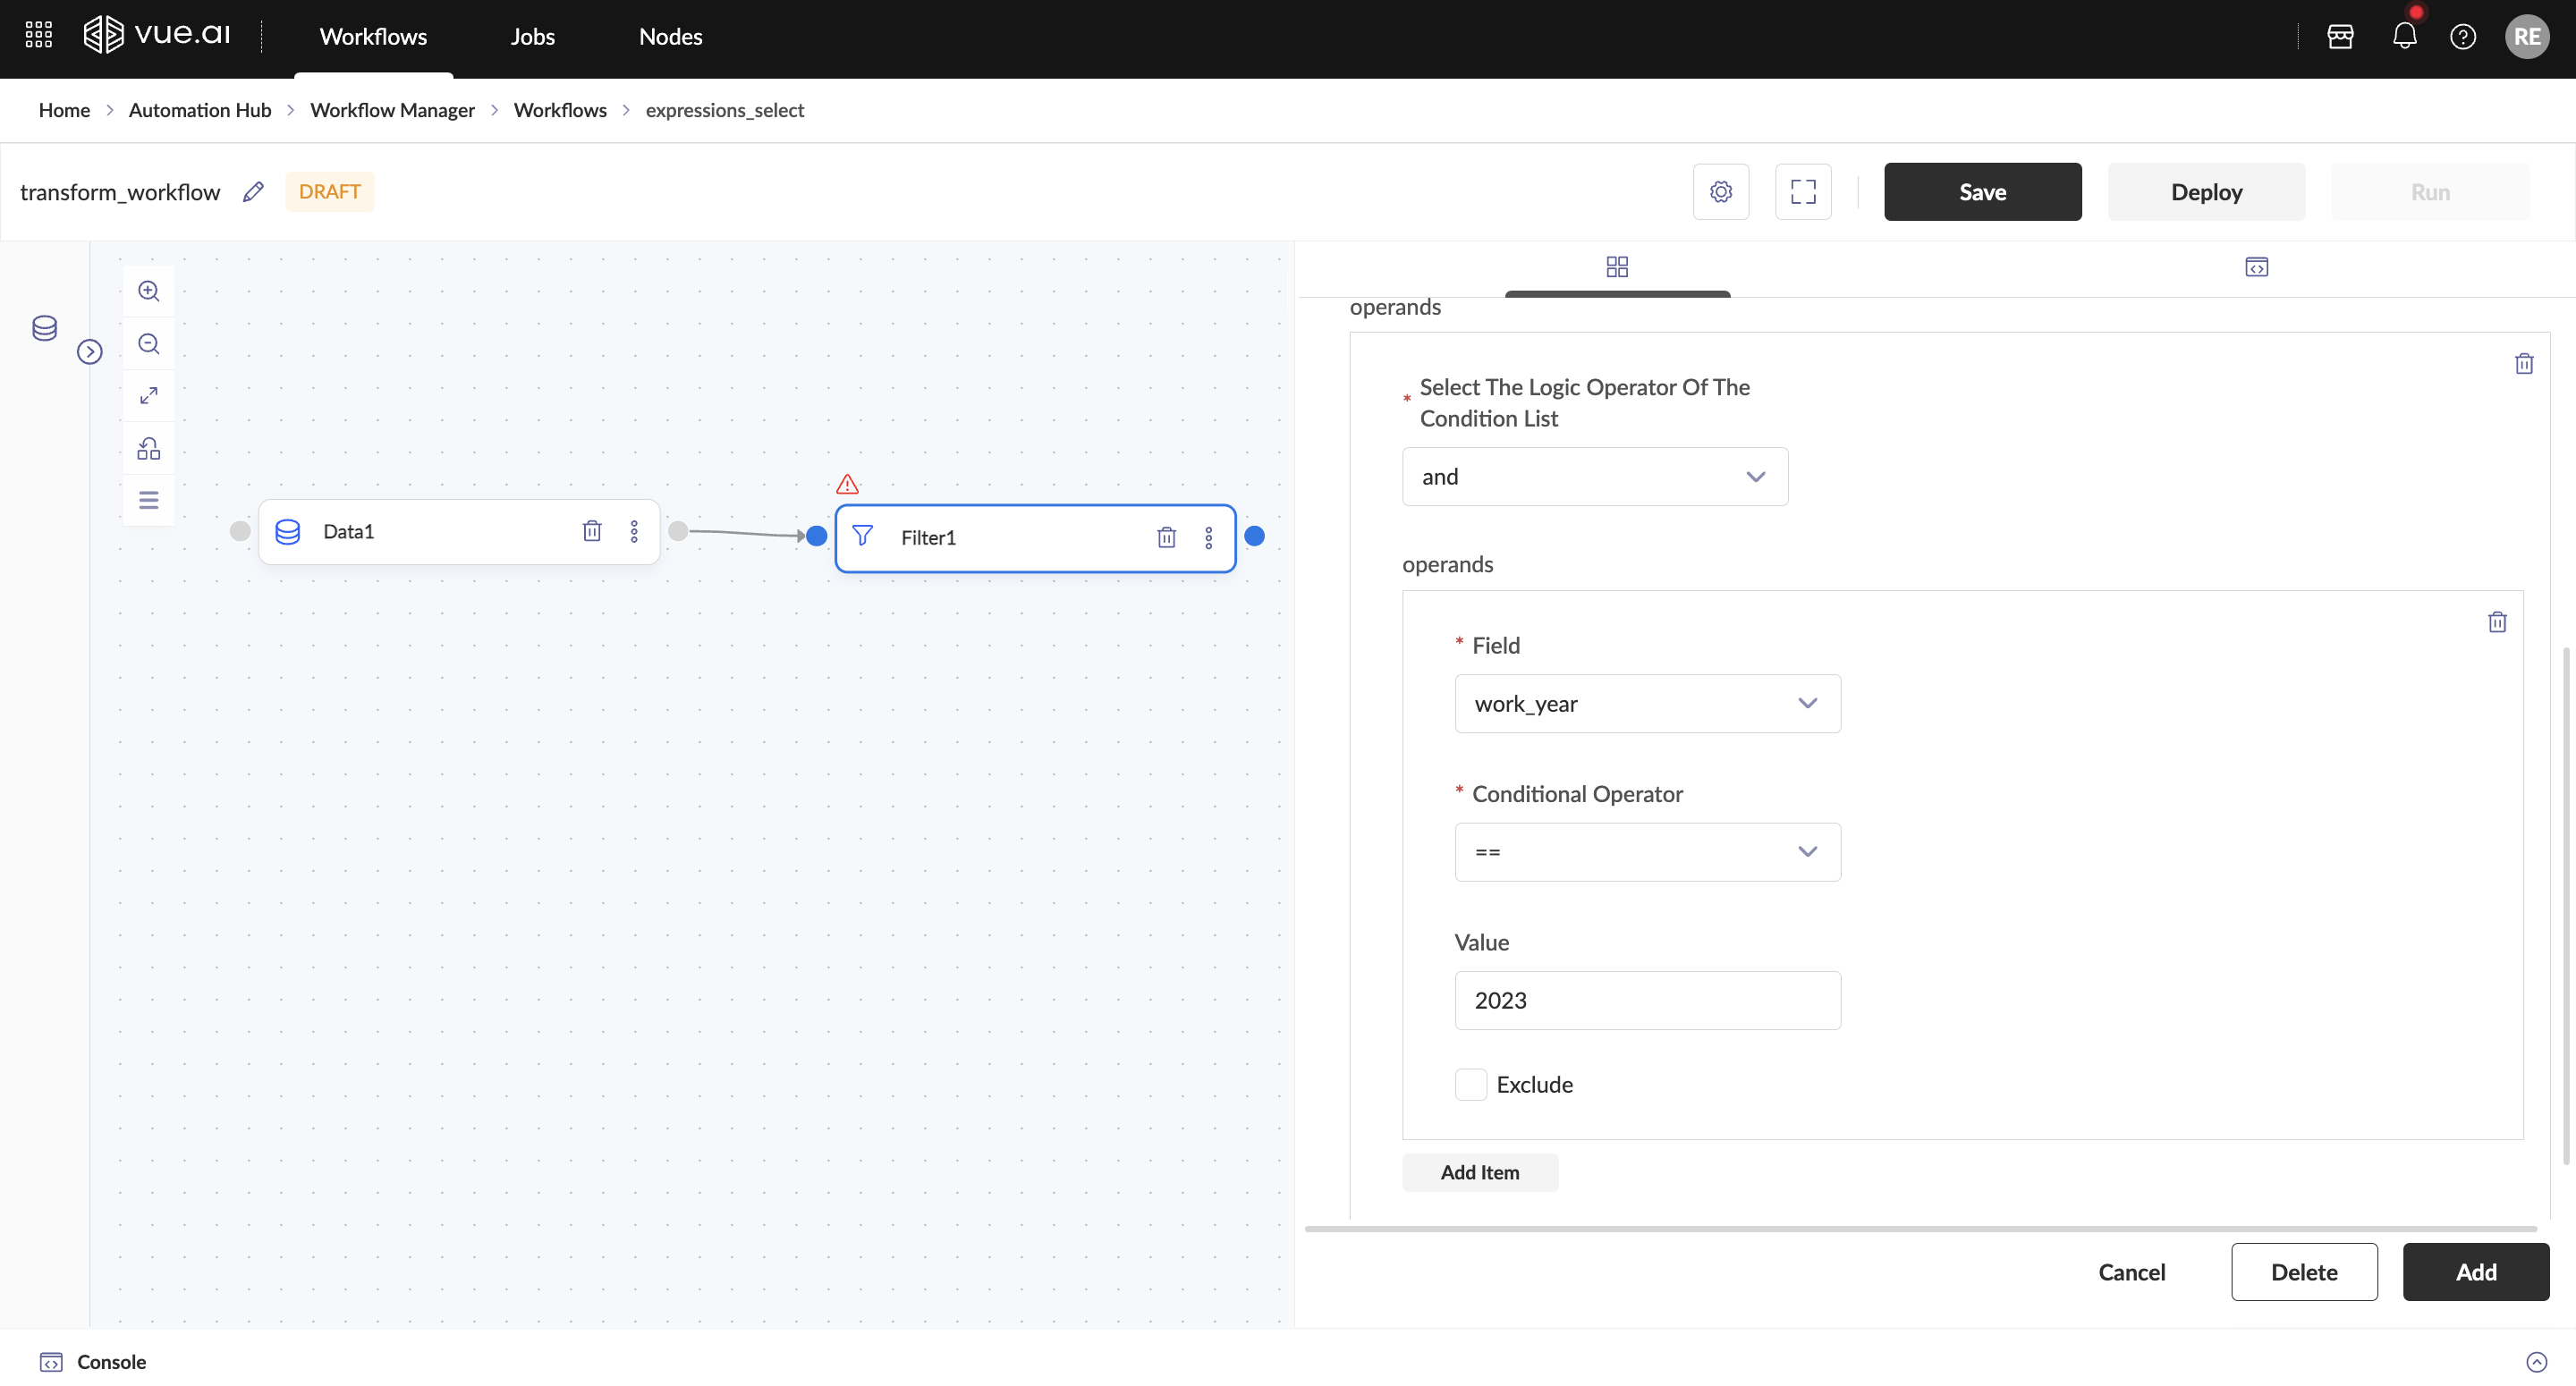
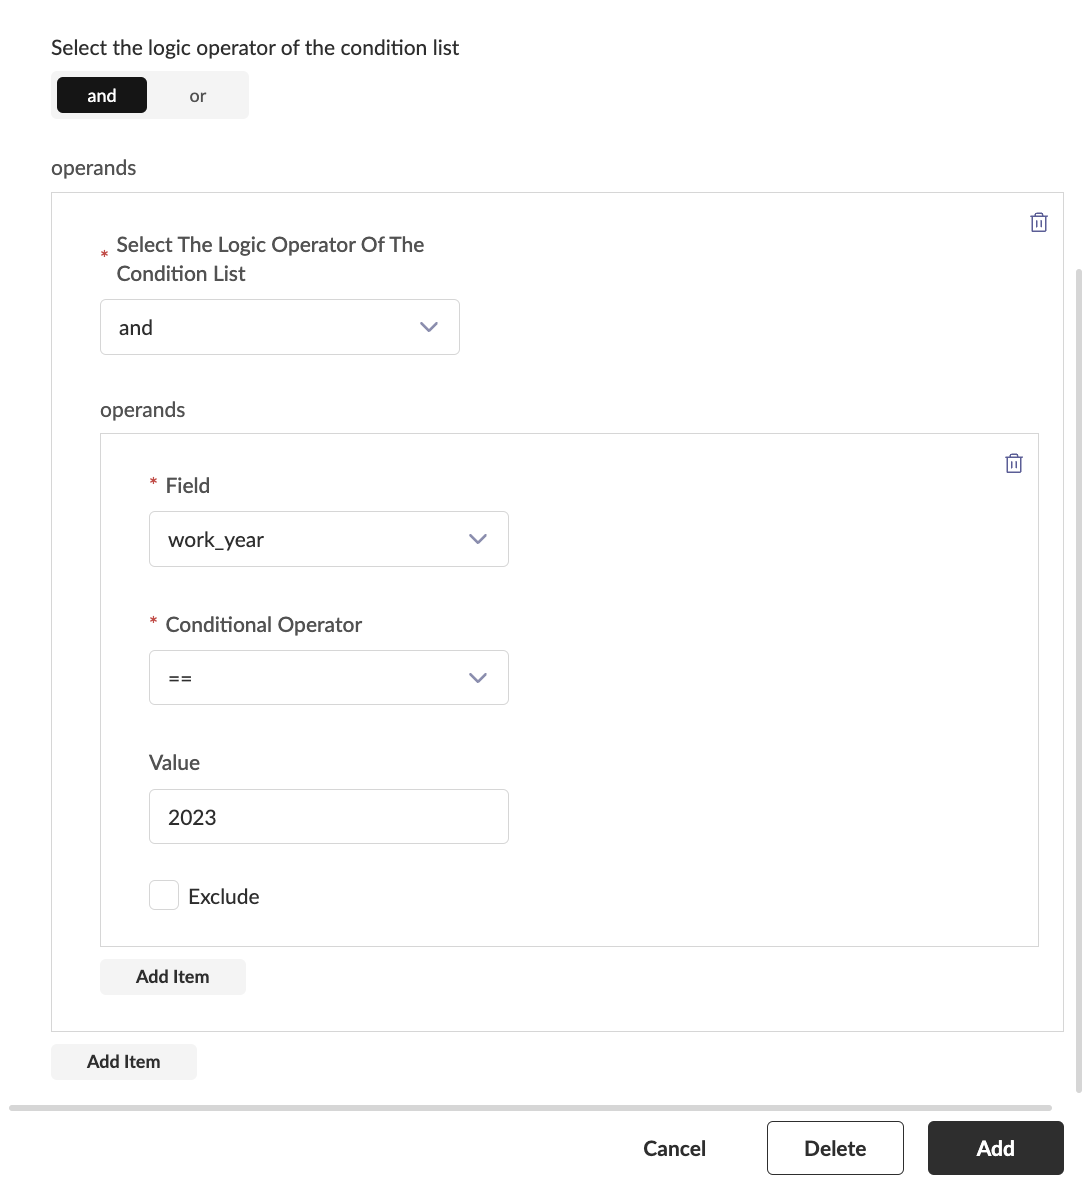
Available Operators for the Filter Node
The Filter Node supports a variety of operators to help define precise conditions for filtering rows in the dataset. Below is a list of available operators and their usage:
Comparison Operators:
| Operator | Description | Example |
|---|---|---|
== | Equal to | columnValue == 'value' |
!= | Not equal to | columnValue != 'value' |
> | Greater than | columnValue > 100 |
< | Less than | columnValue < 100 |
>= | Greater than or equal to | columnValue >= 50 |
<= | Less than or equal to | columnValue <= 50 |
Membership Operators:
| Operator | Description | Example |
|---|---|---|
in | Matches exact value | columnValue in 'A' |
isin | Checks if values are in a list or series | columnValue.isin(['value1', 'value2']) |
String Operators:
| Operator | Description | Example |
|---|---|---|
beginswith | Matches strings starting with a specified substring | columnValue.beginswith('prefix') |
endswith | Matches strings ending with a specified substring | columnValue.endswith('suffix') |
like | Matches strings containing a specific pattern | columnValue.like('%pattern%') |
Other Operators:
| Operator | Description | Example |
|---|---|---|
is_empty | Checks if the column contains empty or null values | columnValue.is_empty() |
These operators provide flexibility to filter rows based on numerical, categorical, or textual criteria, ensuring the dataset is tailored to specific needs.
In the Filter node, you can apply multiple conditions using a combination of AND and OR operators to refine your data selection.
How to Use AND & OR Conditions in the Filter Node
AND Condition All specified conditions must be met for a record to be included in the output.
Example: age > 25 AND salary > 50000 This filters records where age is greater than 25 and salary is greater than 50,000.
OR Condition At least one of the specified conditions must be met for a record to be included.
Example: city = 'New York' OR city = 'Los Angeles' This filters records where the city is either New York or Los Angeles.
Combining AND & OR Conditions You can group conditions using parentheses to control evaluation order.
Example: (age > 25 AND salary > 50000) OR (city = 'New York') This filters records where either:
- Age is greater than 25 and salary is greater than 50,000, or
- The city is New York.
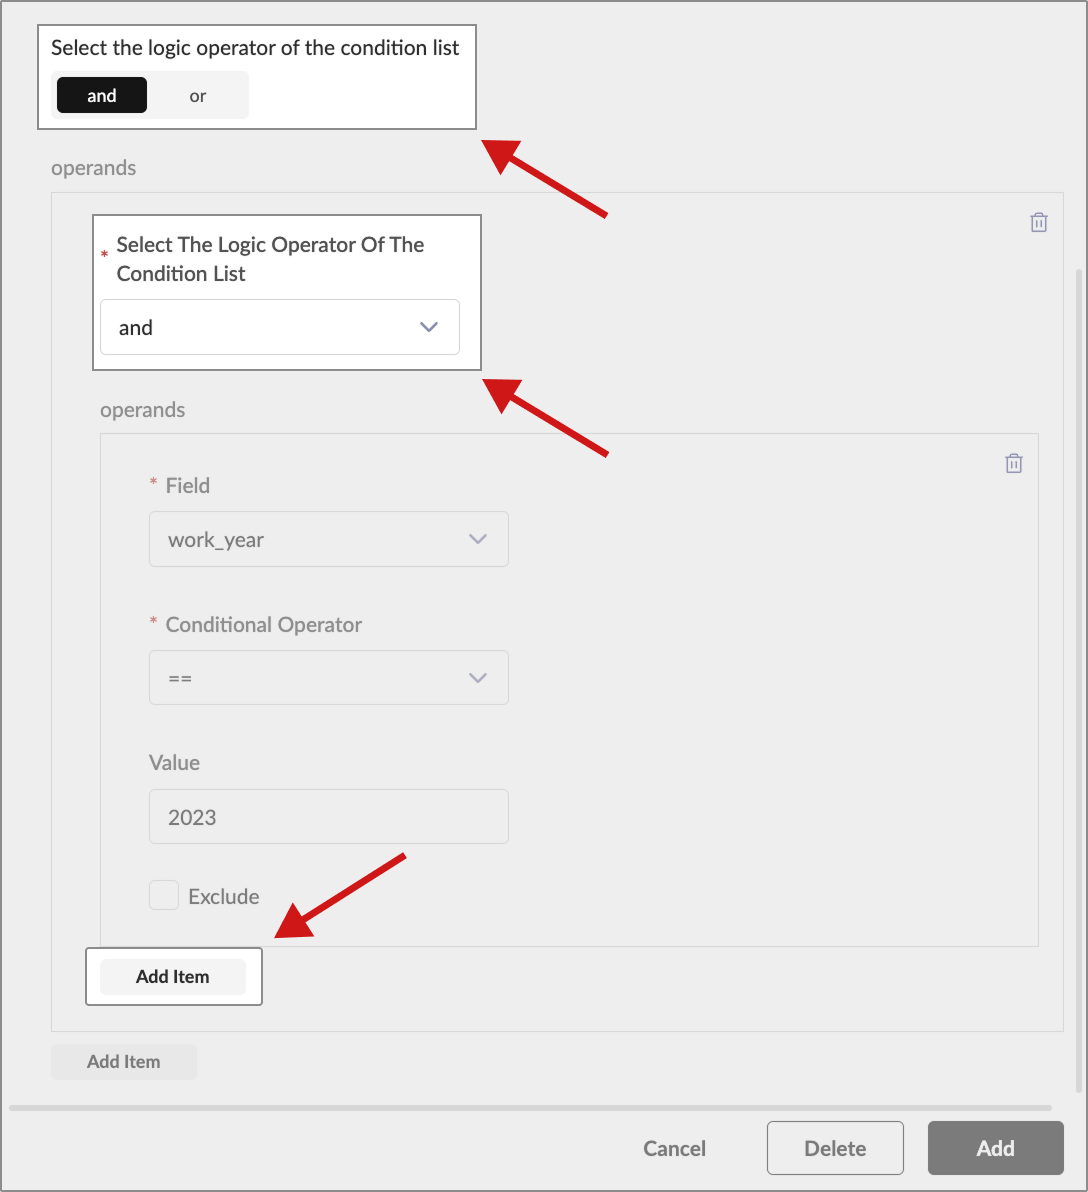
Example Usage
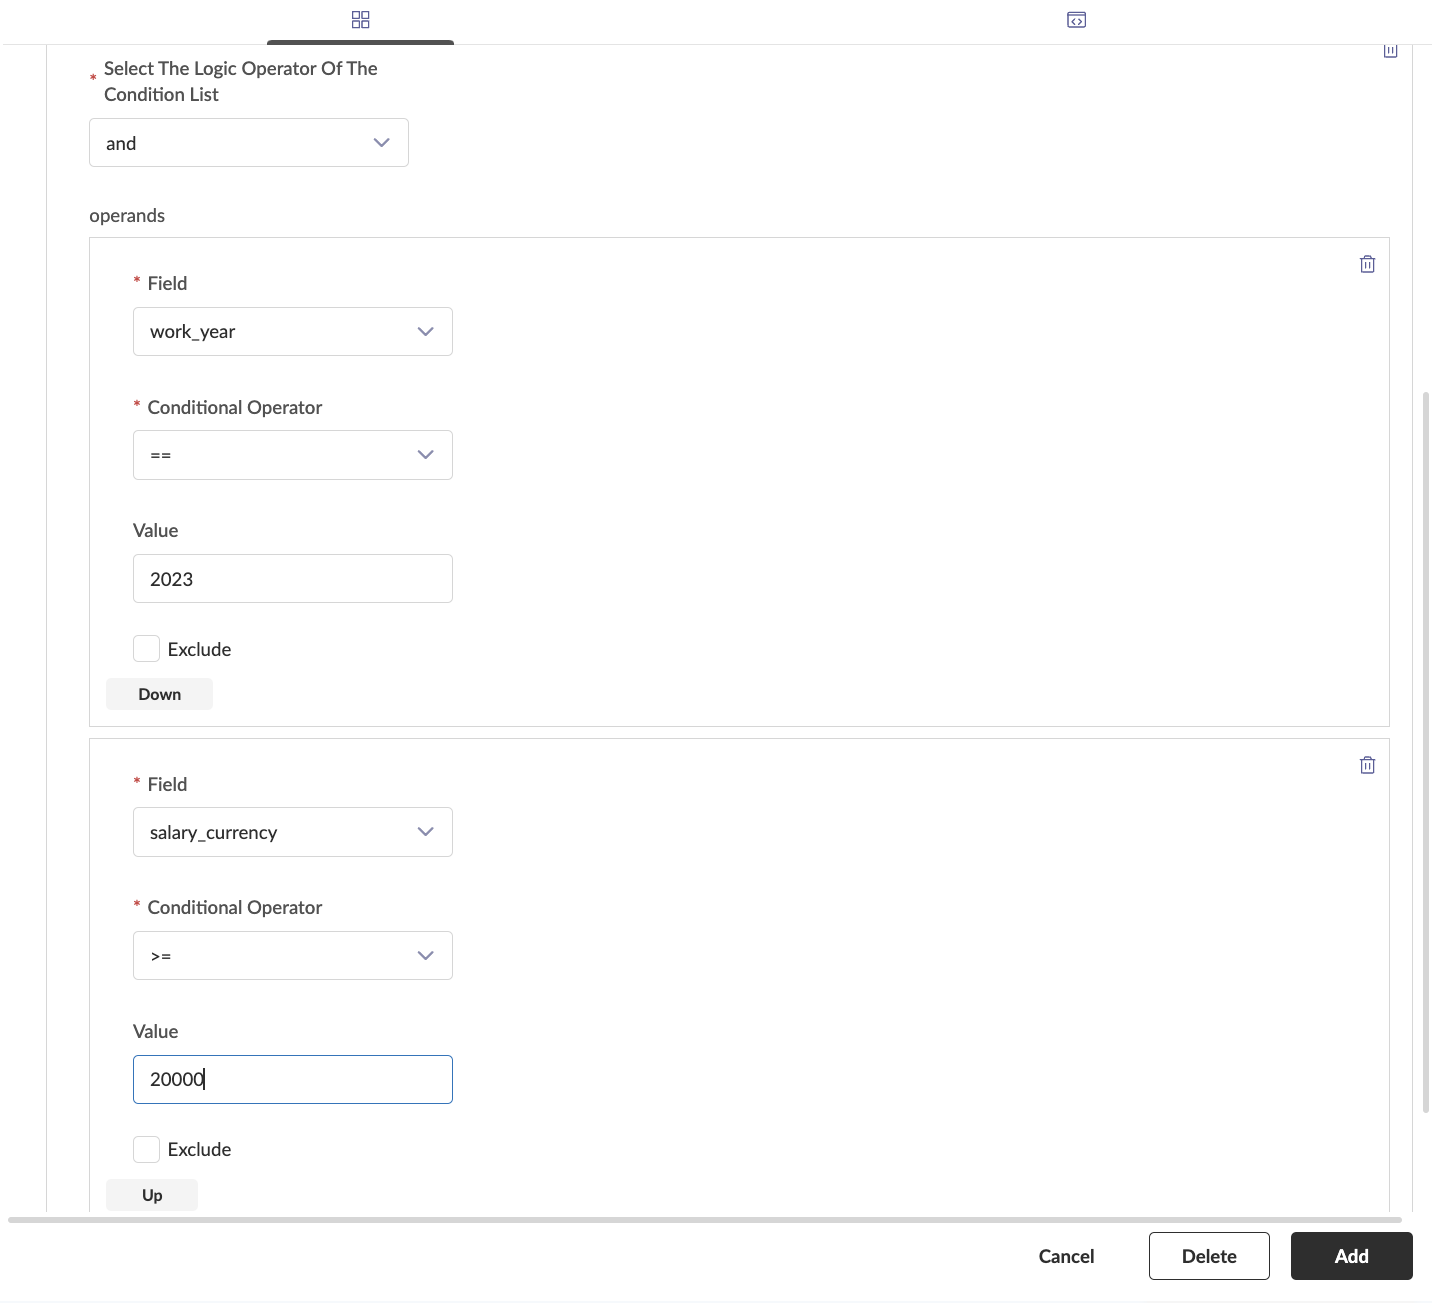
Troubleshooting
Common Issues and Solutions
Problem 1: Error while filtering a column Cause: Using numerical operator over a categorical column. Solution:
- Ensure that numerical columns are filtered out using numerical operators, categorical columns with membership or string operators.
Problem 2: No results after filtering Cause: No valid column value added to filter out the data. Solution:
- Ensure a valid column value is added to filter out the data.
Problem 3: No values are listed in the Fields dropdown Cause: No Dataset Reader Node added before the Filter node and linked to it. Solution:
- Ensure that a Dataset Reader Node is added before the Filter node and it is linked to it.
Problem 4: Warning sign above the Filter Node Cause: Warning sign usually goes away upon successful addition of the Filter Node. Solution:
- Click on Add to add the node to the workflow, the warning sign will disappear.
Additional Information
No values are listed in the Fields dropdown. Ensure that a Dataset Reader Node is added before the Filter node and it is linked to it.
FAQ
Can NULL values in a column be filtered out?
Yes, NULL values can be filtered out by using the is_empty Conditional Operator.
What is the use of the two Select the logic operator of the condition list one as a button and another one as a dropdown?
Both represent how the filters need to work on data. The top-level logic operator allows the addition of a second filter if necessary. The next level logic operator allows the addition of more criteria for a single filter.
Can multiple filters be stacked?
Yes, multiple filters can be stacked by clicking the Add Item.
How can a Filter Node be deleted?
The bin button that is present in the Filter node can be used to delete a Filter Node.
Summary
This guide covered the following:
- How to filter a dataset using Filter Node.
OrderBy Node
Welcome to the OrderBy Node guide! This guide will assist users in understanding how to OrderBy one or more columns in ascending or descending order.
Expected Outcome: By the end of this guide, you will gain an understanding of the OrderBy Node and its applications in the Vue.ai platform.
Overview
The OrderBy Node is utilized to organize the dataset by arranging records in a specific order based on one or more columns. It enables efficient data structuring by OrderBying values in ascending or descending order, ensuring consistency and ease of analysis. This node is essential for data preparation, making it easier to identify patterns, optimize workflows, and integrate with other processing nodes.
Prerequisites For a better understanding of Transform Nodes, it is recommended to review the Getting Started with Workflows documentation.
Navigation To begin, the following path should be navigated: Home/Landing Page → Automation Hub → Workflow Manager → Workflows → New Workflow
Step-by-Step Instructions
- Load a dataset by adding the Dataset Reader Node to the workspace.
- Drag and drop the OrderBy node under the Transform node section in the left pane.
- Select the column(s) to OrderBy by from the Field dropdown.
- Choose the OrderBy Order (Ascending or Descending) for each selected column.
- Click Add Item to include multiple OrderBying criteria.

Utilize the Add Item option to incorporate additional OrderBy options.
Example Usage

Troubleshooting
Common Issues and Solutions
Problem 1: Error After Adding a OrderBy Node Cause: OrderBy type not selected after selecting the OrderBy column. Solution:
- Ensure the OrderBy type is selected after choosing the OrderBy column.
Problem 2: No Values Listed in the Fields Dropdown Cause: Dataset Reader Node not added before the OrderBy Node or not linked to it. Solution:
- Ensure a Dataset Reader Node is added before the OrderBy Node and it is linked to it.
Problem 3: Warning Sign Above the OrderBy Node Cause: Warning sign appears after adding the OrderBy Node. Solution:
- The warning sign usually disappears upon successful addition of the OrderBy Node. Click on Add to add the node to the workflow, the warning sign will disappear.
Additional Information
No values are listed in the Fields dropdown. Ensure that a Dataset Reader Node is added before the OrderBy Node and it is linked to it.
FAQ
Can multiple columns be OrderByed?
Yes, multiple columns can be OrderByed by adding the required columns one by one with their OrderBy orders by clicking on Add Item.
How can a OrderBy Node be deleted?
The bin button that is present in the OrderBy node can be used to delete a OrderBy Node.
Summary
This guide covered how to OrderBy one or more columns from a dataset using OrderBy Node in the Vue.ai Platform.
GroupBy Node
Welcome to the GroupBy Node guide! This guide will assist in aggregating data based on one or more columns and summarizing large datasets by grouping similar values.
Expected Outcome: By the end of this guide, you will gain an understanding of the GroupBy Node and their applications in Vue.ai platform.
Overview
The GroupBy Node is utilized to aggregate and summarize data by grouping it based on one or more columns. This node aids in organizing data into meaningful groups and applying aggregate functions to generate insights, such as totals, averages, counts, or other statistical measures. It is essential for analyzing data at a grouped level and preparing it for further processing or visualization.
Prerequisites For a better understanding of Transform Nodes, it is recommended to review the Getting Started with Workflows documentation.
Navigation To begin, the following path should be navigated: Home/Landing Page → Automation Hub → Workflow Manager → Workflows → New Workflow
Step-by-Step Instructions
- Load a dataset by adding the Dataset Reader Node to the workspace.
- Drag and drop the GroupBy node under the Transform node section in the left pane.
- Select the columns by which the data should be grouped from the Columns dropdown. These columns will serve as the keys for creating groups.
- Select a column that need to be aggregated from the Field dropdown.
- Select an aggregation logic (e.g., sum, average, count, max, min, etc.) to be applied for the selected column from the Aggregation dropdown.
- Rename aggregated columns for clarity in the Alias text box.
- Click Add Item to add multiple aggregations for various columns as needed.
Alias Field is mandatory for groupby Aggregation
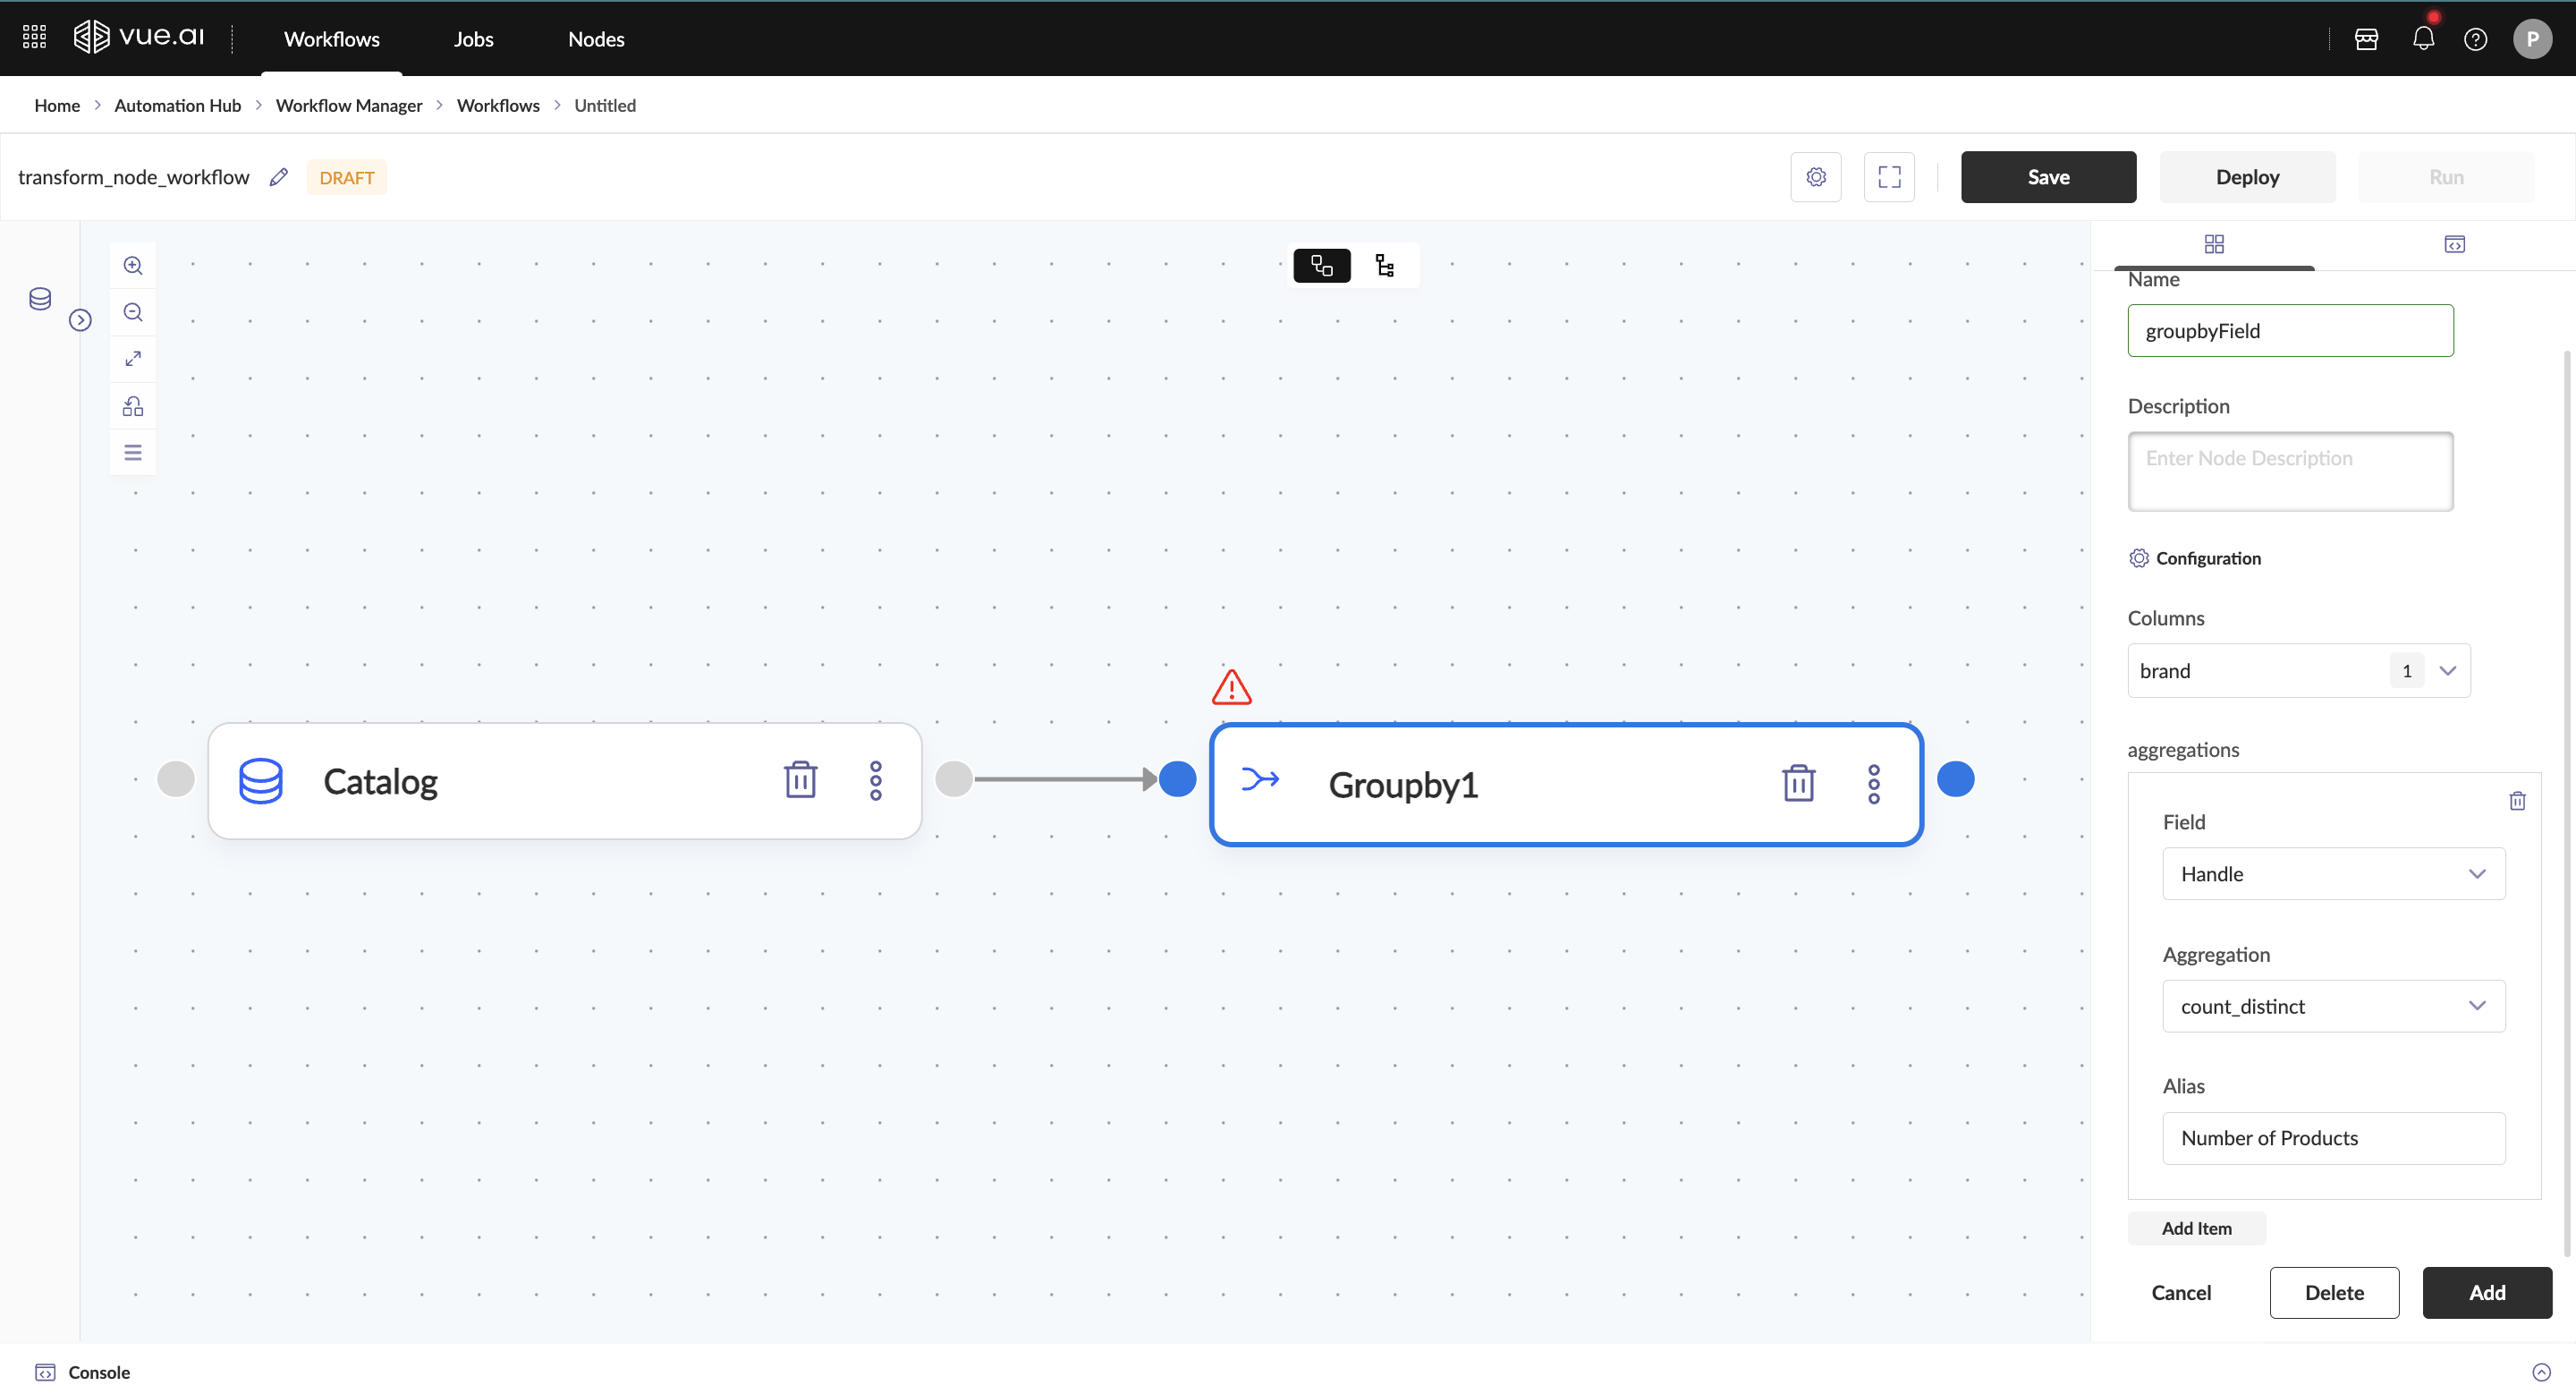
Available Aggregation Functions:
- Count: Counts the number of records in each group
- Sum: Calculates the total sum of values in each group
- Average (Mean): Computes the average value for each group
- Min: Finds the minimum value in each group
- Max: Finds the maximum value in each group
- First: Returns the first value in each group
- Last: Returns the last value in each group
Utilize the Add Item option to incorporate additional aggregation functions for different columns.
Example Usage

Troubleshooting
Common Issues and Solutions
Problem 1: No Values Listed in the Fields or Columns Dropdown Cause: Dataset Reader Node not added before the GroupBy Node or not linked to it. Solution:
- Ensure a Dataset Reader Node is added before the GroupBy Node and it is linked to it.
Problem 2: Warning Sign Above the GroupBy Node Cause: Warning sign appears after adding the GroupBy Node. Solution:
- The warning sign usually disappears upon successful addition of the GroupBy Node. Click on Add to add the node to the workflow.
Additional Information
Ensure that a Dataset Reader Node is added before the GroupBy Node and it is linked to it if no values are listed in the Fields or Columns dropdown.
FAQ
Can multiple columns be used for grouping?
Yes, multiple columns can be selected for grouping to create more granular groups.
Can multiple aggregations be applied to the same or different columns?
Yes, multiple aggregations can be applied by clicking Add Item and configuring additional aggregation functions.
How can a GroupBy Node be deleted?
The bin button that is present in the GroupBy node can be used to delete a GroupBy Node.
Summary
This guide covered how to aggregate and summarize data by grouping it based on one or more columns using GroupBy Node.
Partition Node
Welcome to the Partition Node guide! This guide will assist users in dividing a dataset into multiple subsets based on the values of a specific column.
Expected Outcome: By the end of this guide, you will gain an understanding of the Partition Node and its applications in the Vue.ai platform.
Overview
The Partition Node is utilized to divide a dataset into smaller, manageable subsets based on the unique values of a specified column. This node enables efficient data organization by creating separate datasets for each distinct value, making it easier to process, analyze, or route data to different workflows. It is essential for scenarios where data needs to be segmented for specialized processing or analysis.
Prerequisites For a better understanding of Transform Nodes, it is recommended to review the Getting Started with Workflows documentation.
Navigation To begin, the following path should be navigated: Home/Landing Page → Automation Hub → Workflow Manager → Workflows → New Workflow
Step-by-Step Instructions
- Load a dataset by adding the Dataset Reader Node to the workspace.
- Drag and drop the Partition node under the Transform node section in the left pane.
- Select the column to partition by from the Partition Column dropdown. This column's unique values will determine how the data is divided.
- The node will automatically create separate outputs for each unique value in the selected column.
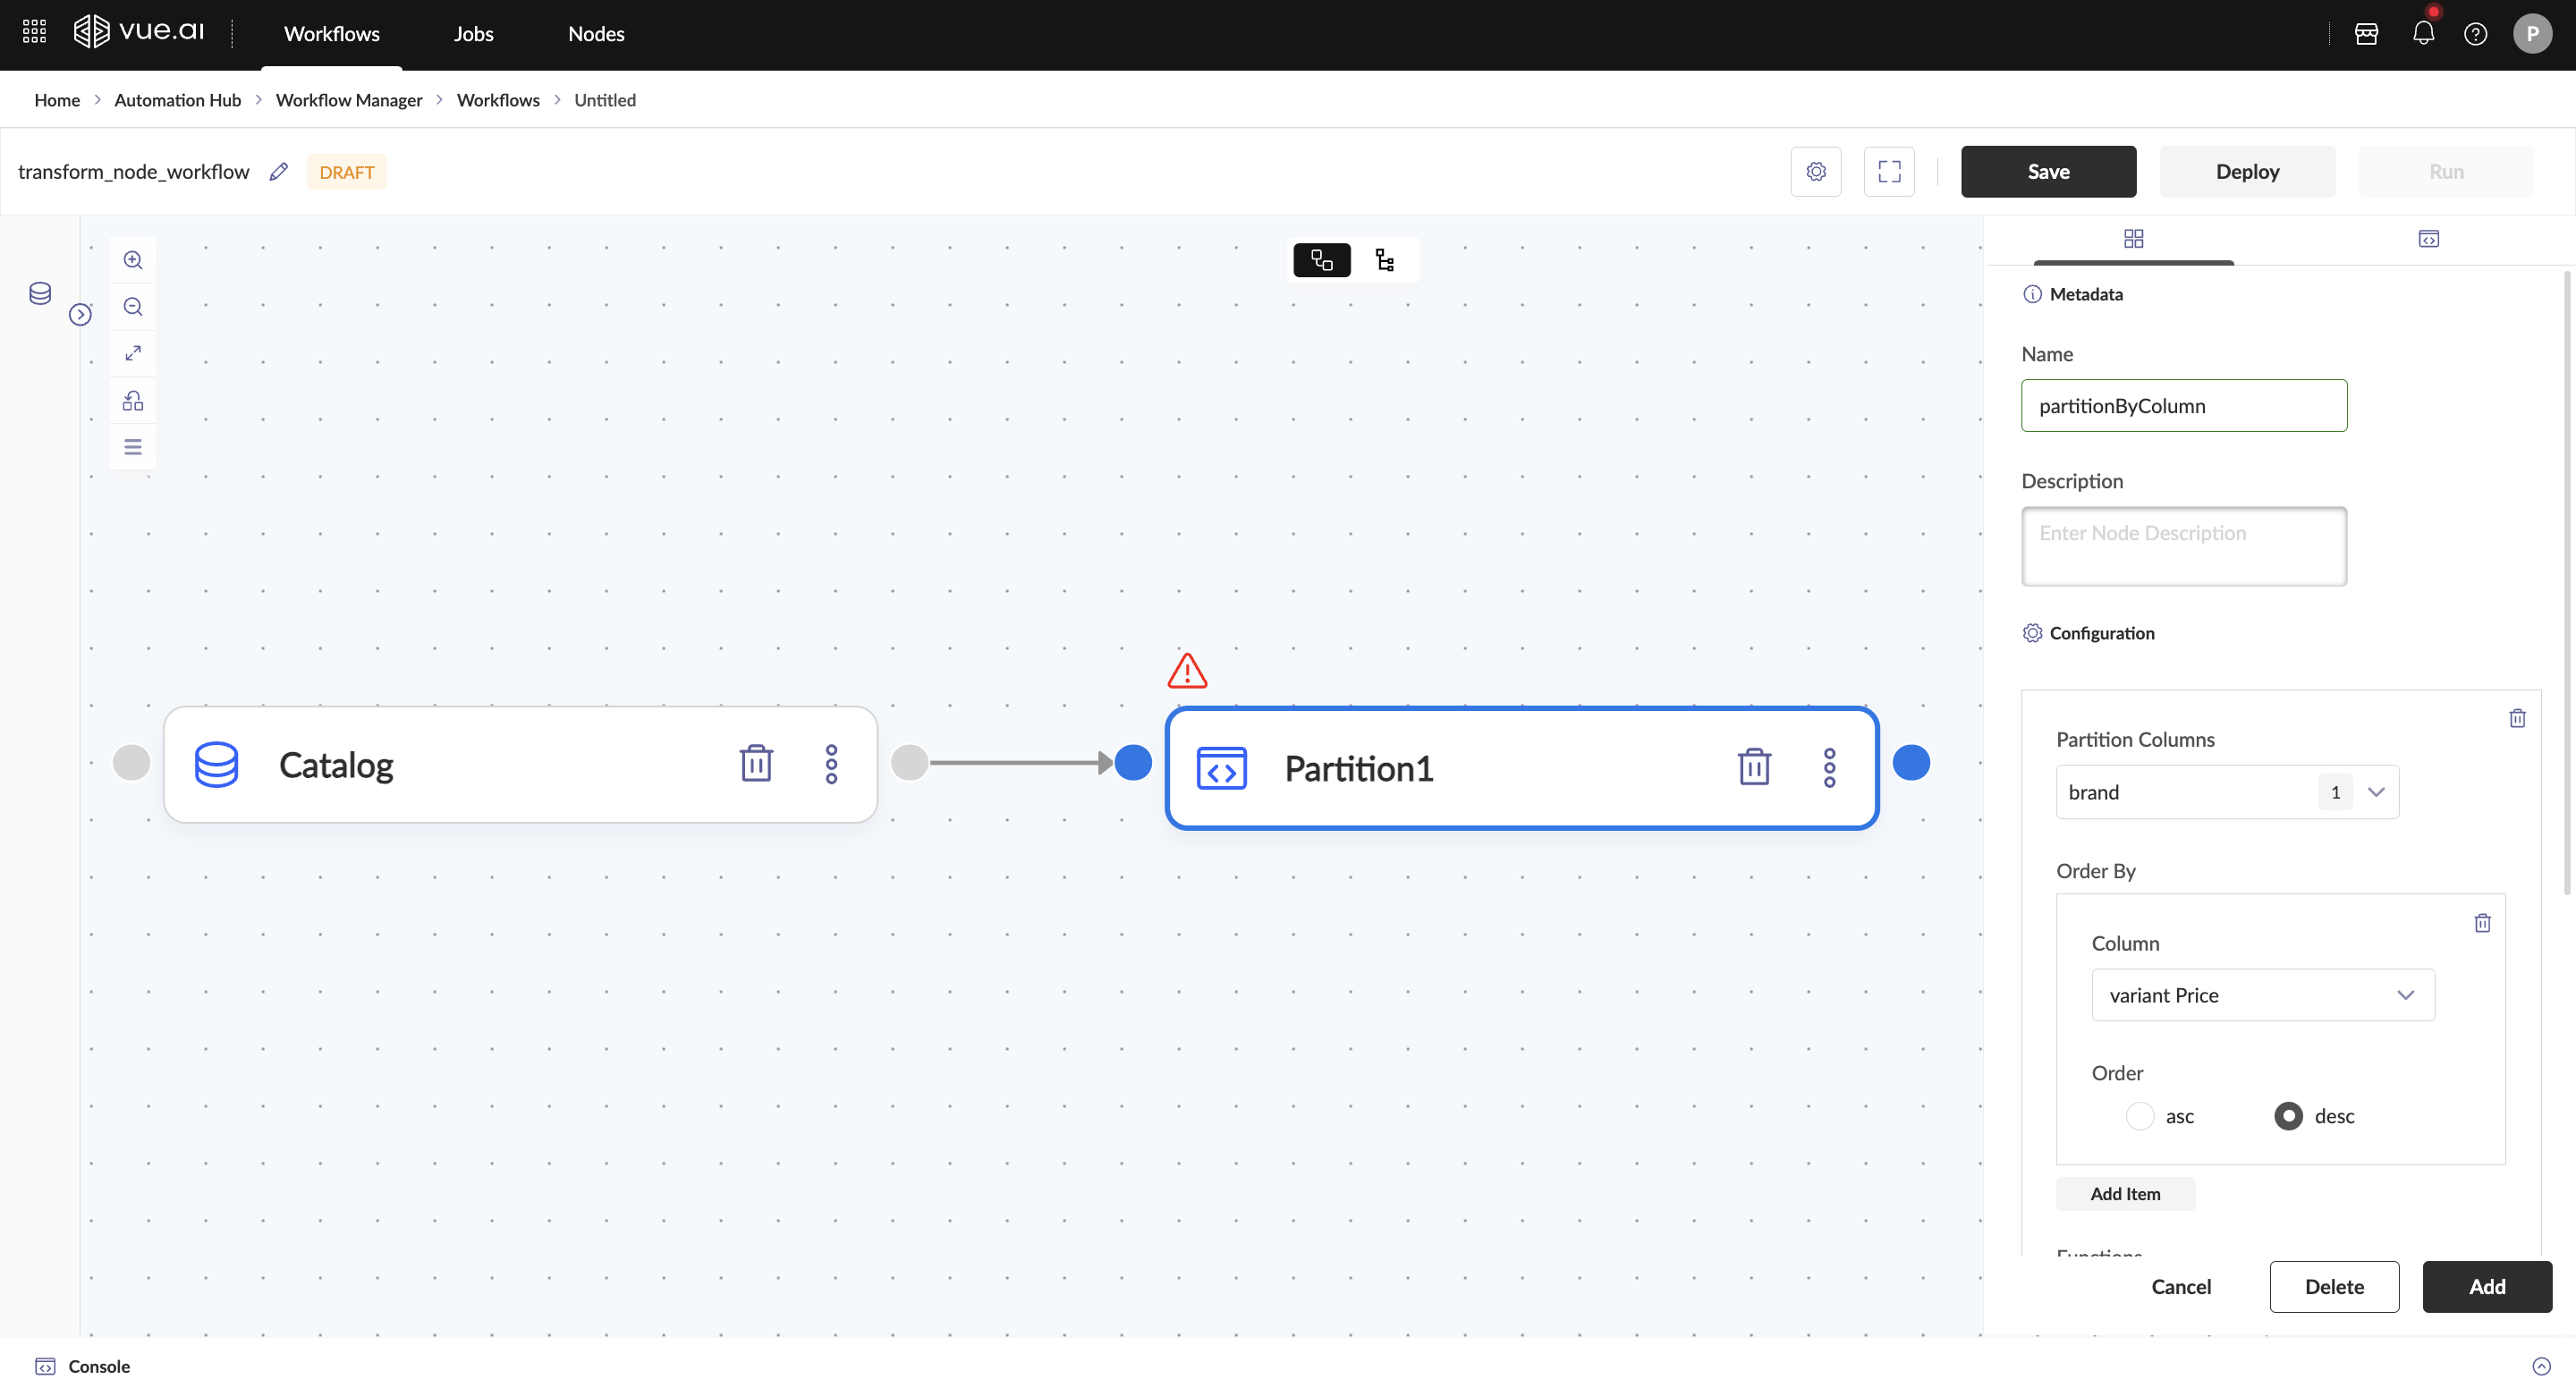
Use Cases for Partition Node:
- Data Segmentation: Divide customer data by region, category, or status
- Workflow Routing: Route different data types to specialized processing workflows
- Parallel Processing: Enable concurrent processing of data subsets
- Analysis Preparation: Prepare data for group-specific analysis or reporting
Example Usage

Troubleshooting
Common Issues and Solutions
Problem 1: No Values Listed in the Partition Column Dropdown Cause: Dataset Reader Node not added before the Partition Node or not linked to it. Solution:
- Ensure a Dataset Reader Node is added before the Partition Node and it is linked to it.
Problem 2: Warning Sign Above the Partition Node Cause: Warning sign appears after adding the Partition Node. Solution:
- The warning sign usually disappears upon successful addition of the Partition Node. Click on Add to add the node to the workflow.
Problem 3: Too Many Partitions Created Cause: Selected column has too many unique values. Solution:
- Consider using a different column with fewer unique values or preprocessing the data to reduce distinct values.
Additional Information
The Partition Node creates separate outputs for each unique value in the selected column. Ensure the selected column has an appropriate number of distinct values to avoid performance issues.
FAQ
How many partitions can be created?
The number of partitions depends on the number of unique values in the selected partition column. Be mindful of performance when dealing with columns having many distinct values.
Can multiple columns be used for partitioning?
No, the Partition Node works with one column at a time. For multi-column partitioning, consider preprocessing the data to create a combined column.
How can a Partition Node be deleted?
The bin button that is present in the Partition node can be used to delete a Partition Node.
Summary
This guide covered how to divide a dataset into multiple subsets based on column values using the Partition Node.
Join Node
Welcome to the Join Node guide! This guide will assist users to merge two datasets into a single dataset based on a common key.
Expected Outcome: By the end of this guide, you will gain an understanding of the Join Node and its applications in the Vue.ai platform.
Overview
The Join Node is utilized for merging multiple datasets based on a common key. This allows for the combination of relevant information from different sources into a single dataset. It ensures seamless data integration by aligning rows based on matching key values. This node is essential for enriching datasets, performing relational operations, and enabling comprehensive analysis.
Prerequisites For a better understanding of Transform Nodes, please review the Getting Started with Workflows documentation.
Navigation To begin, the following path should be navigated: Home/Landing Page → Automation Hub → Workflow Manager → Workflows → New Workflow
Step-by-Step Instructions
- Load two datasets by adding the Dataset Reader Node to the workspace.
- Drag and drop the Join node under the Transform node section in the left pane.
- Link the two datasets to the Join Node
- The Left Dataset and Right Dataset fields are automatically filled based on the selected datasets and how were they given as inputs to join node
- Select the type of join (eg. Left, Inner, Outer, Right, Semi, Left_anti, Right_anti, Cross) from the Join Type dropdown
- Select a column from left dataset to be used as the join key from the Left Field dropdown under query section
- Select a column from right dataset to be used as the join key from the Right Field dropdown under query section
- Select the join operator to be used (e.g., Equals, Greater Than, Less Than, etc.) from the Join Operator dropdown
- Click Add Item to include additional join conditions.
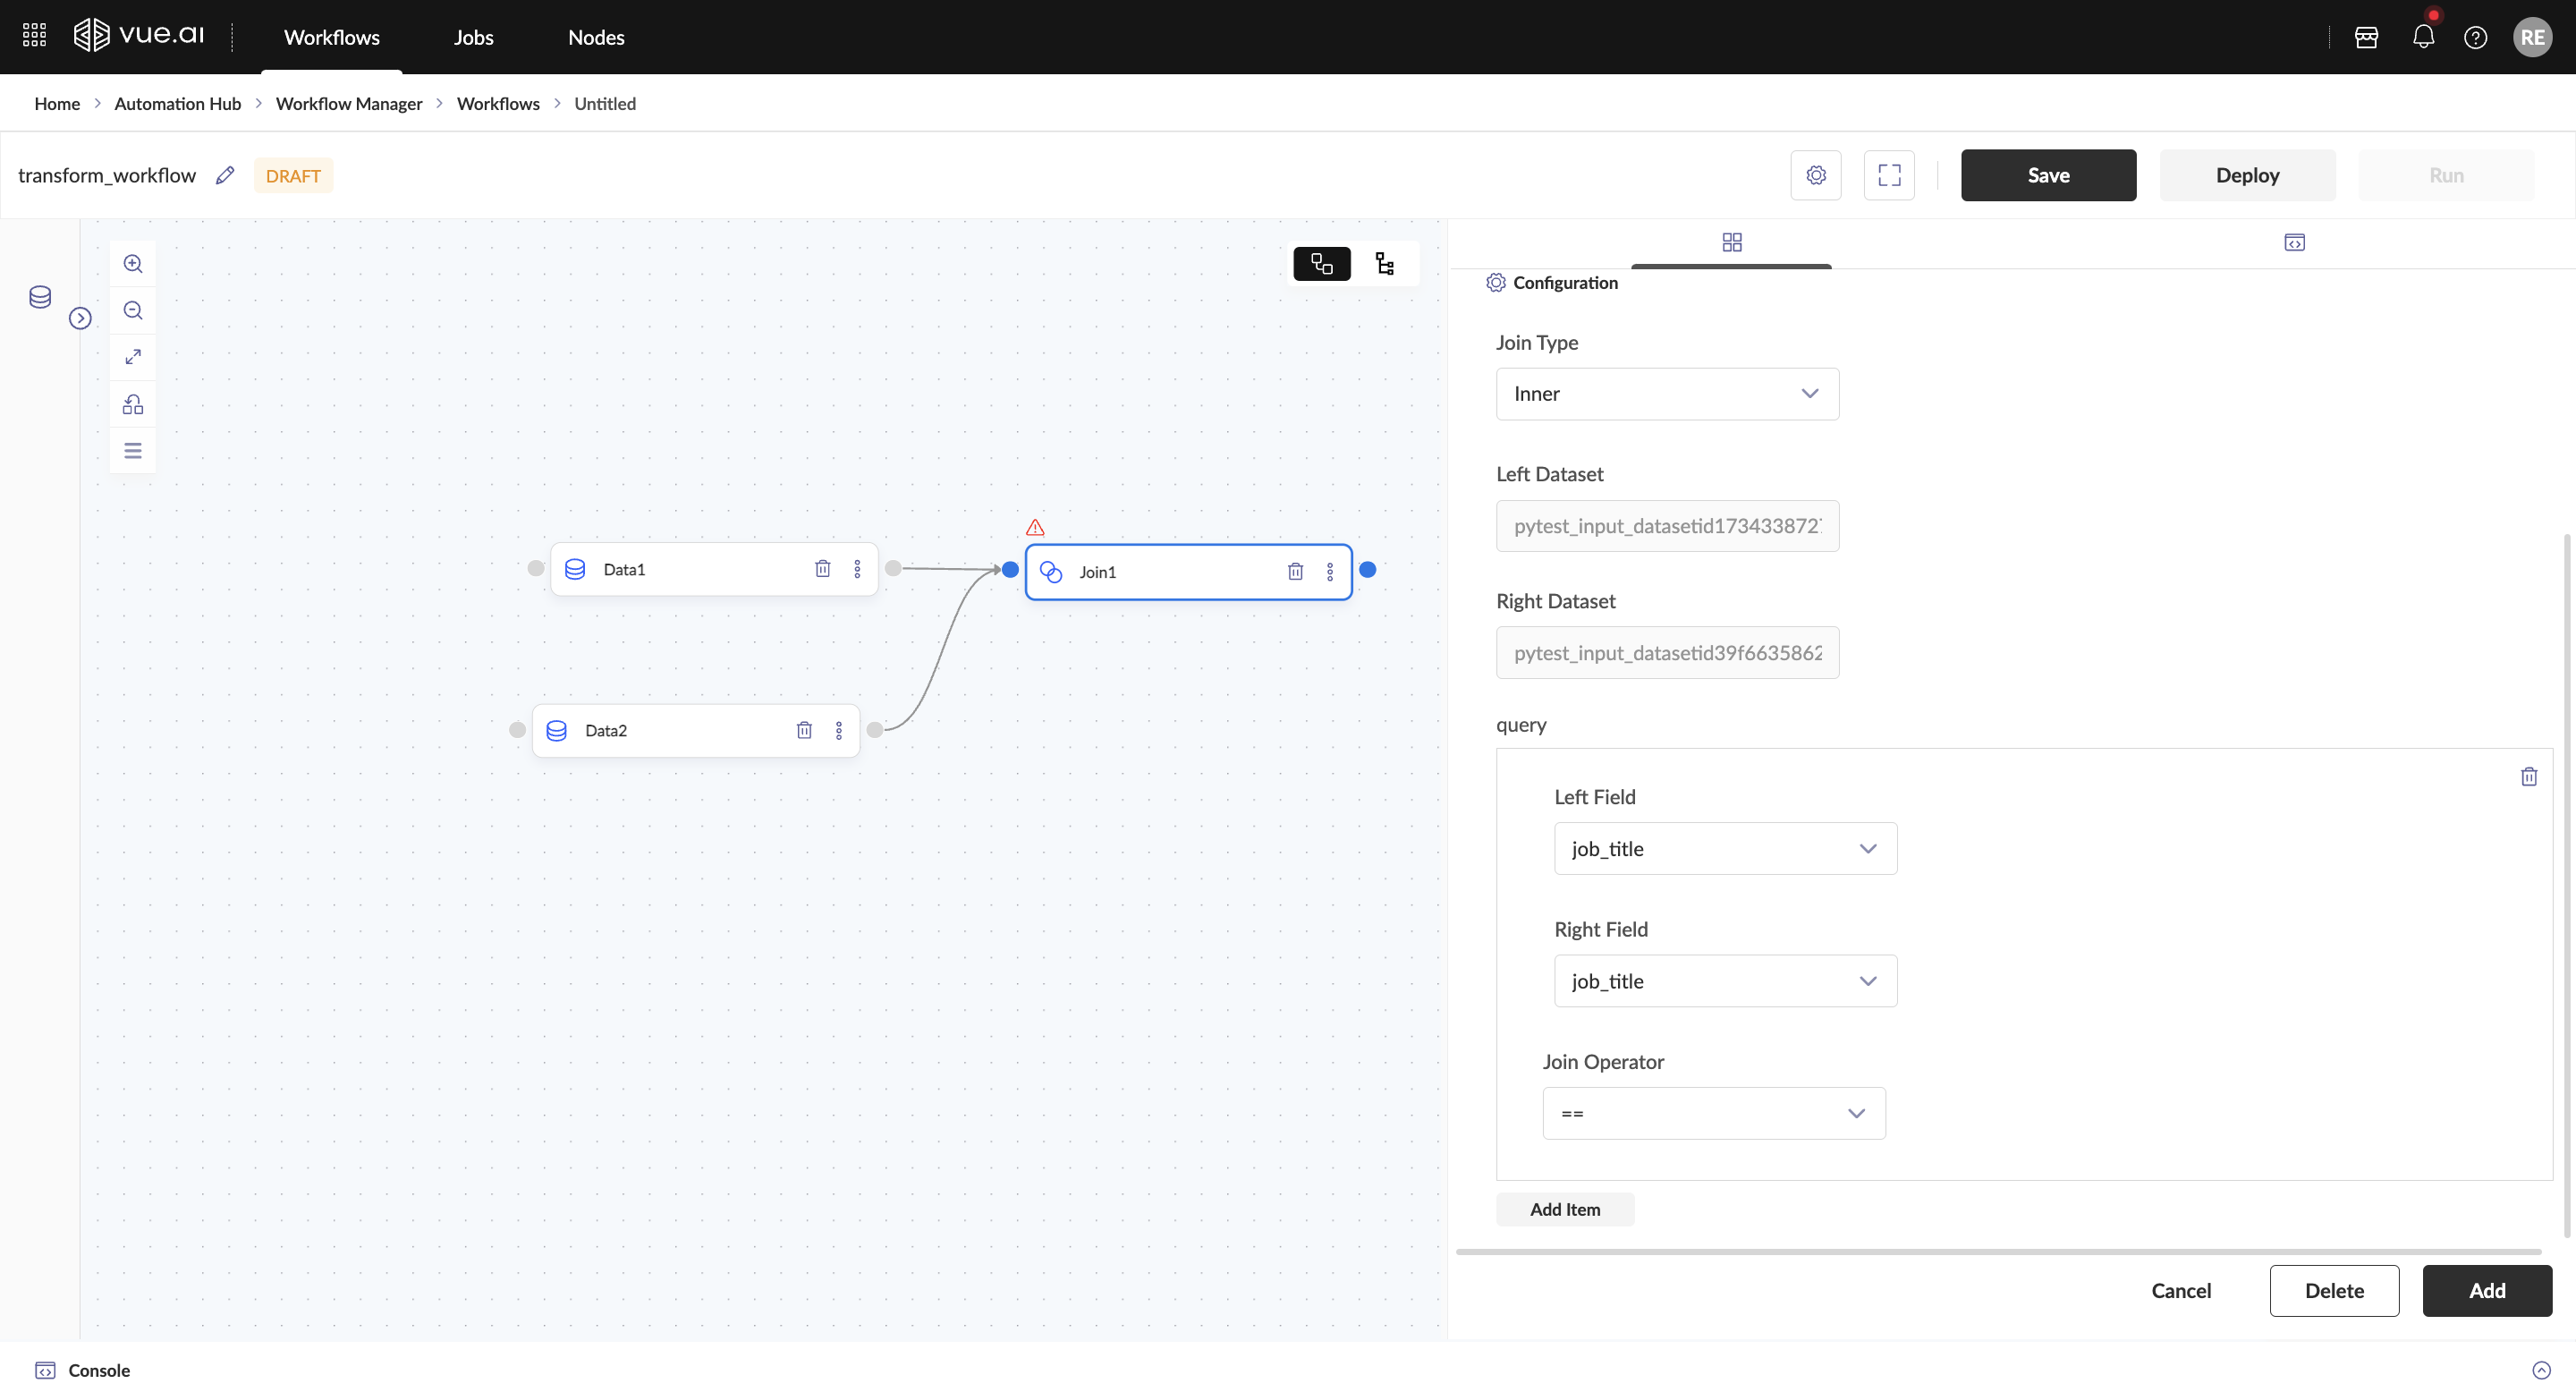
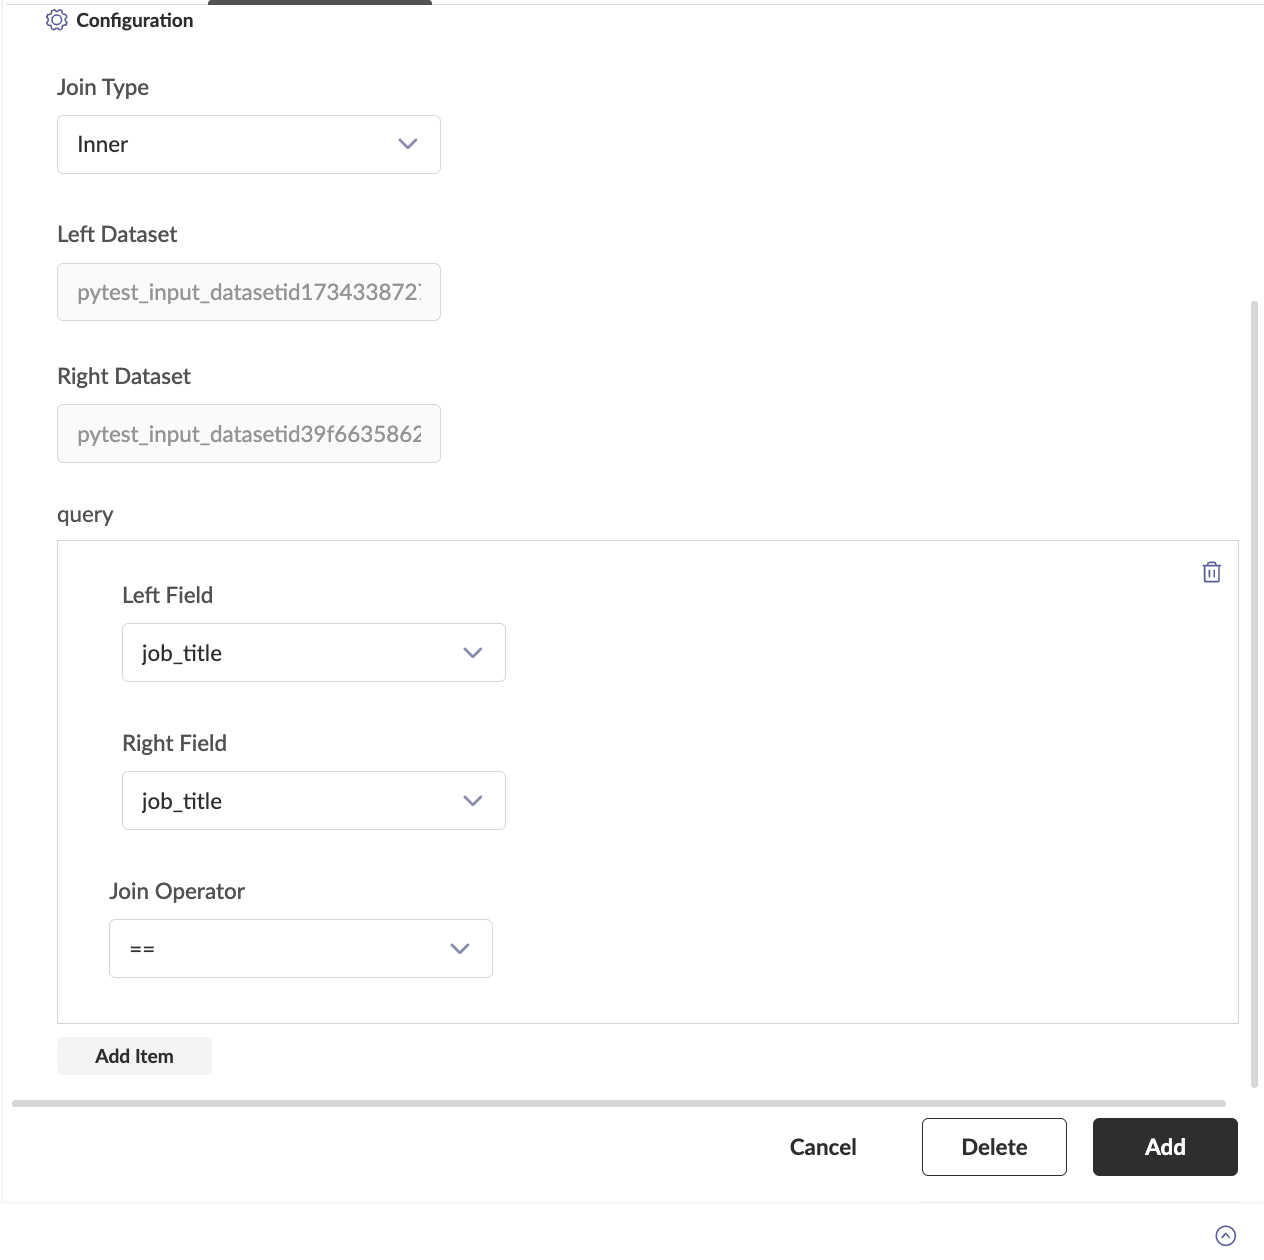
Available Operators for the Join Node are:
| Operator | Description | Example |
|---|---|---|
== | Equal to | Left Dataset Column Value == Right Dataset Column Value |
!= | Not equal to | Left Dataset Column Value != Right Dataset Column Value |
> | Greater than | Left Dataset Column Value > Right Dataset Column Value |
< | Less than | Left Dataset Column Value < Right Dataset Column Value |
>= | Greater than or equal to | Left Dataset Column Value >= Right Dataset Column Value |
<= | Less than or equal to | Left Dataset Column Value <= Right Dataset Column Value |
Utilize the Add Item option to incorporate additional join conditions effectively.
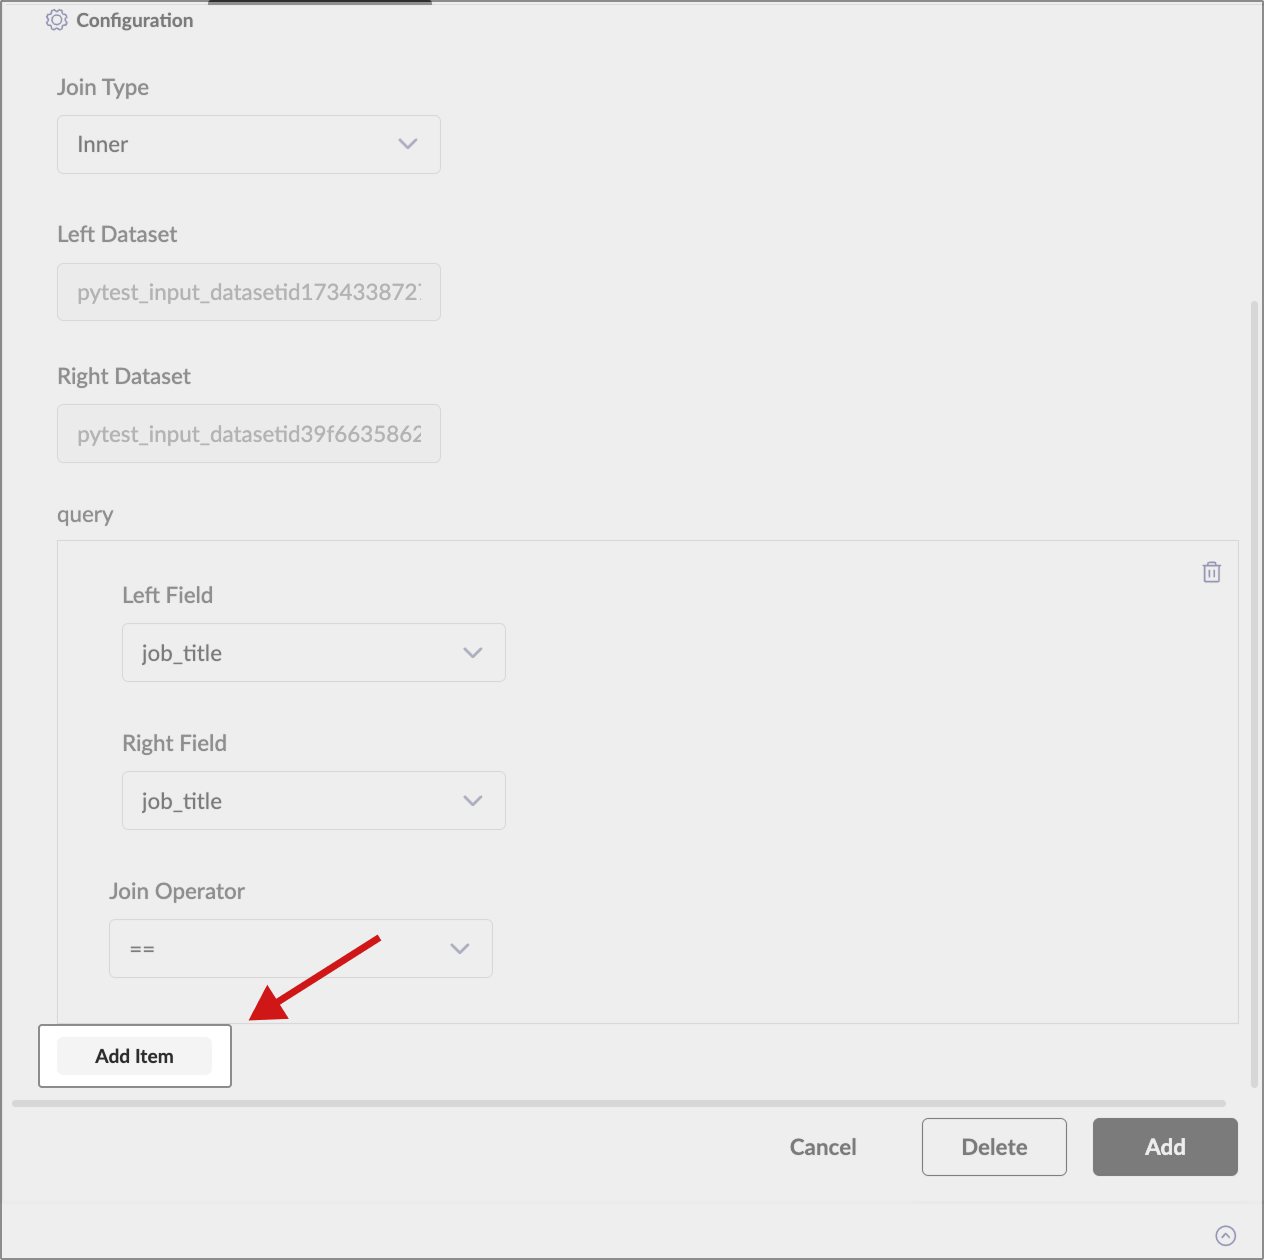
Example Usage
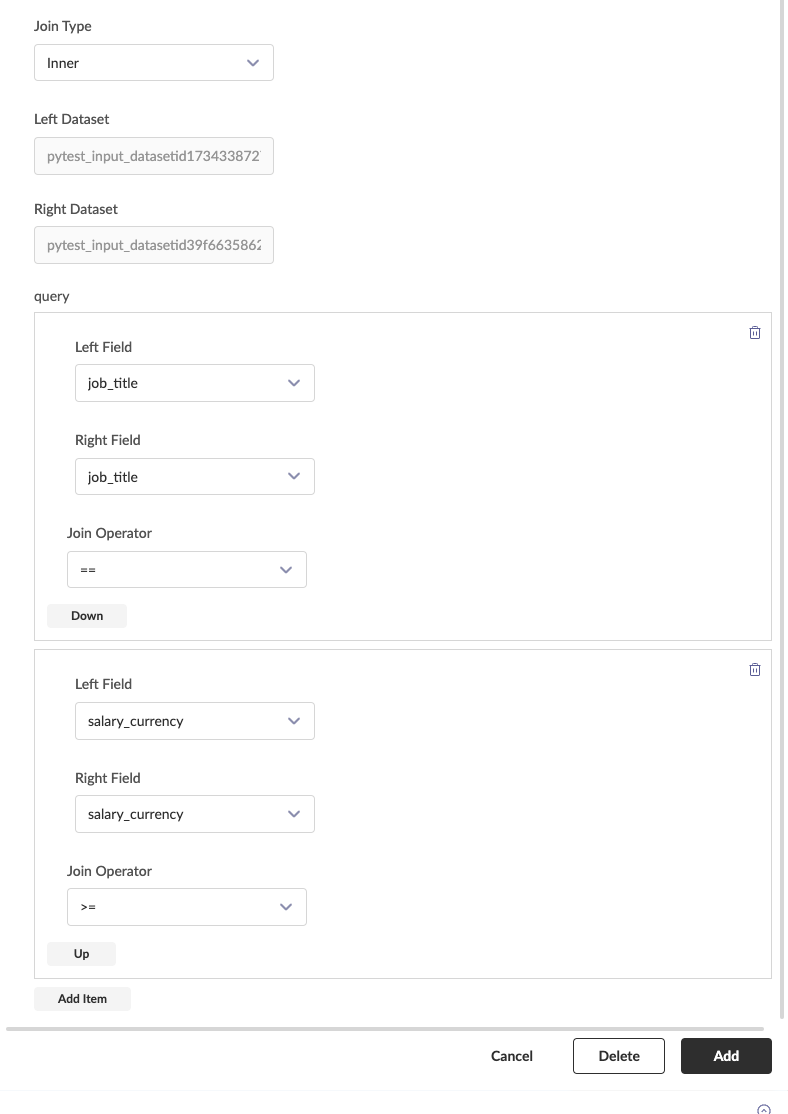
Troubleshooting
Common Issues and Solutions
Problem 1: The Left Dataset and Right Dataset values are not automatically filled Cause: The Dataset Reader Nodes have not been added or linked. Solution: Ensure that the Dataset Reader Nodes have been added and linked.
Problem 2: No values listed in Left Field or Right Field under query section Cause: A Dataset Reader Node has not been added to Join Node and it is not linked to it. Solution: Ensure that a Dataset Reader Node is added to Join Node and it is linked to it.
Problem 3: Warning sign above the Join Node Cause: This warning sign usually disappears upon successful addition of the Join Node. Solution: Click on Add to add the node to the workflow, the warning sign will disappear.
Additional Information
Ensure that the Dataset Reader Nodes have been added and linked if the Left Dataset and Right Dataset values are not automatically filled. If no values are listed in Left Field or Right Field under the query section, ensure that a Dataset Reader Node is added to Join Node and it is linked to it.
FAQ
Is it possible to join three datasets?
Yes, a join operation for three datasets can be performed. Join two datasets and use another Join Node to merge the third dataset with the output of the previous Join Node to get the result.
How can a Join Node be deleted?
The bin button that is present in the Join Node can be used to delete a Join Node.
Summary
This guide covered how to merge two datasets with a common key using Join Node in a workflow.
Union Node
Welcome to the Union Node guide! This guide will assist users in combining two or more datasets with identical structures into a single dataset.
Expected Outcome: By the end of this guide, you will gain an understanding of the Union Node and its applications in the Vue.ai platform.
Overview
The Union Node is utilized to combine multiple datasets with identical column structures into a single unified dataset. This node enables the consolidation of data from various sources by stacking records vertically, ensuring seamless integration of datasets with matching schemas. It is essential for aggregating data from multiple sources, merging historical and current data, or combining datasets from different time periods or regions.
Prerequisites For a better understanding of Transform Nodes, it is recommended to review the Getting Started with Workflows documentation.
Navigation To begin, the following path should be navigated: Home/Landing Page → Automation Hub → Workflow Manager → Workflows → New Workflow
Step-by-Step Instructions
- Load two or more datasets by adding Dataset Reader Nodes to the workspace.
- Ensure all datasets have identical column structures (same column names and data types).
- Drag and drop the Union node under the Transform node section in the left pane.
- Connect all the datasets that need to be combined to the Union Node.
- The node will automatically combine all connected datasets into a single output dataset.
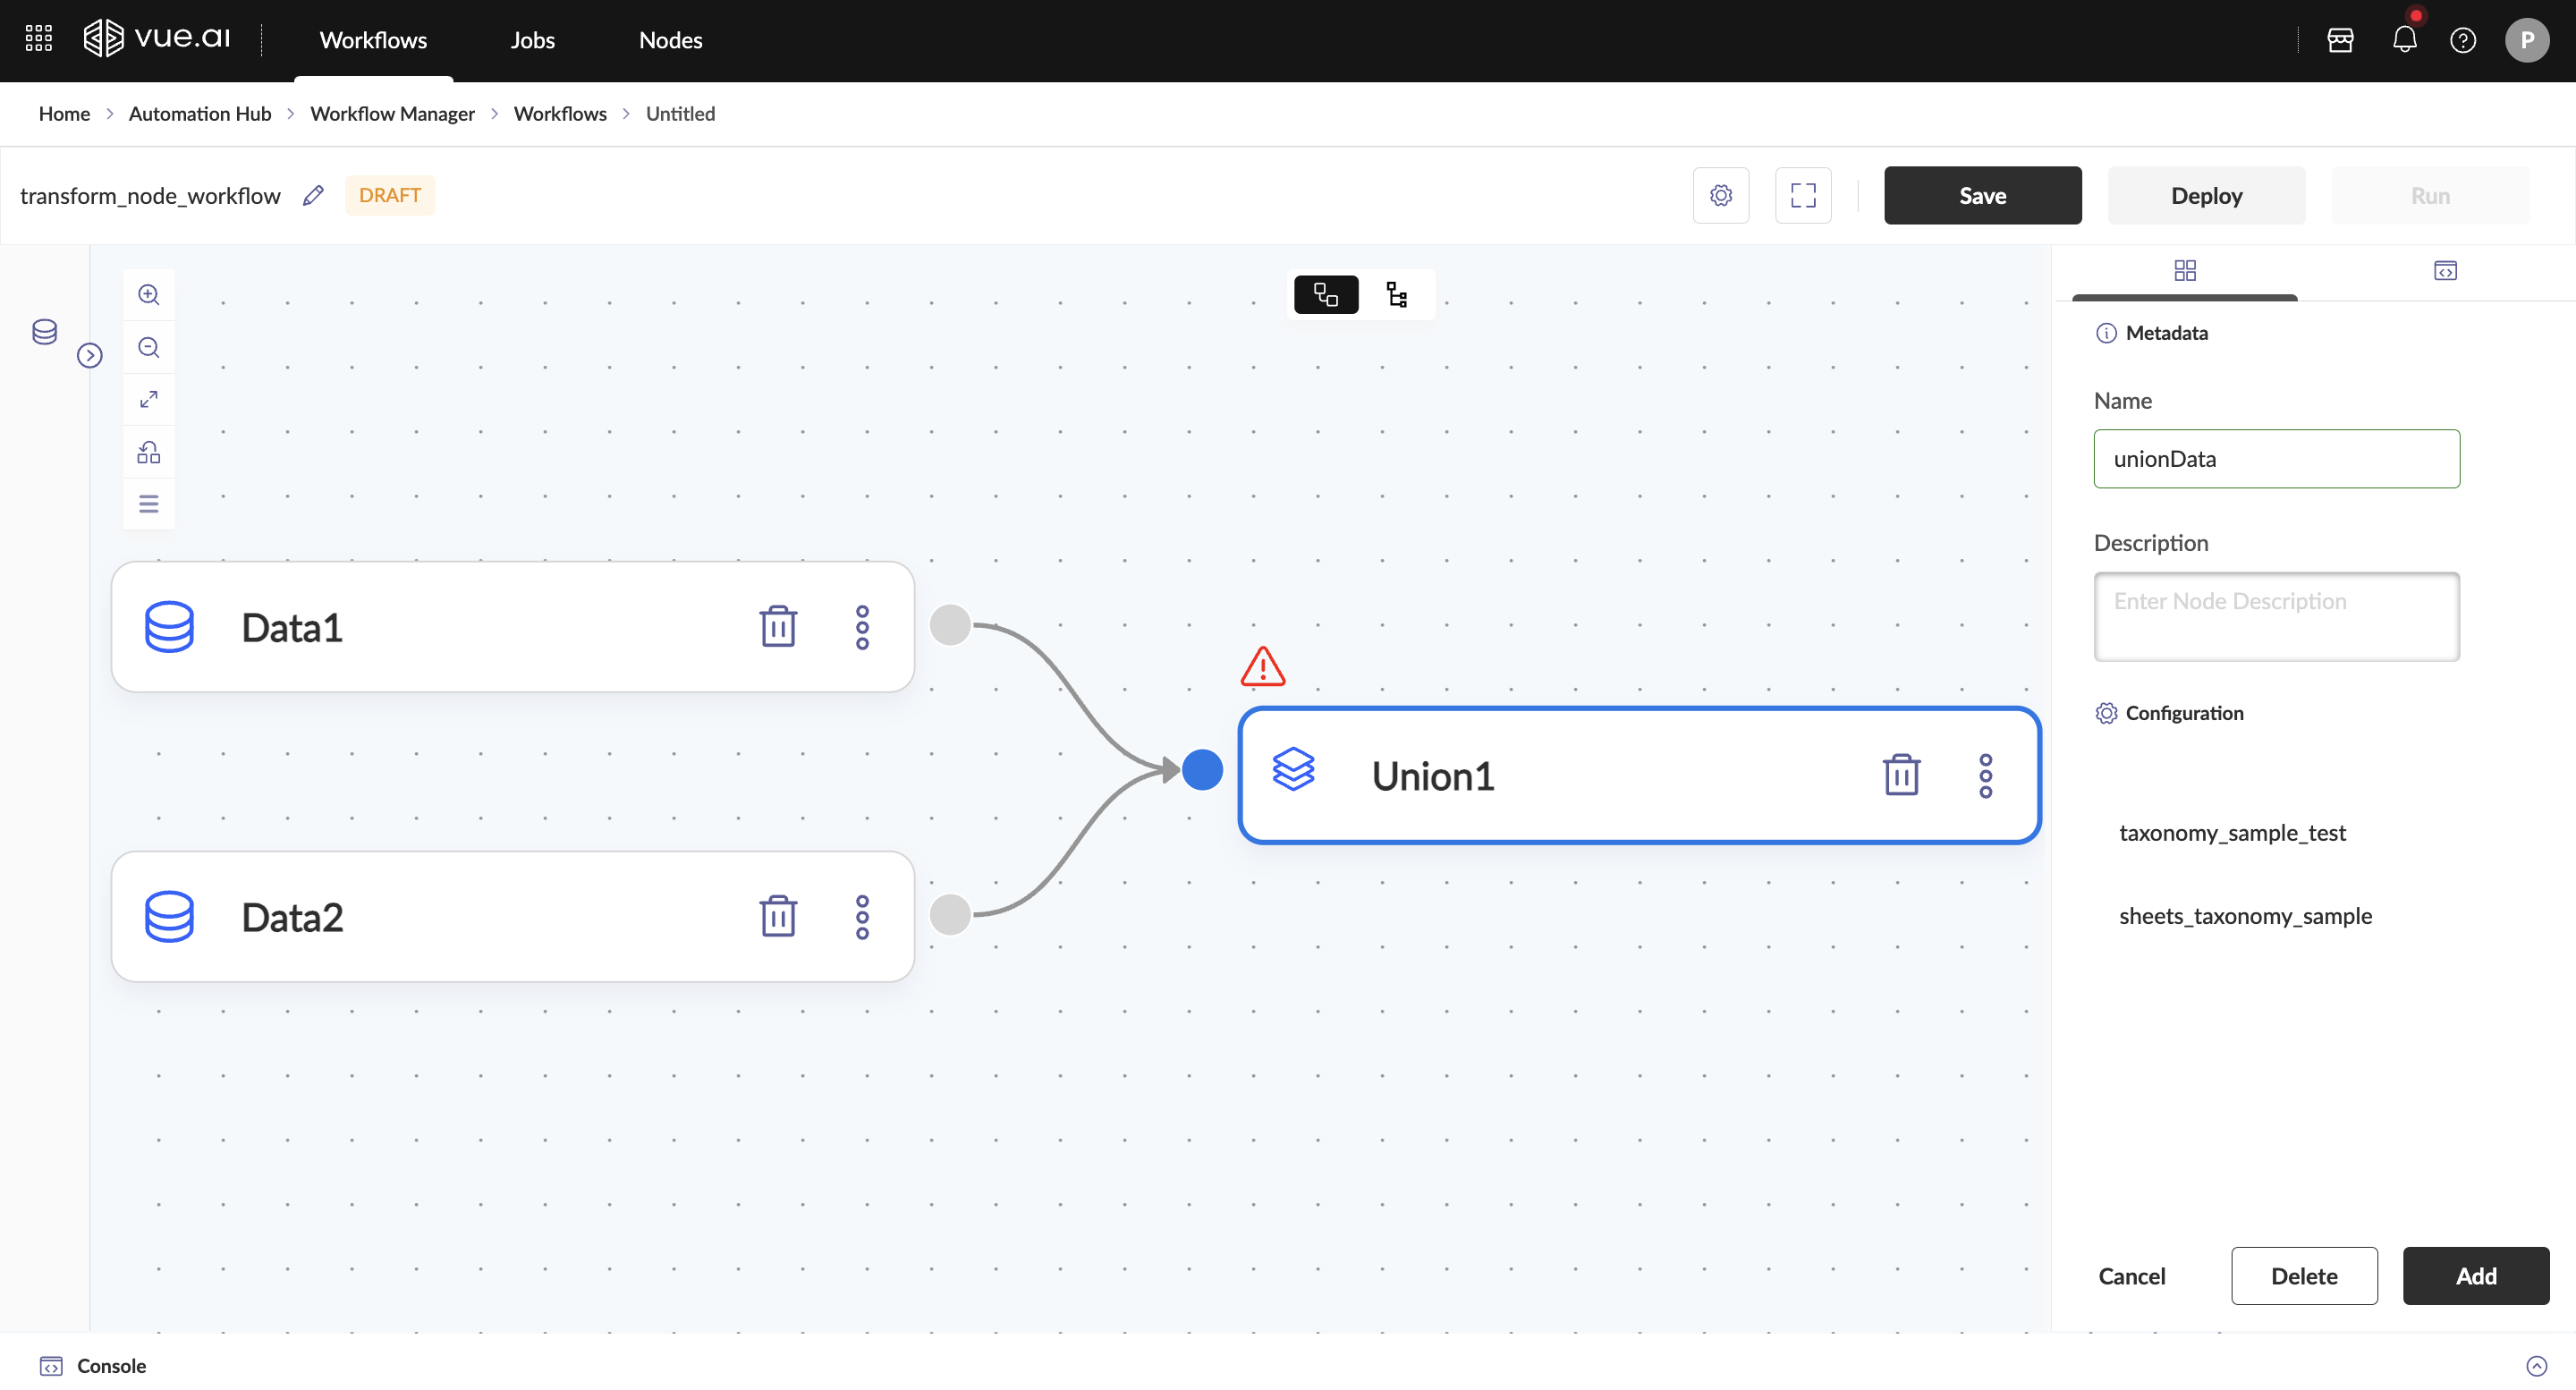
Important Requirements:
- Identical Column Structure: All input datasets must have the same column names and data types
- Column Order: Columns should be in the same order across all datasets
- Data Type Consistency: Ensure data types match for corresponding columns
Use Cases for Union Node:
- Historical Data Consolidation: Combine data from different time periods
- Multi-Source Integration: Merge data from multiple sources with identical schemas
- Regional Data Aggregation: Combine datasets from different geographical regions
- Batch Processing: Consolidate multiple batch files into a single dataset
Example Usage

Troubleshooting
Common Issues and Solutions
Problem 1: Schema Mismatch Error Cause: Input datasets have different column structures or data types. Solution:
- Ensure all datasets have identical column names and data types.
- Use Select or Transform nodes to standardize column structures before union.
Problem 2: No Values Listed or Empty Result Cause: Dataset Reader Nodes not properly connected to the Union Node. Solution:
- Ensure all Dataset Reader Nodes are properly connected to the Union Node.
- Verify that input datasets contain data.
Problem 3: Warning Sign Above the Union Node Cause: Warning sign appears after adding the Union Node. Solution:
- Click on Add to add the node to the workflow, the warning sign will disappear.
Additional Information
The Union Node requires all input datasets to have identical column structures. Use data transformation nodes to align schemas before applying union operations.
FAQ
Can datasets with different column structures be unioned?
No, all datasets must have identical column structures. Use transformation nodes to align schemas before union.
Is there a limit to the number of datasets that can be unioned?
There is no strict limit, but performance may be affected with a very large number of datasets.
How can a Union Node be deleted?
The bin button that is present in the Union node can be used to delete a Union Node.
Summary
This guide covered how to combine multiple datasets with identical structures using the Union Node.
Transform Node
Welcome to the Transform Node guide! This guide will assist users in applying custom transformations and calculations to dataset columns using expressions.
Expected Outcome: By the end of this guide, you will gain an understanding of the Transform Node and its applications in the Vue.ai platform.
Overview
The Transform Node is utilized to apply custom transformations, calculations, and data manipulations to existing columns or create new columns using expressions. This node provides flexibility in data processing by enabling complex mathematical operations, string manipulations, conditional logic, and data type conversions. It is essential for data preparation, feature engineering, and custom business logic implementation.
Prerequisites For a better understanding of Transform Nodes, it is recommended to review the Getting Started with Workflows documentation.
Navigation To begin, the following path should be navigated: Home/Landing Page → Automation Hub → Workflow Manager → Workflows → New Workflow
Step-by-Step Instructions
- Load a dataset by adding the Dataset Reader Node to the workspace.
- Drag and drop the Transform node under the Transform node section in the left pane.
- Define the transformation expression in the Expression field using Python-like syntax.
- Specify the Output Column Name for the transformed data.
- Click Add Item to include multiple transformations.
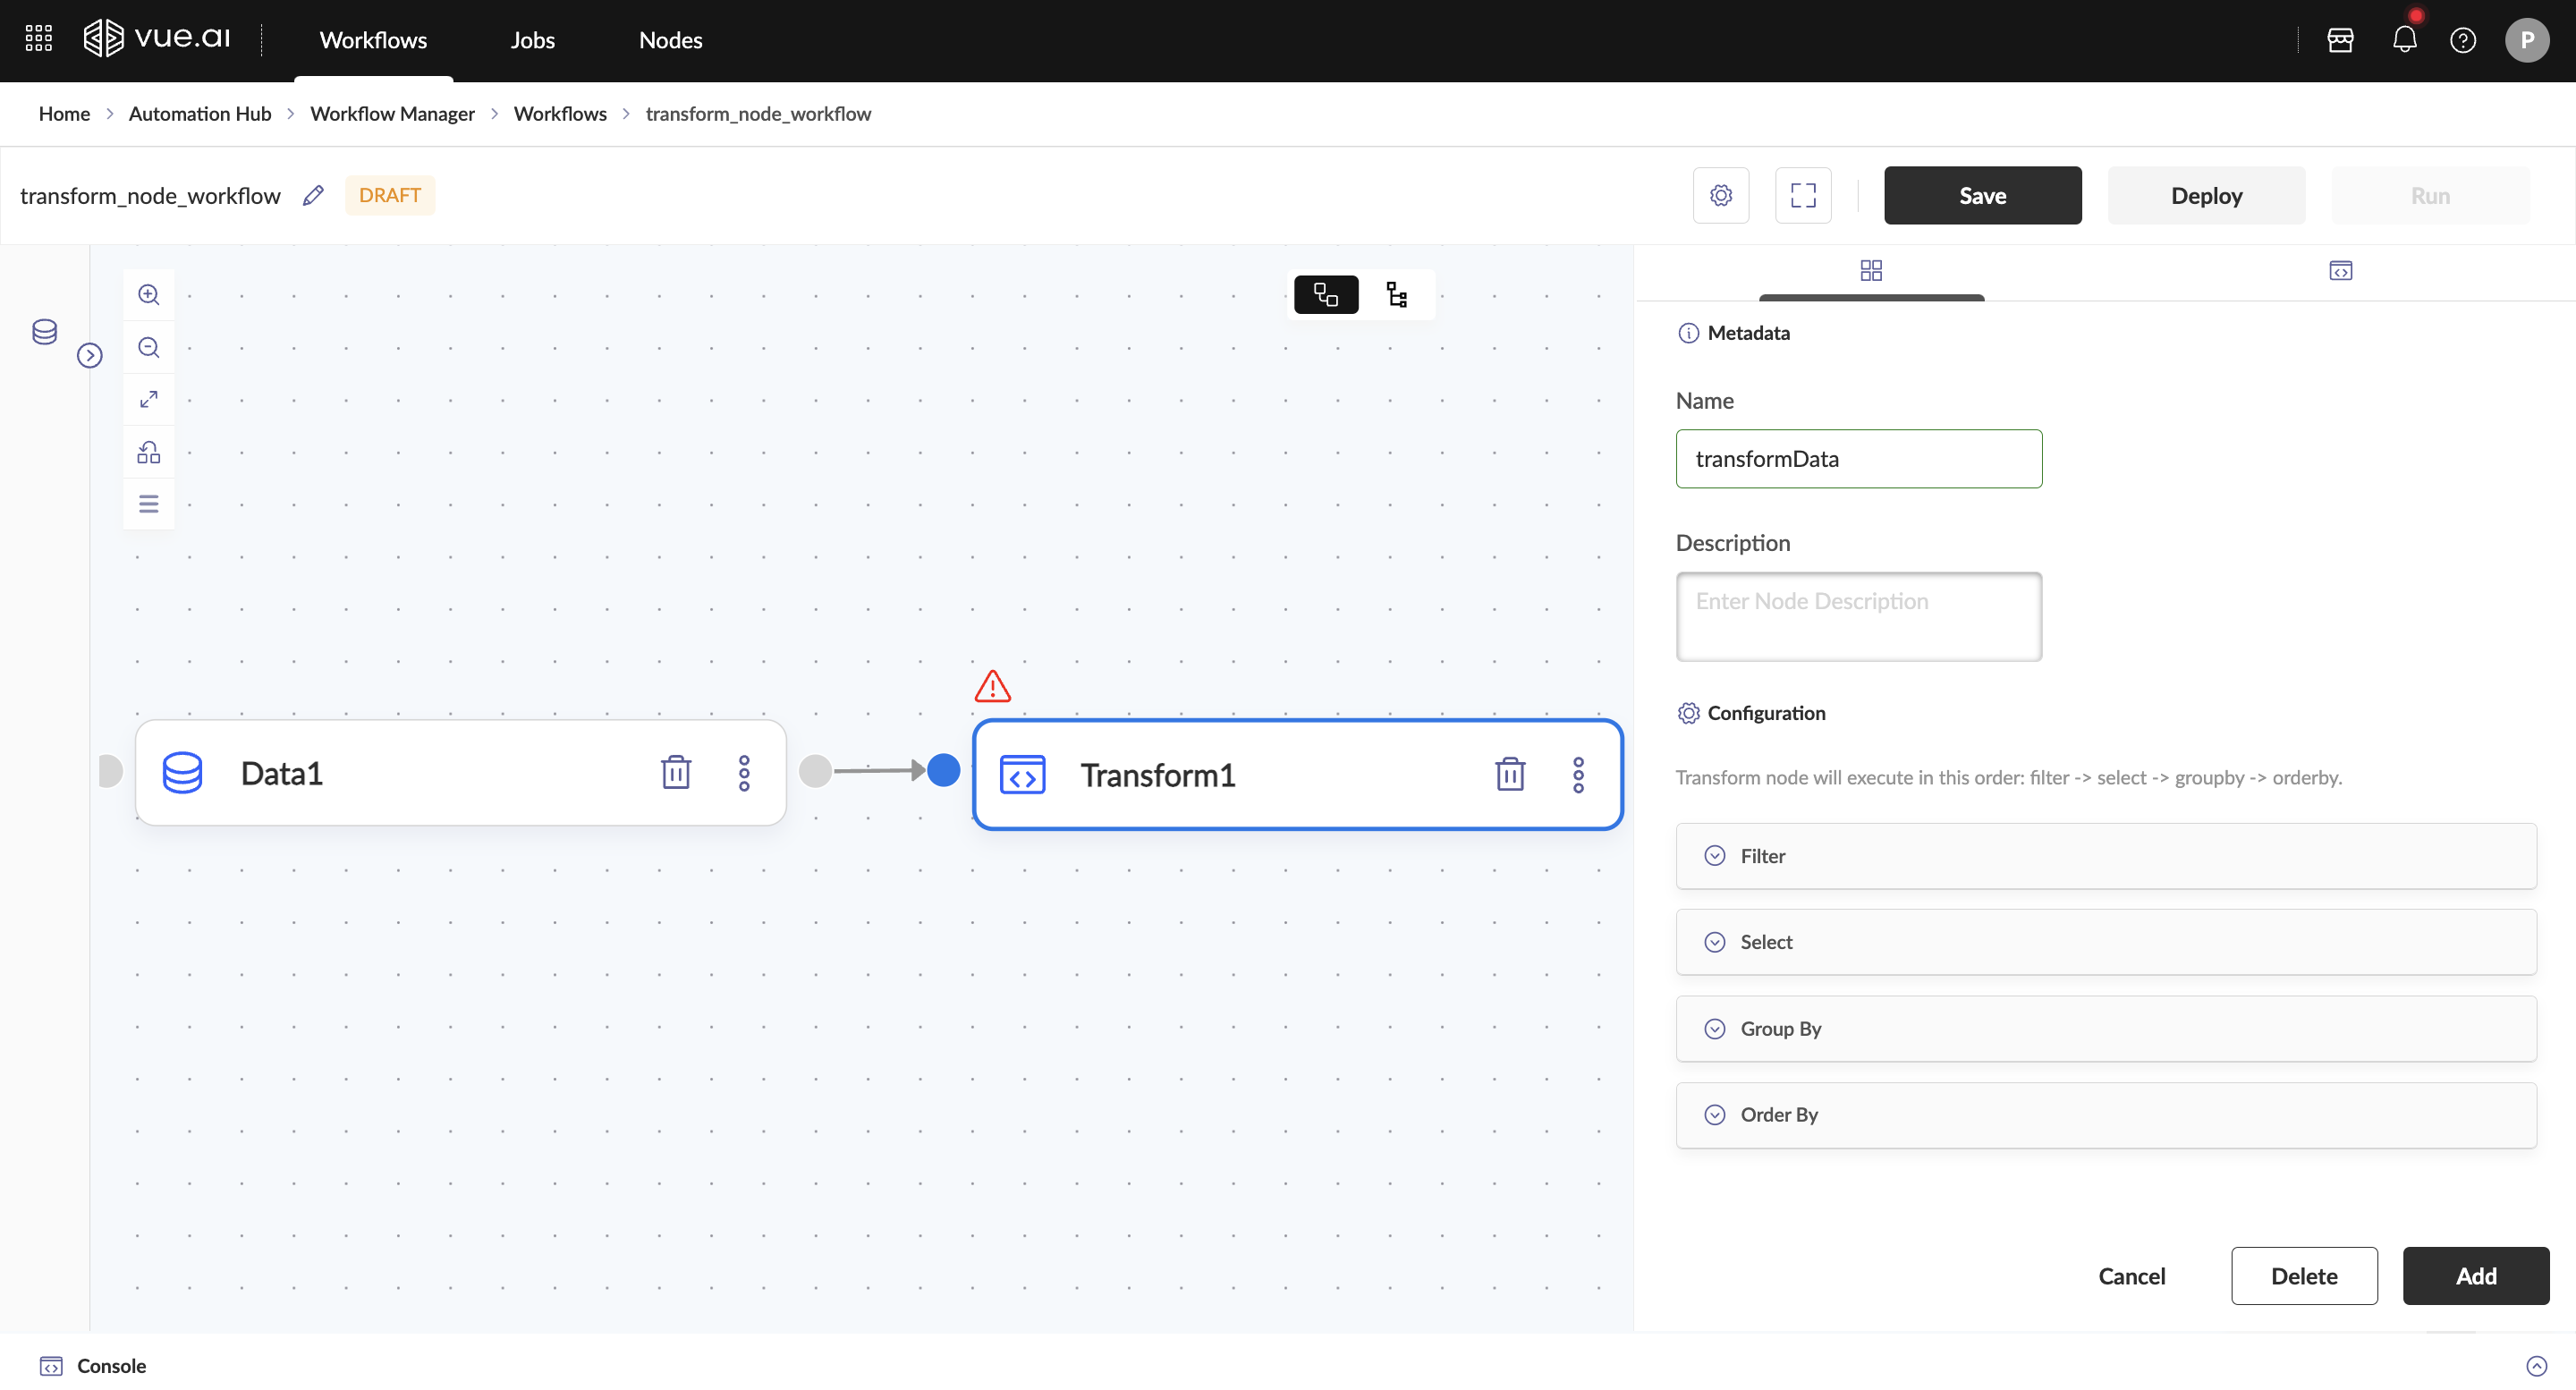
Expression Examples:
Mathematical Operations:
# Calculate total price with tax
total_price = price * (1 + tax_rate)

# Calculate age from birth year
age = 2024 - birth_year

# Convert temperature
fahrenheit = (celsius * 9/5) + 32
String Operations:
# Concatenate columns
full_name = first_name + " " + last_name

# Extract substring
domain = email.split("@")[1]

# Convert to uppercase
upper_name = name.upper()
Conditional Logic:
# Conditional assignment
category = "High" if score > 80 else "Low"

# Multiple conditions
grade = "A" if score >= 90 else ("B" if score >= 80 else "C")
Example Usage

Troubleshooting
Common Issues and Solutions
Problem 1: Expression Syntax Error Cause: Invalid Python syntax in the expression field. Solution:
- Verify the expression syntax follows Python conventions.
- Check for proper parentheses, quotes, and operators.
Problem 2: Column Not Found Error Cause: Referenced column name doesn't exist in the dataset. Solution:
- Ensure all column names used in expressions exist in the input dataset.
- Check for correct spelling and case sensitivity.
Problem 3: Data Type Mismatch Cause: Operation not supported for the given data types. Solution:
- Ensure operations are compatible with column data types.
- Use appropriate type conversion functions if needed.
Additional Information
The Transform Node uses Python-like expressions. Ensure familiarity with Python syntax for optimal usage.
FAQ
What types of expressions are supported?
The Transform Node supports Python-like expressions including mathematical operations, string manipulations, conditional logic, and function calls.
Can multiple columns be transformed simultaneously?
Yes, use the Add Item option to define multiple transformations in a single node.
How can a Transform Node be deleted?
The bin button that is present in the Transform node can be used to delete a Transform Node.
Summary
This guide covered how to apply custom transformations and calculations to dataset columns using the Transform Node.
Custom Nodes
Custom nodes allow you to extend the Automation Hub with your own functionality and integrate external services and libraries.
Create Custom Code Nodes
Custom Code Nodes are essential components in workflow automation, allowing users to execute custom logic within their workflows with integrated development environments.
Prerequisites
- Access to the Automation Hub
- Familiarity with JSON Schema for defining node configurations
- Basic knowledge of Python for implementing custom logic
- GitHub access for version control
Setting Up a Custom Code Node
Access the Nodes Page
- Navigate to the Nodes section within the Automation Hub
- Click on the + New Node button
Fill in Node Details
- Name: Provide a user-friendly name
- Group Name: Select appropriate group or add new group
- Runtime: Choose runtime (Python/Spark)
- Description: Add brief description
- Tags: Optionally add searchable tags
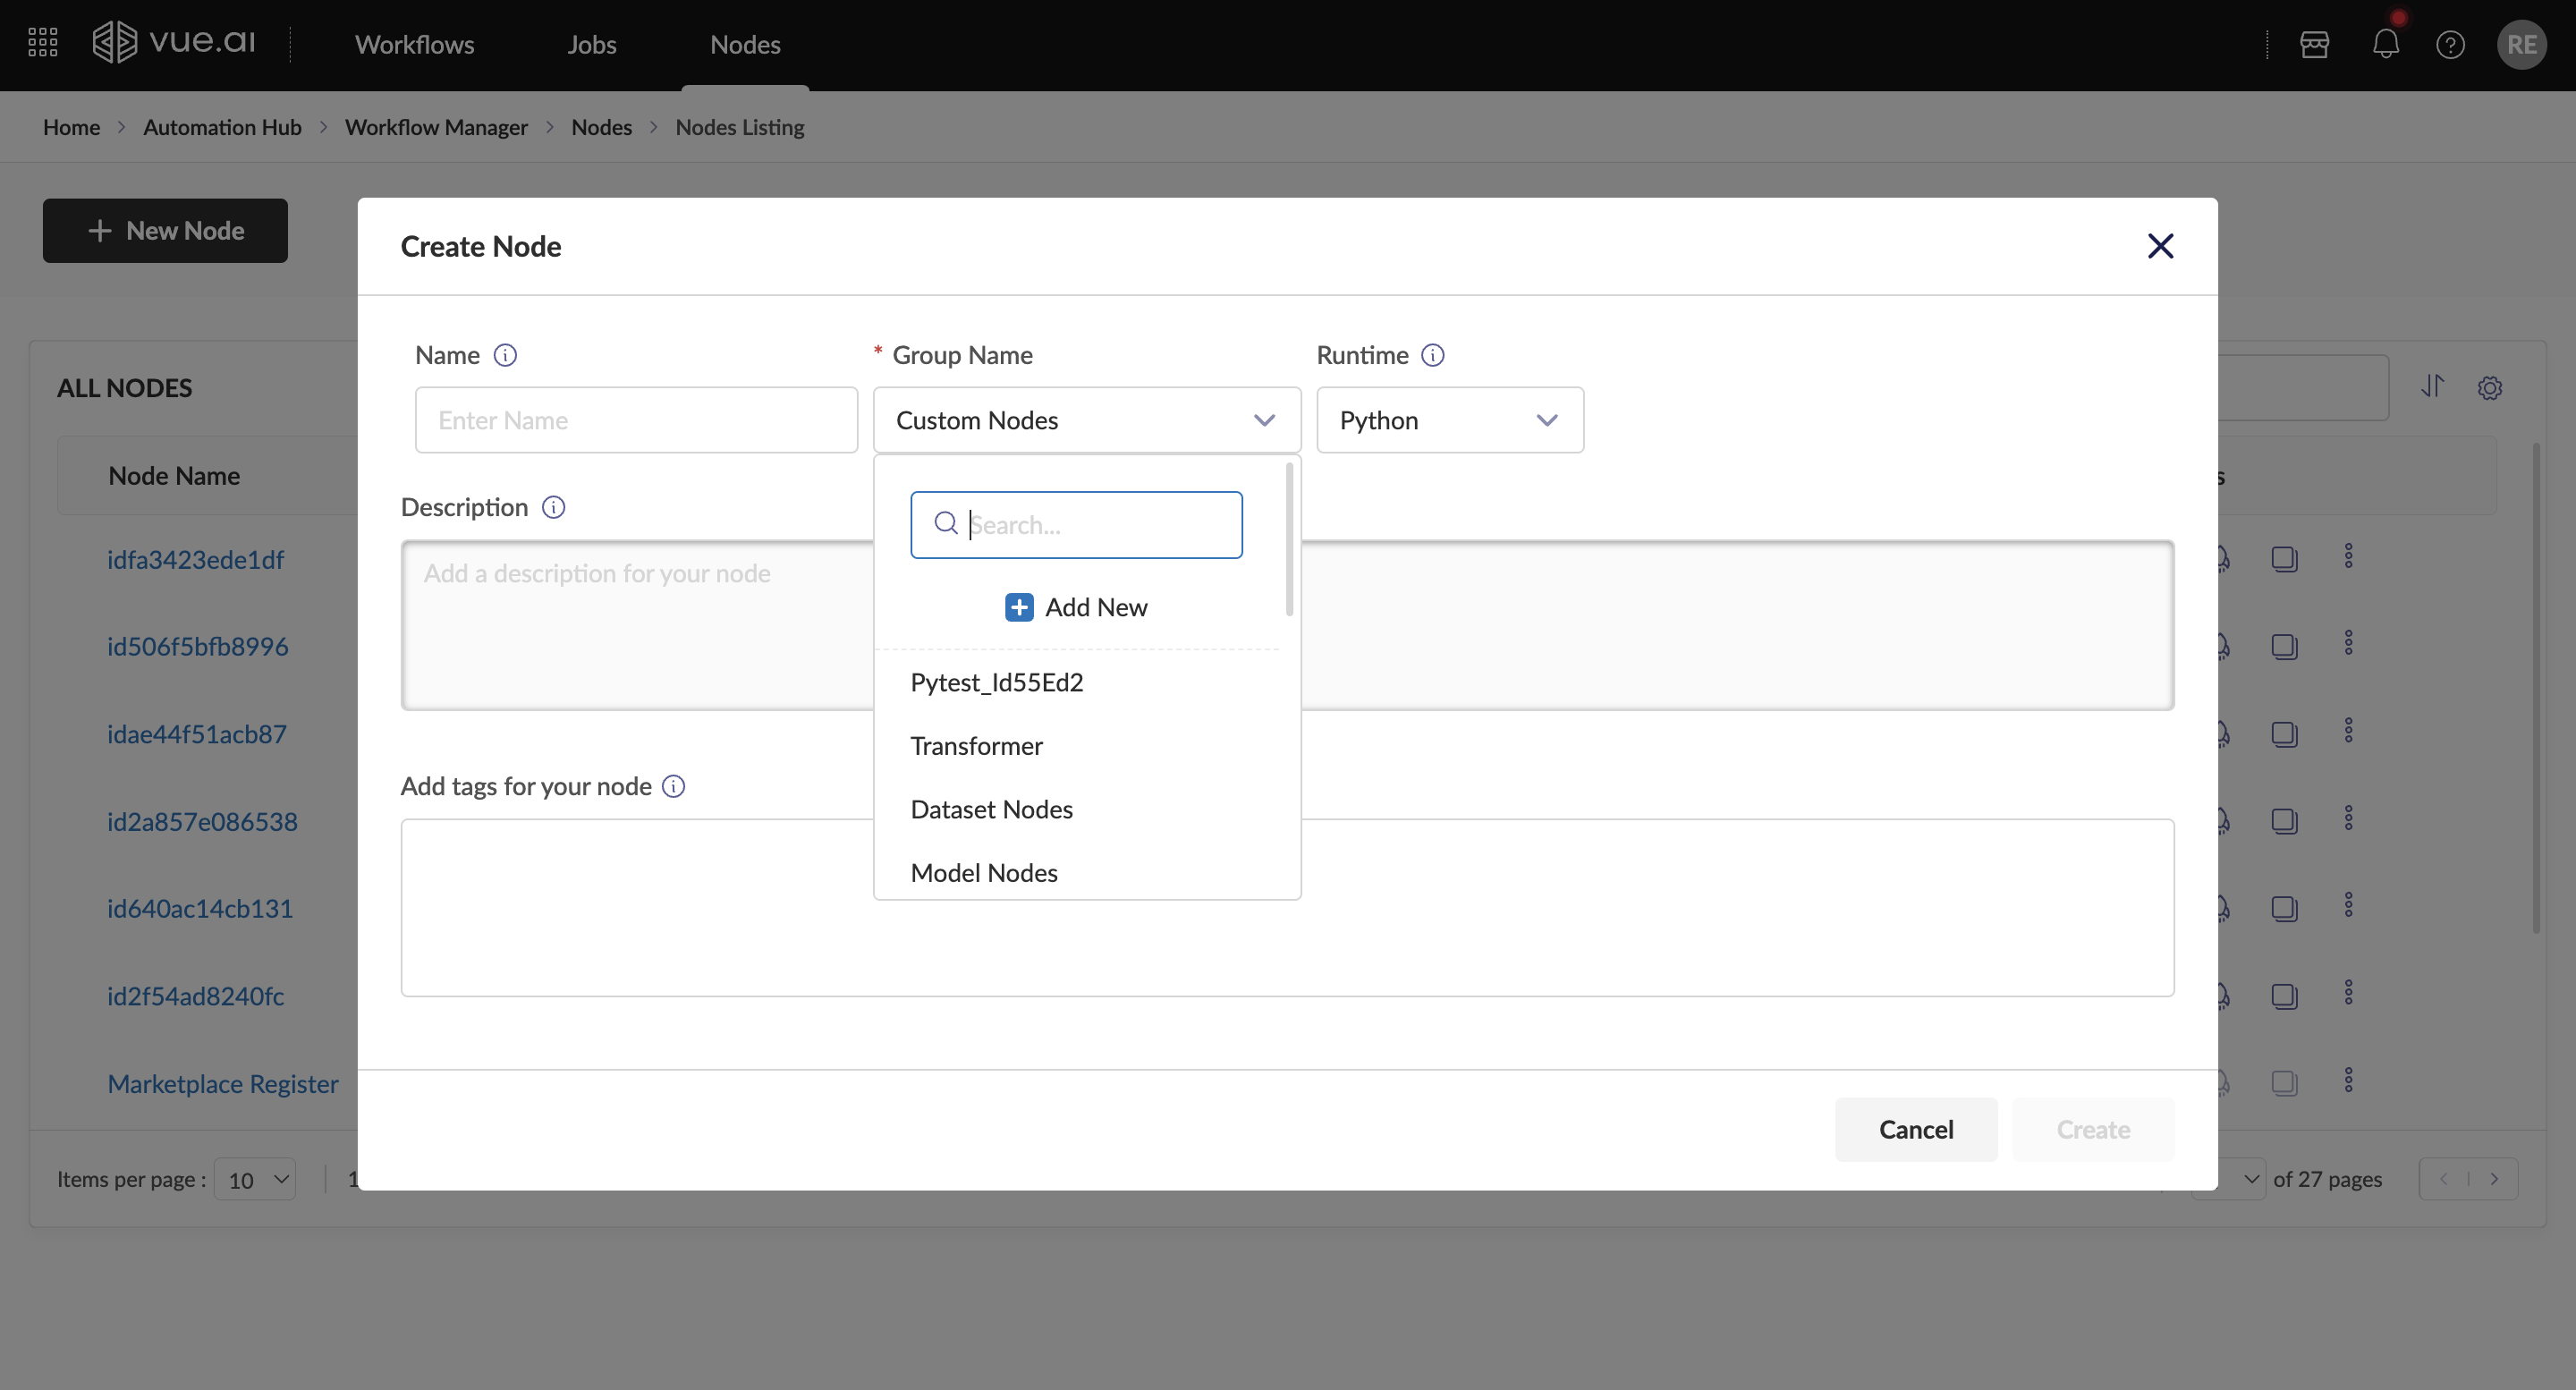
- Define Node Schema Define the structure using JSON Schema:
{
  "id": "loginFormUI",
  "type": "object",
  "properties": {
    "username": {
      "type": "string",
      "title": "Username"
    },
    "password": {
      "type": "string",
      "title": "Password",
      "minLength": 6
    }
  },
  "required": ["username", "password"]
}
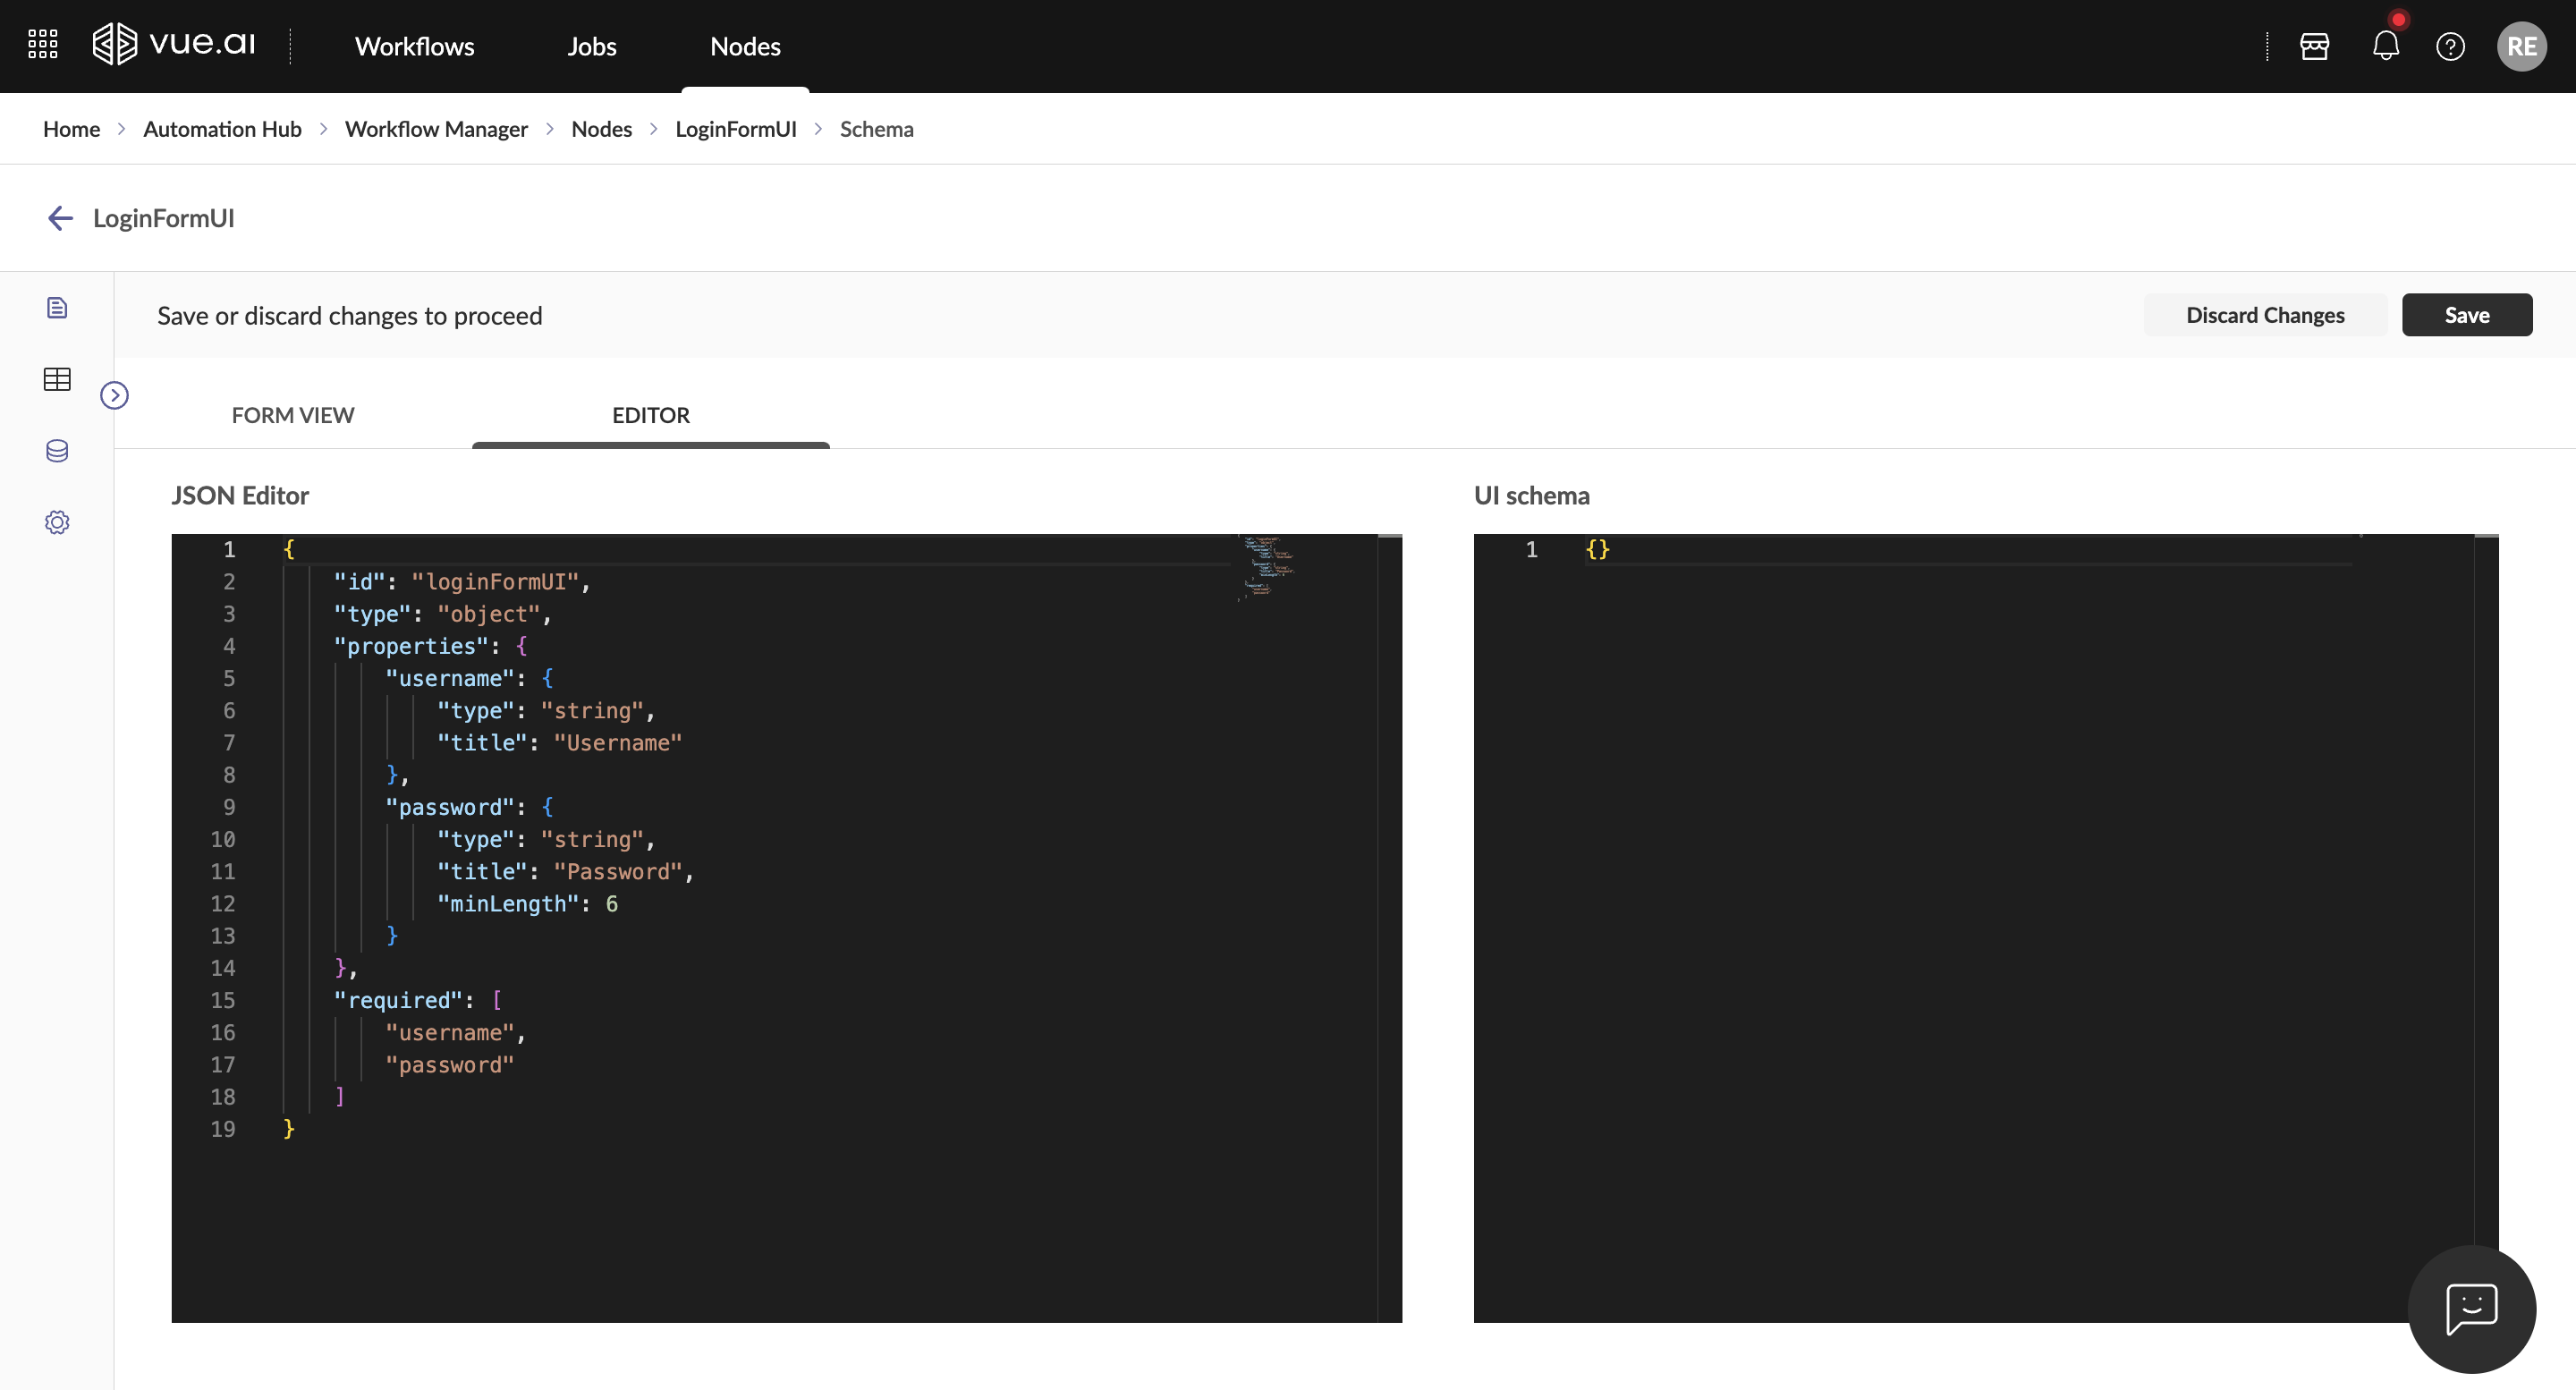
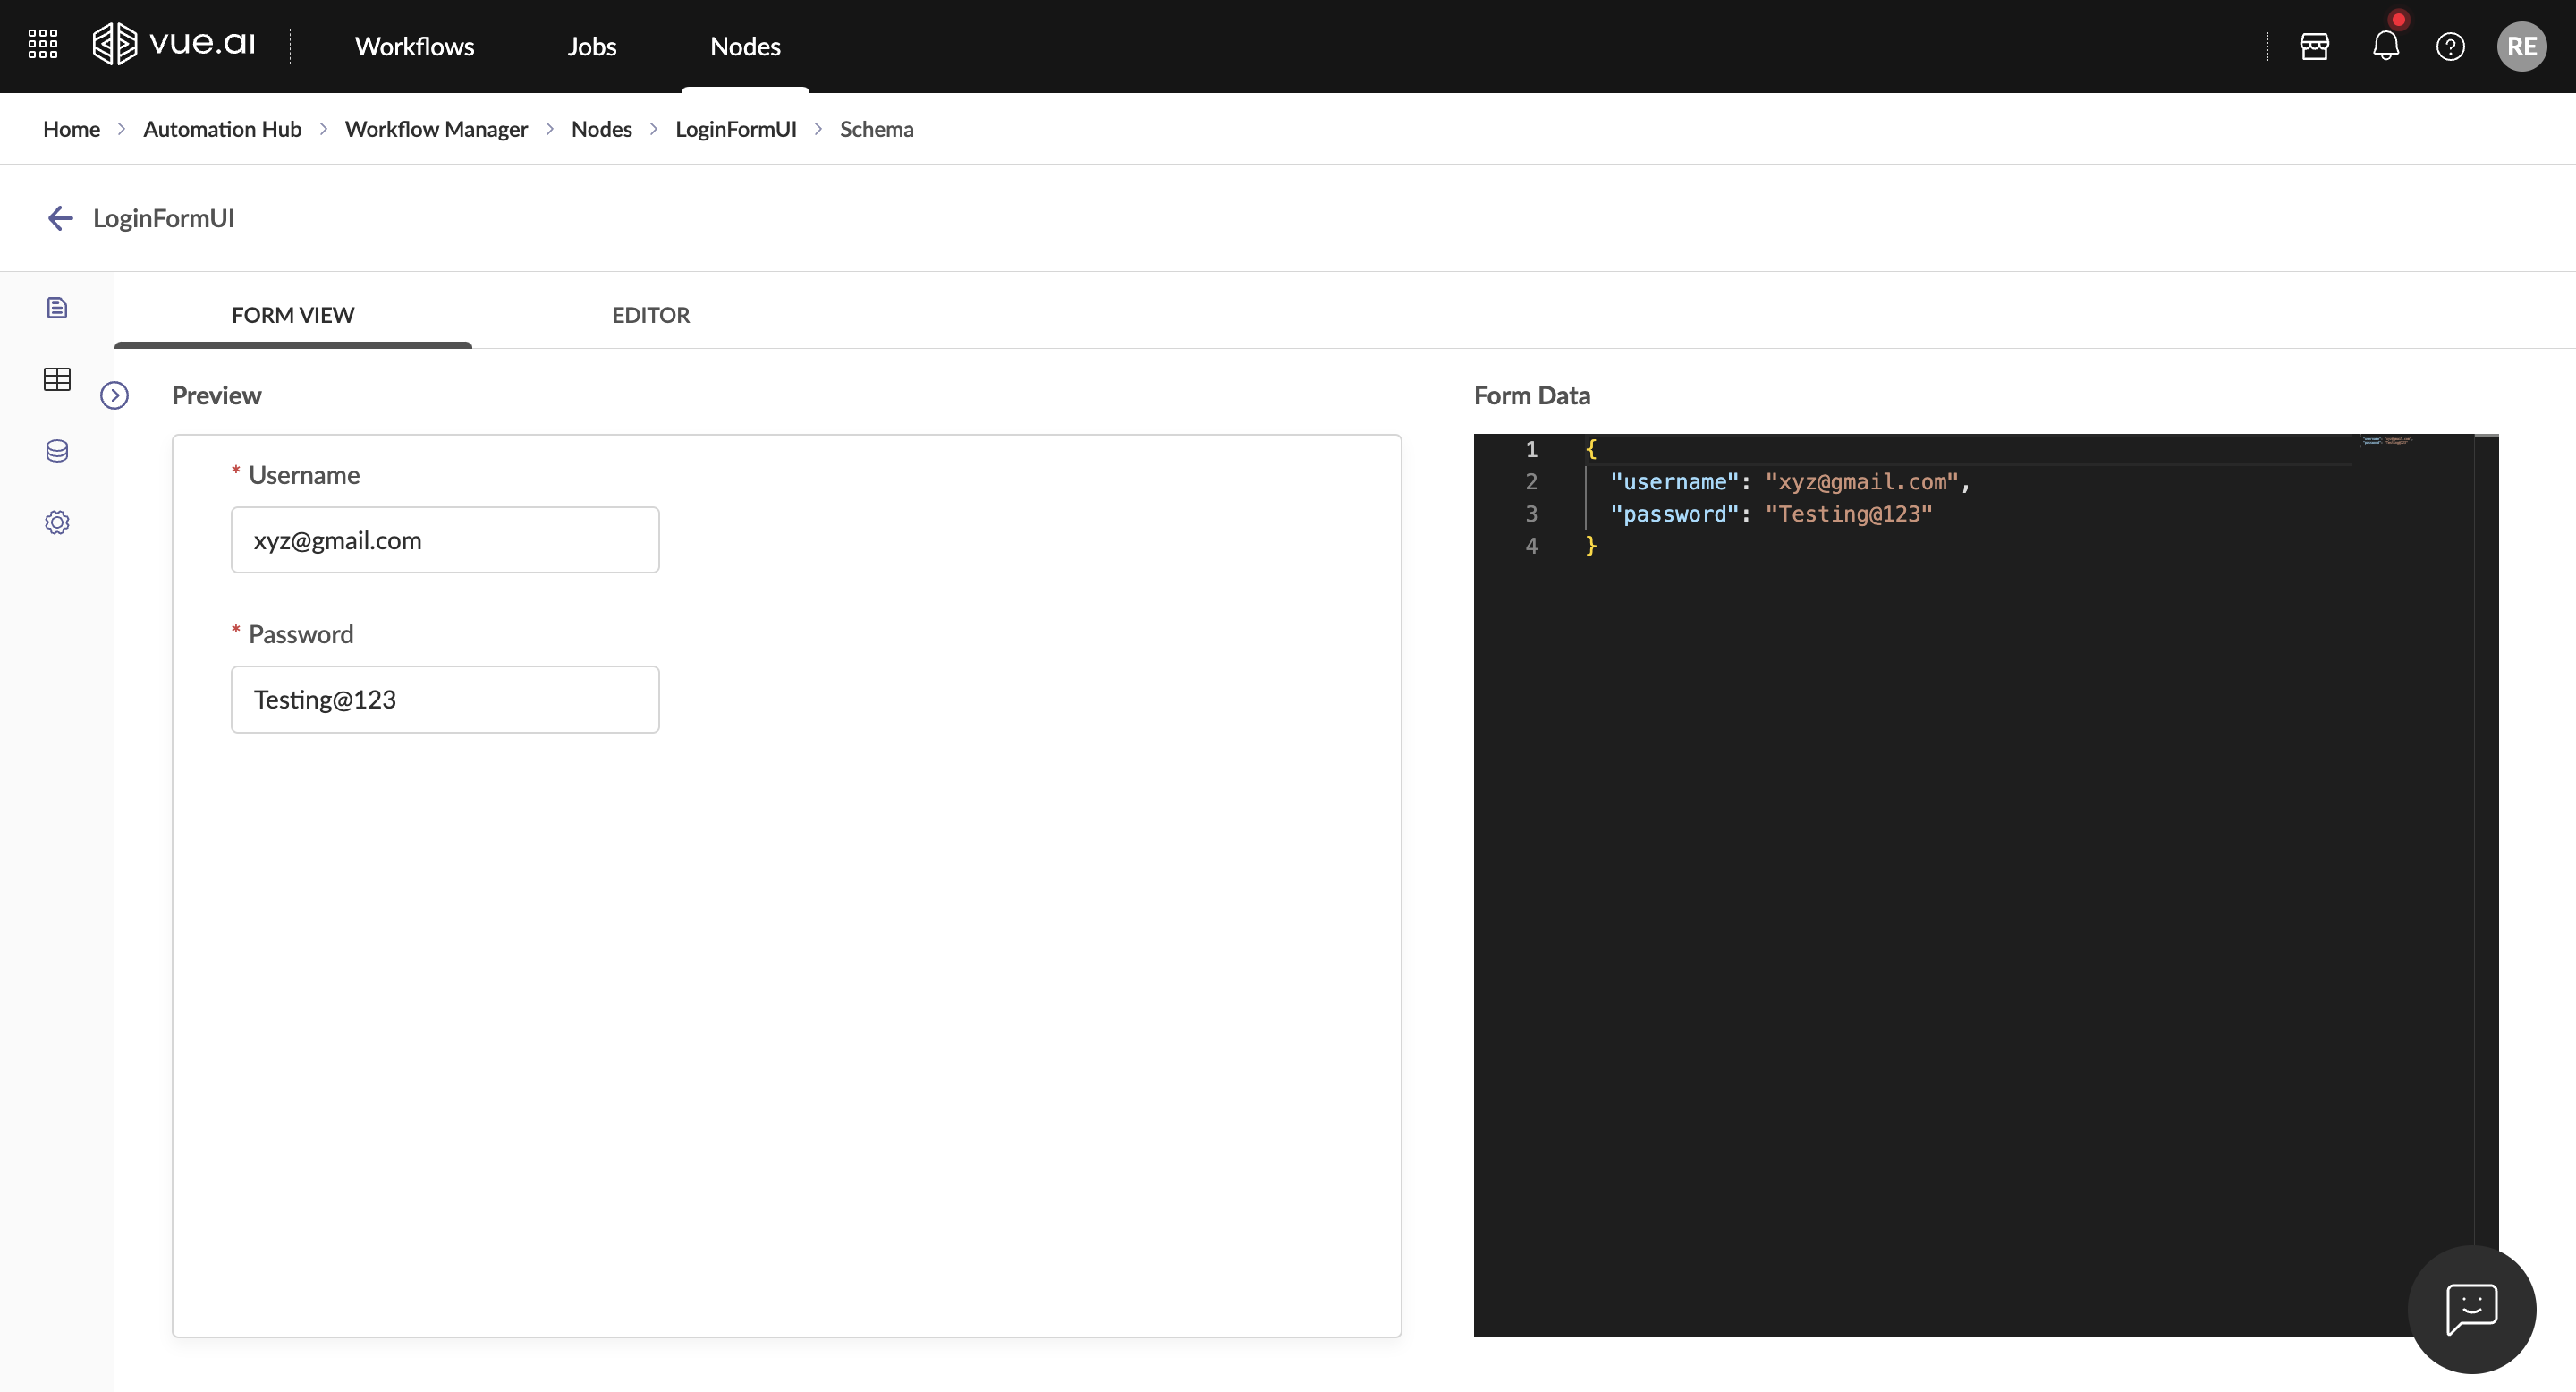
Use the chat option in the lower-right corner for assistance with building basic forms.
- Access and Edit Code in VS Code Server
- Navigate to Code Server section
- Use integrated VS Code editor to write and modify code
- Include necessary packages in requirements.txt file
- Clone repositories, create files, or open existing projects
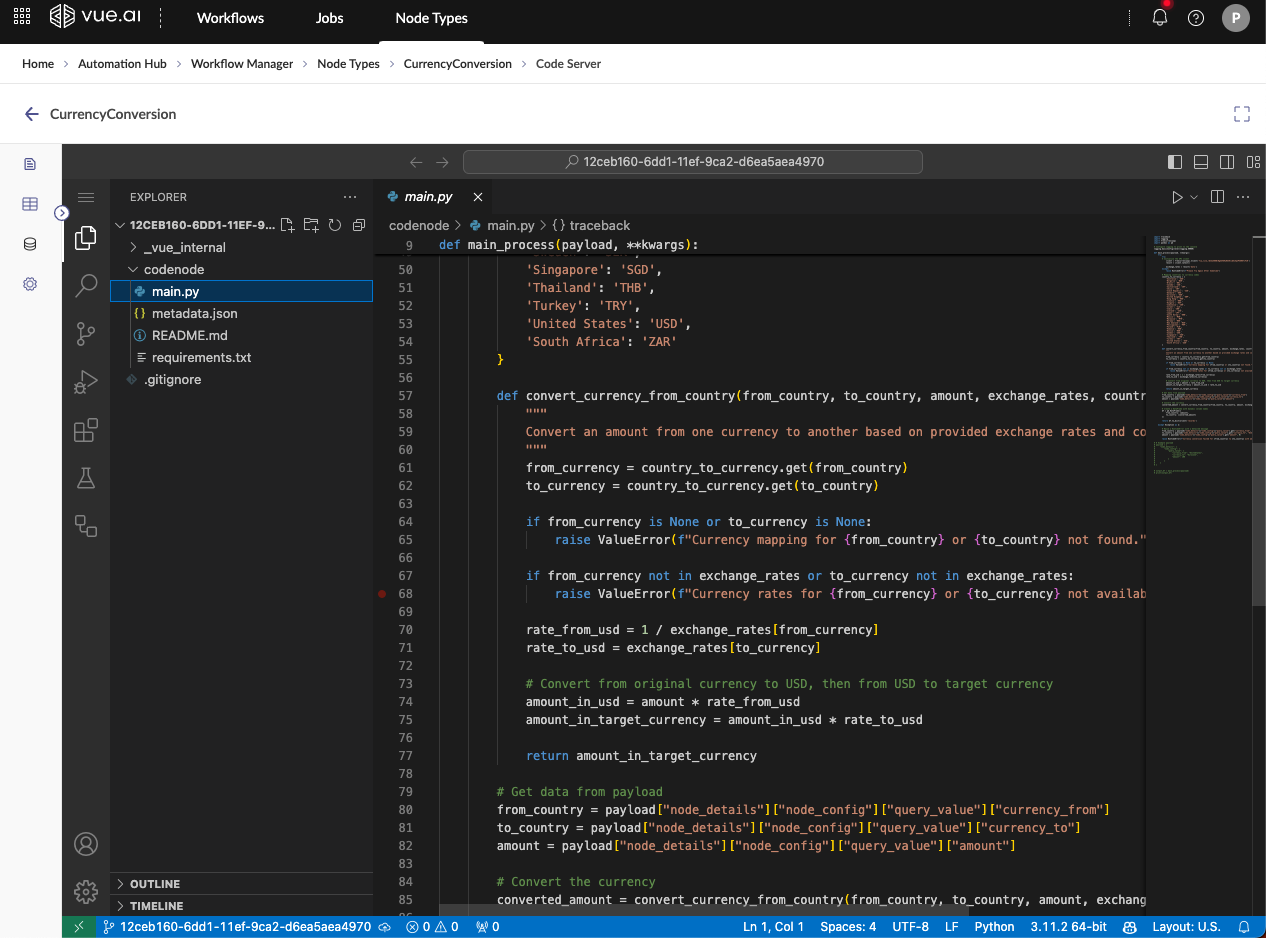
Exclude these pre-installed base requirements from your requirements.txt:
- requests==2.30.0
- pandas
- numpy==1.*
- Deployment Configurations Configure resource allocation in Deployment Config section:
- CPU Limit/Request: Define CPU usage constraints
- Memory Limit/Request: Set memory bounds
- Number of Replicas: Specify instances for scaling
- Idle Replica Count: Default 0, can be removed to reduce wait time
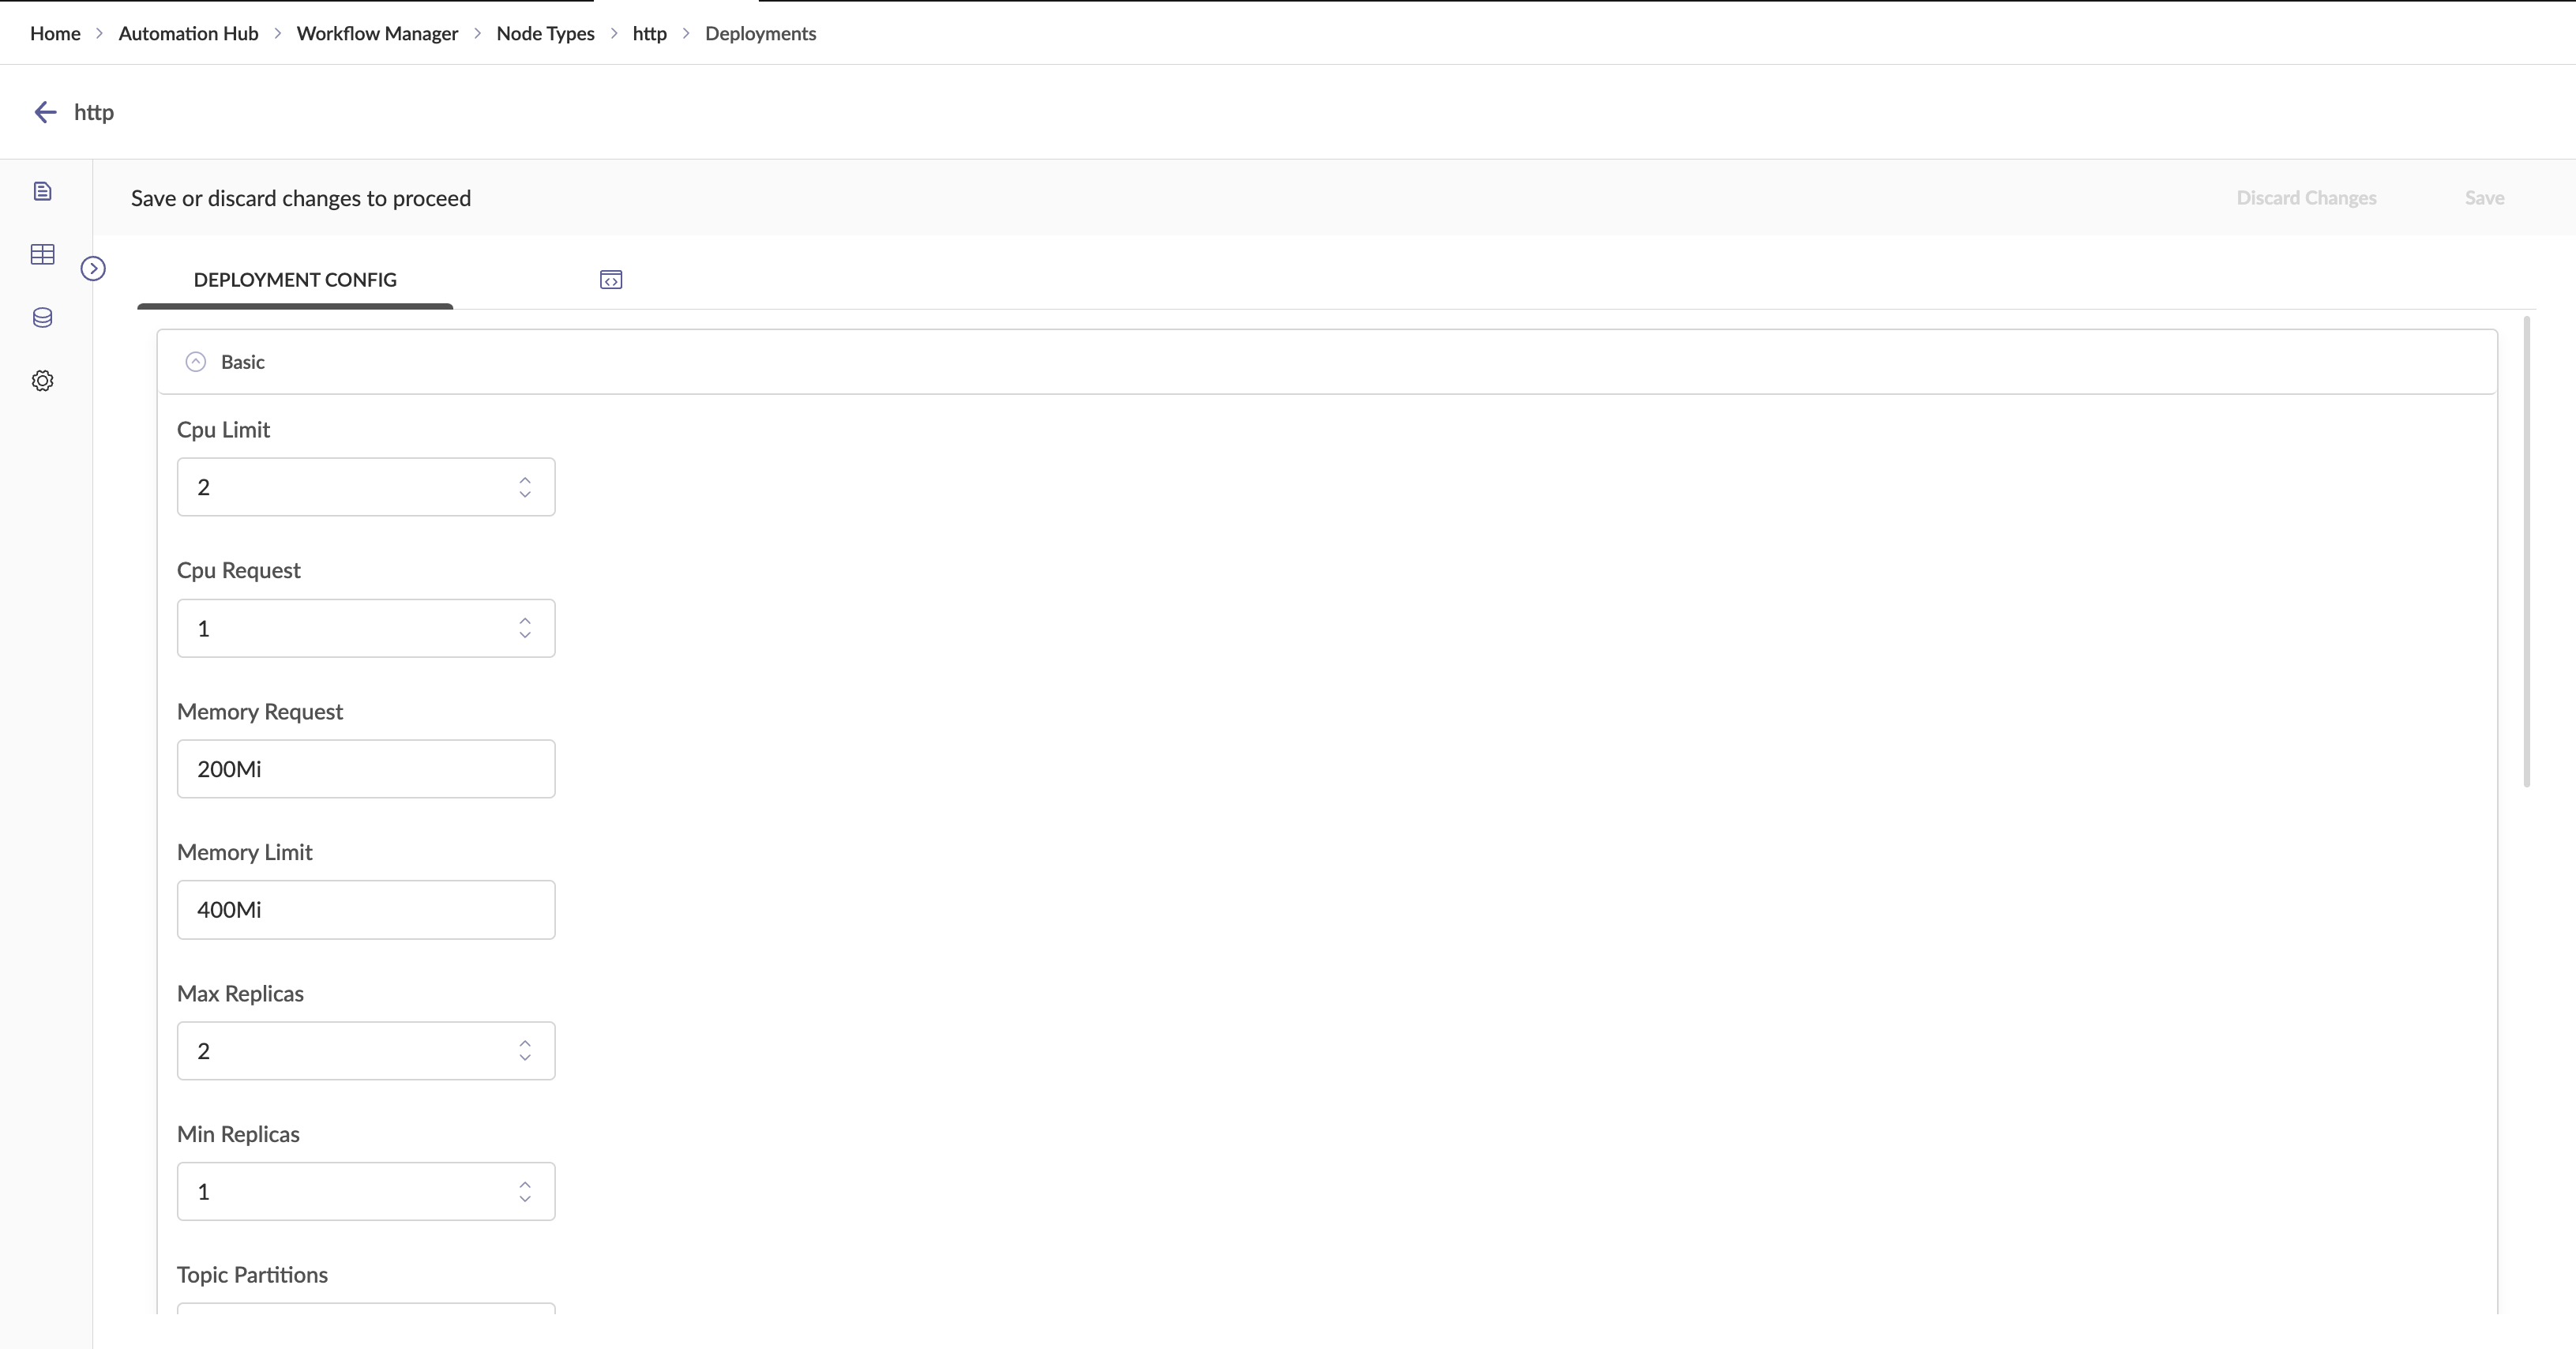
Code Server Project Structure
codenode/
│
├── main.py
├── requirements.txt
├── README
├── .gitignore
- main.py: Primary script where logic is implemented
- requirements.txt: Lists dependencies
- README: Includes setup instructions
- .gitignore: Specifies ignored files
Enabling the Python Environment
python3 -m venv myenv
source myenv/bin/activate
pip install -r requirements.txt

Accessing Node Data and Configuration
Previous Node Data:
previous_node_name = list(payload['payload'].keys())[0]
input_data = payload["payload"][previous_node_name]["result"]["data"]
Current Node Data:
current_node_data = payload['node_details']['node_config']['query_value'][current_node_data_key]
Accessing Secrets Secrets are stored in the Secrets Manager:
from meta.global_constants import get_secrets_data
secret_json = get_secrets_data(f'{client_id}-{your-secret-name}')
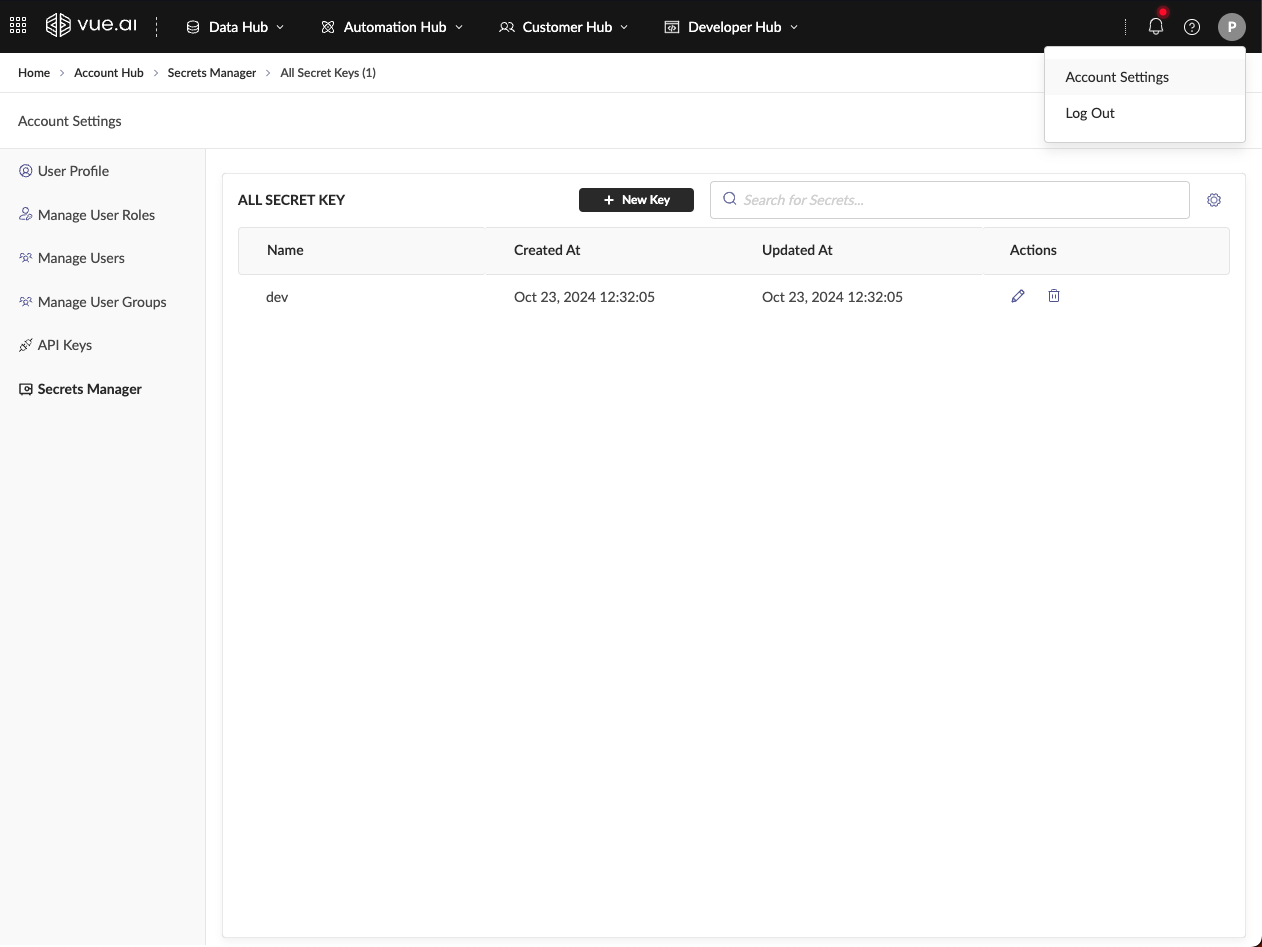
SDK Client Initialization Sample Python code to initialize SDK client:
import logging
from vue_pre_sdk.client import AdminClient, AccountClient, ConnectorClient, DatasetsClient, MLOpsClient, UserClient, WorkflowClient

def main_process(payload: dict, logger: logging.Logger = None, **kwargs):
    client_id = payload["account_id"]

    mlops = WorkflowClient(
        base_url=os.environ.get("RBAC_URL"),
        api_key=("your_api_key"),
        account_id=client_id
    )
This functionality is available for nodes created after version 2.3.7 release.
Users can generate API keys in the tool under API Keys section in Account Settings.
Example Code Node
import logging
import json
from meta.global_constants import get_secrets_data
from openai import OpenAI

def main_process(payload, **kwargs):
    logger = logging.getLogger("CODENODE_APP")
    logger.setLevel(logging.INFO)

    secret_json = get_secrets_data('<your-secret-name>')
    client = OpenAI(api_key=secret_json["OPENAI_API_KEY"])

    input_data = [{"name": "Alice", "age": 30}, {"name": "Bob", "age": 25}]
    prompt = payload['node_details']['node_config']['query_value']['prompt']

    response = client.chat.completions.create(
        model="gpt-4-1106-preview",
        messages=[{"role": "user", "content": json.dumps(input_data) + prompt}]
    )
    result = response.choices[0].message['content']
    logger.info(result)
    return result
Committing and Pushing Changes
Using VS Code UI:
- Open Source Control Tab
- Stage and commit changes
- Click Commit and Push
- Click Publish Branch (if first time)
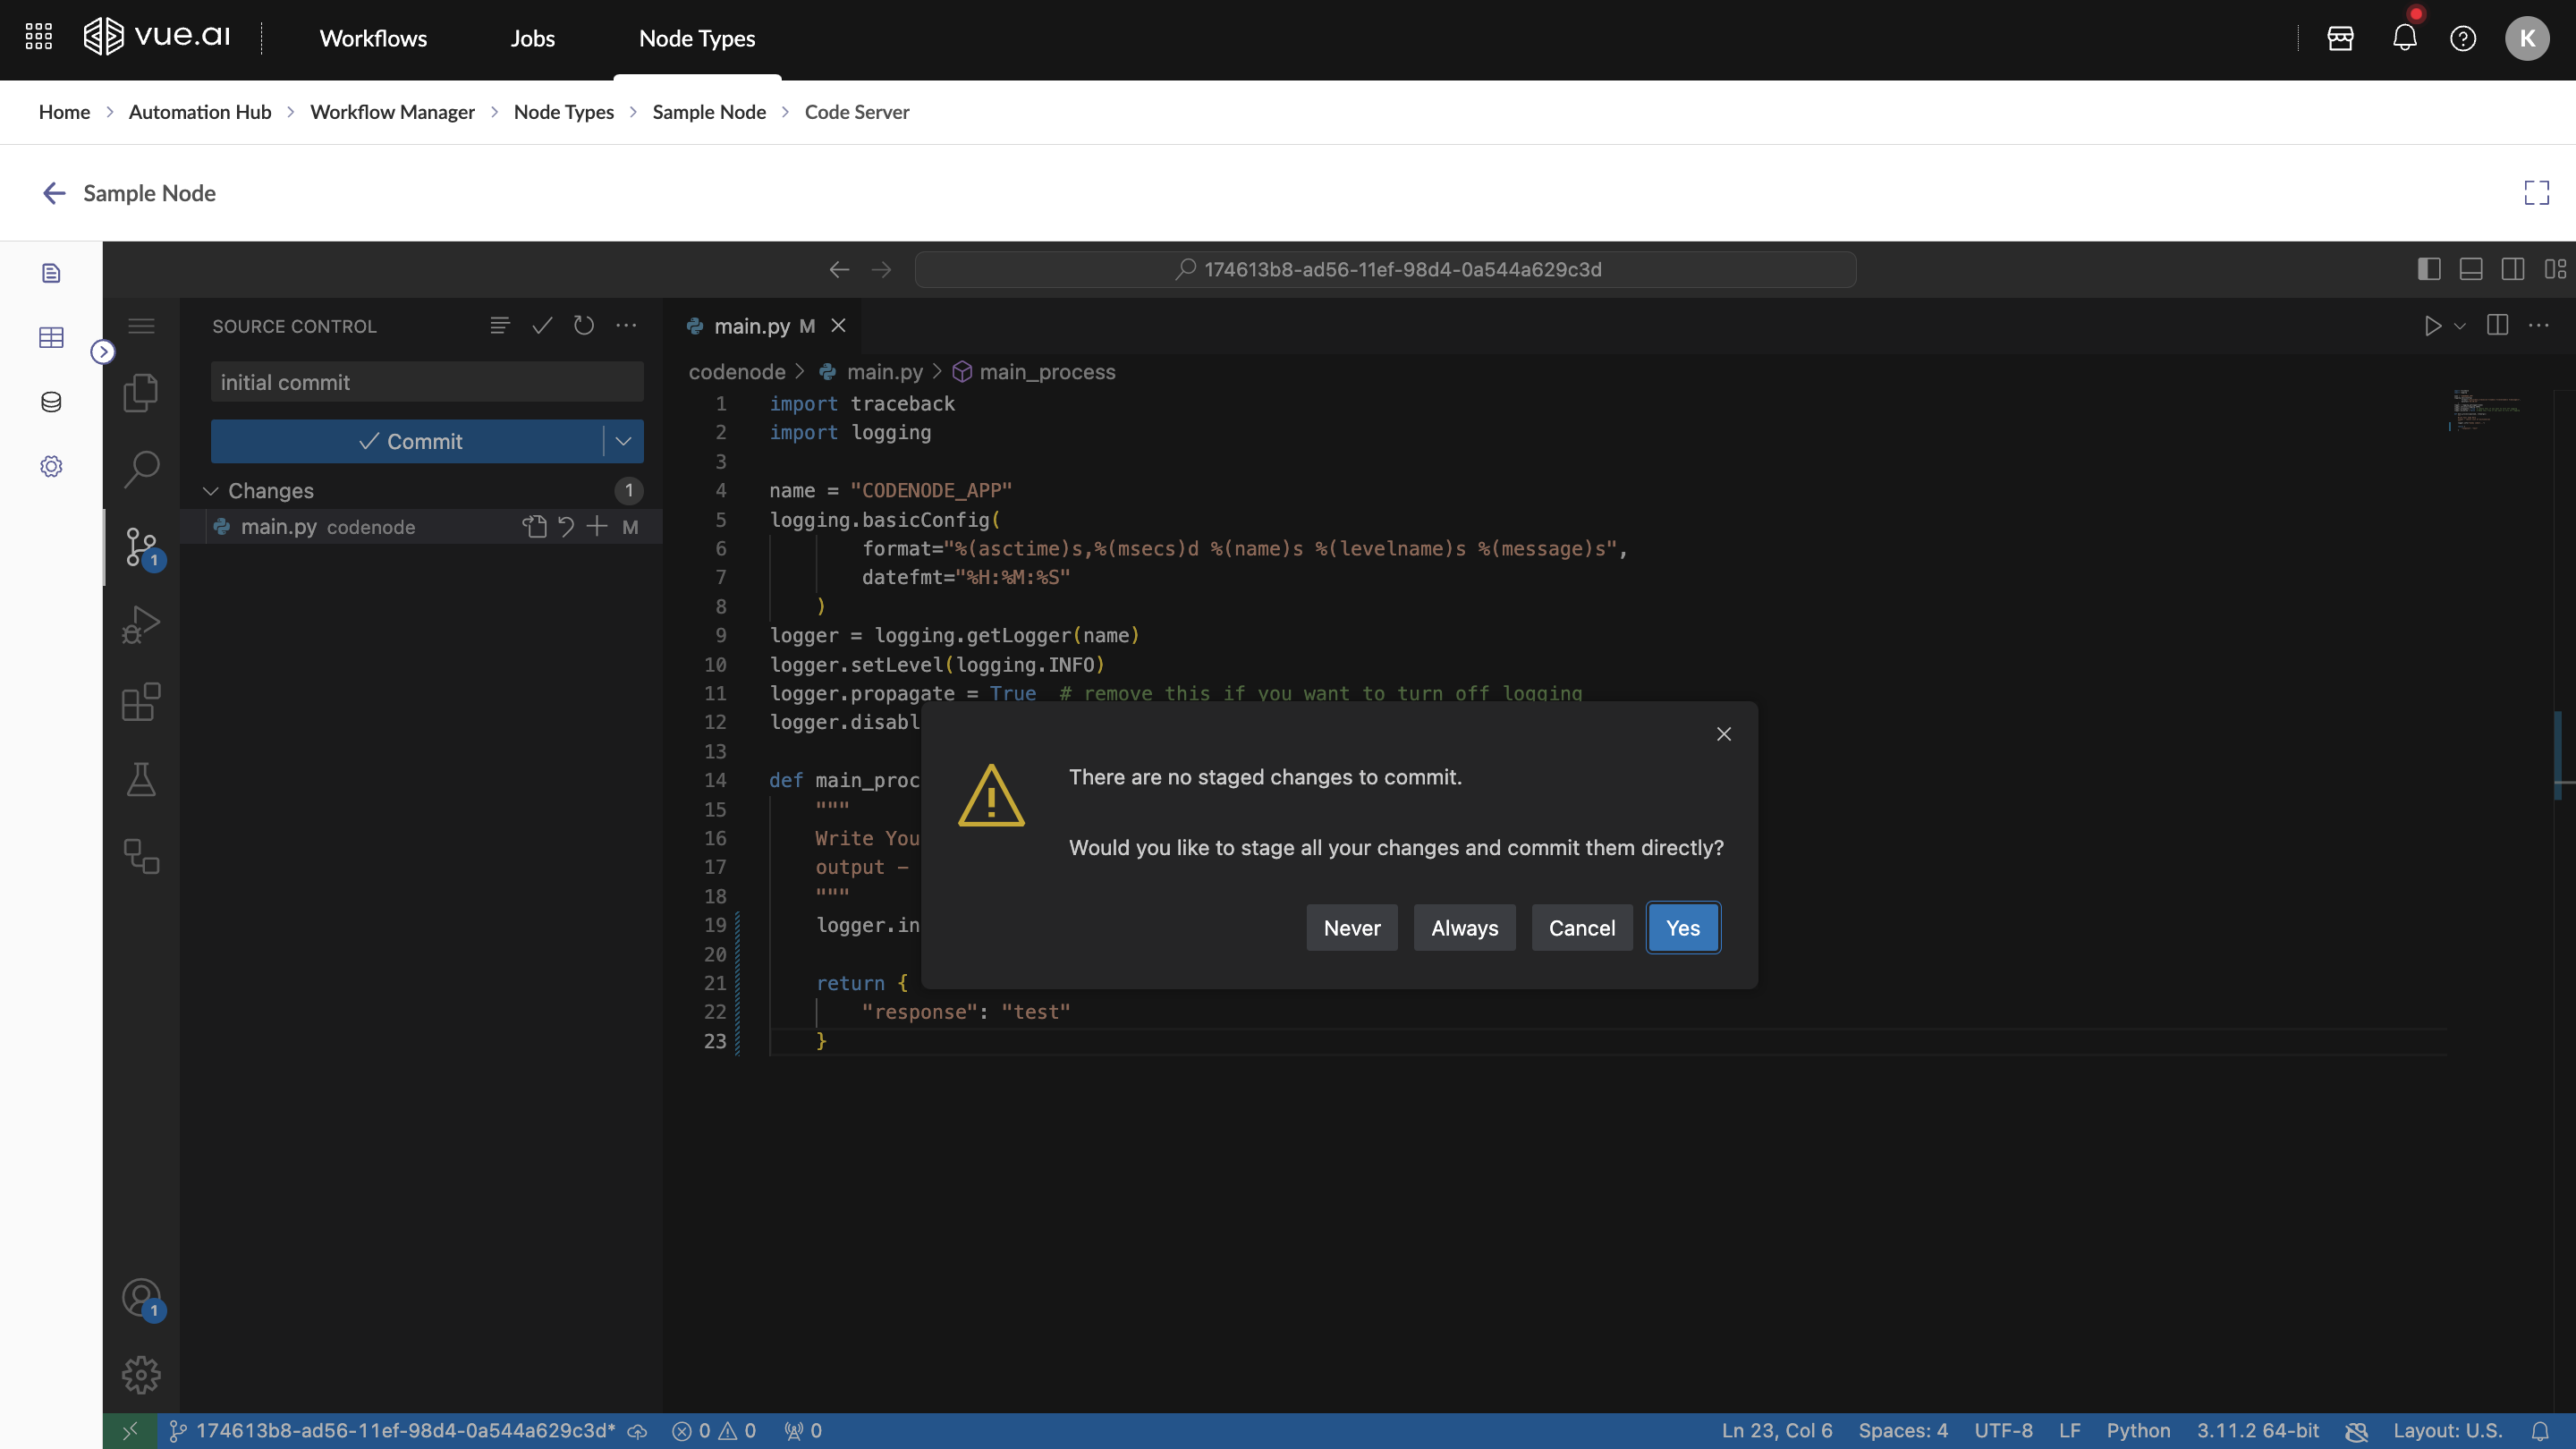
Using Terminal:
git add .
git commit -m "<Your Commit Message>"
git push
Monitoring Docker Builds Monitor Docker image builds using GitHub Actions within VS Code server:
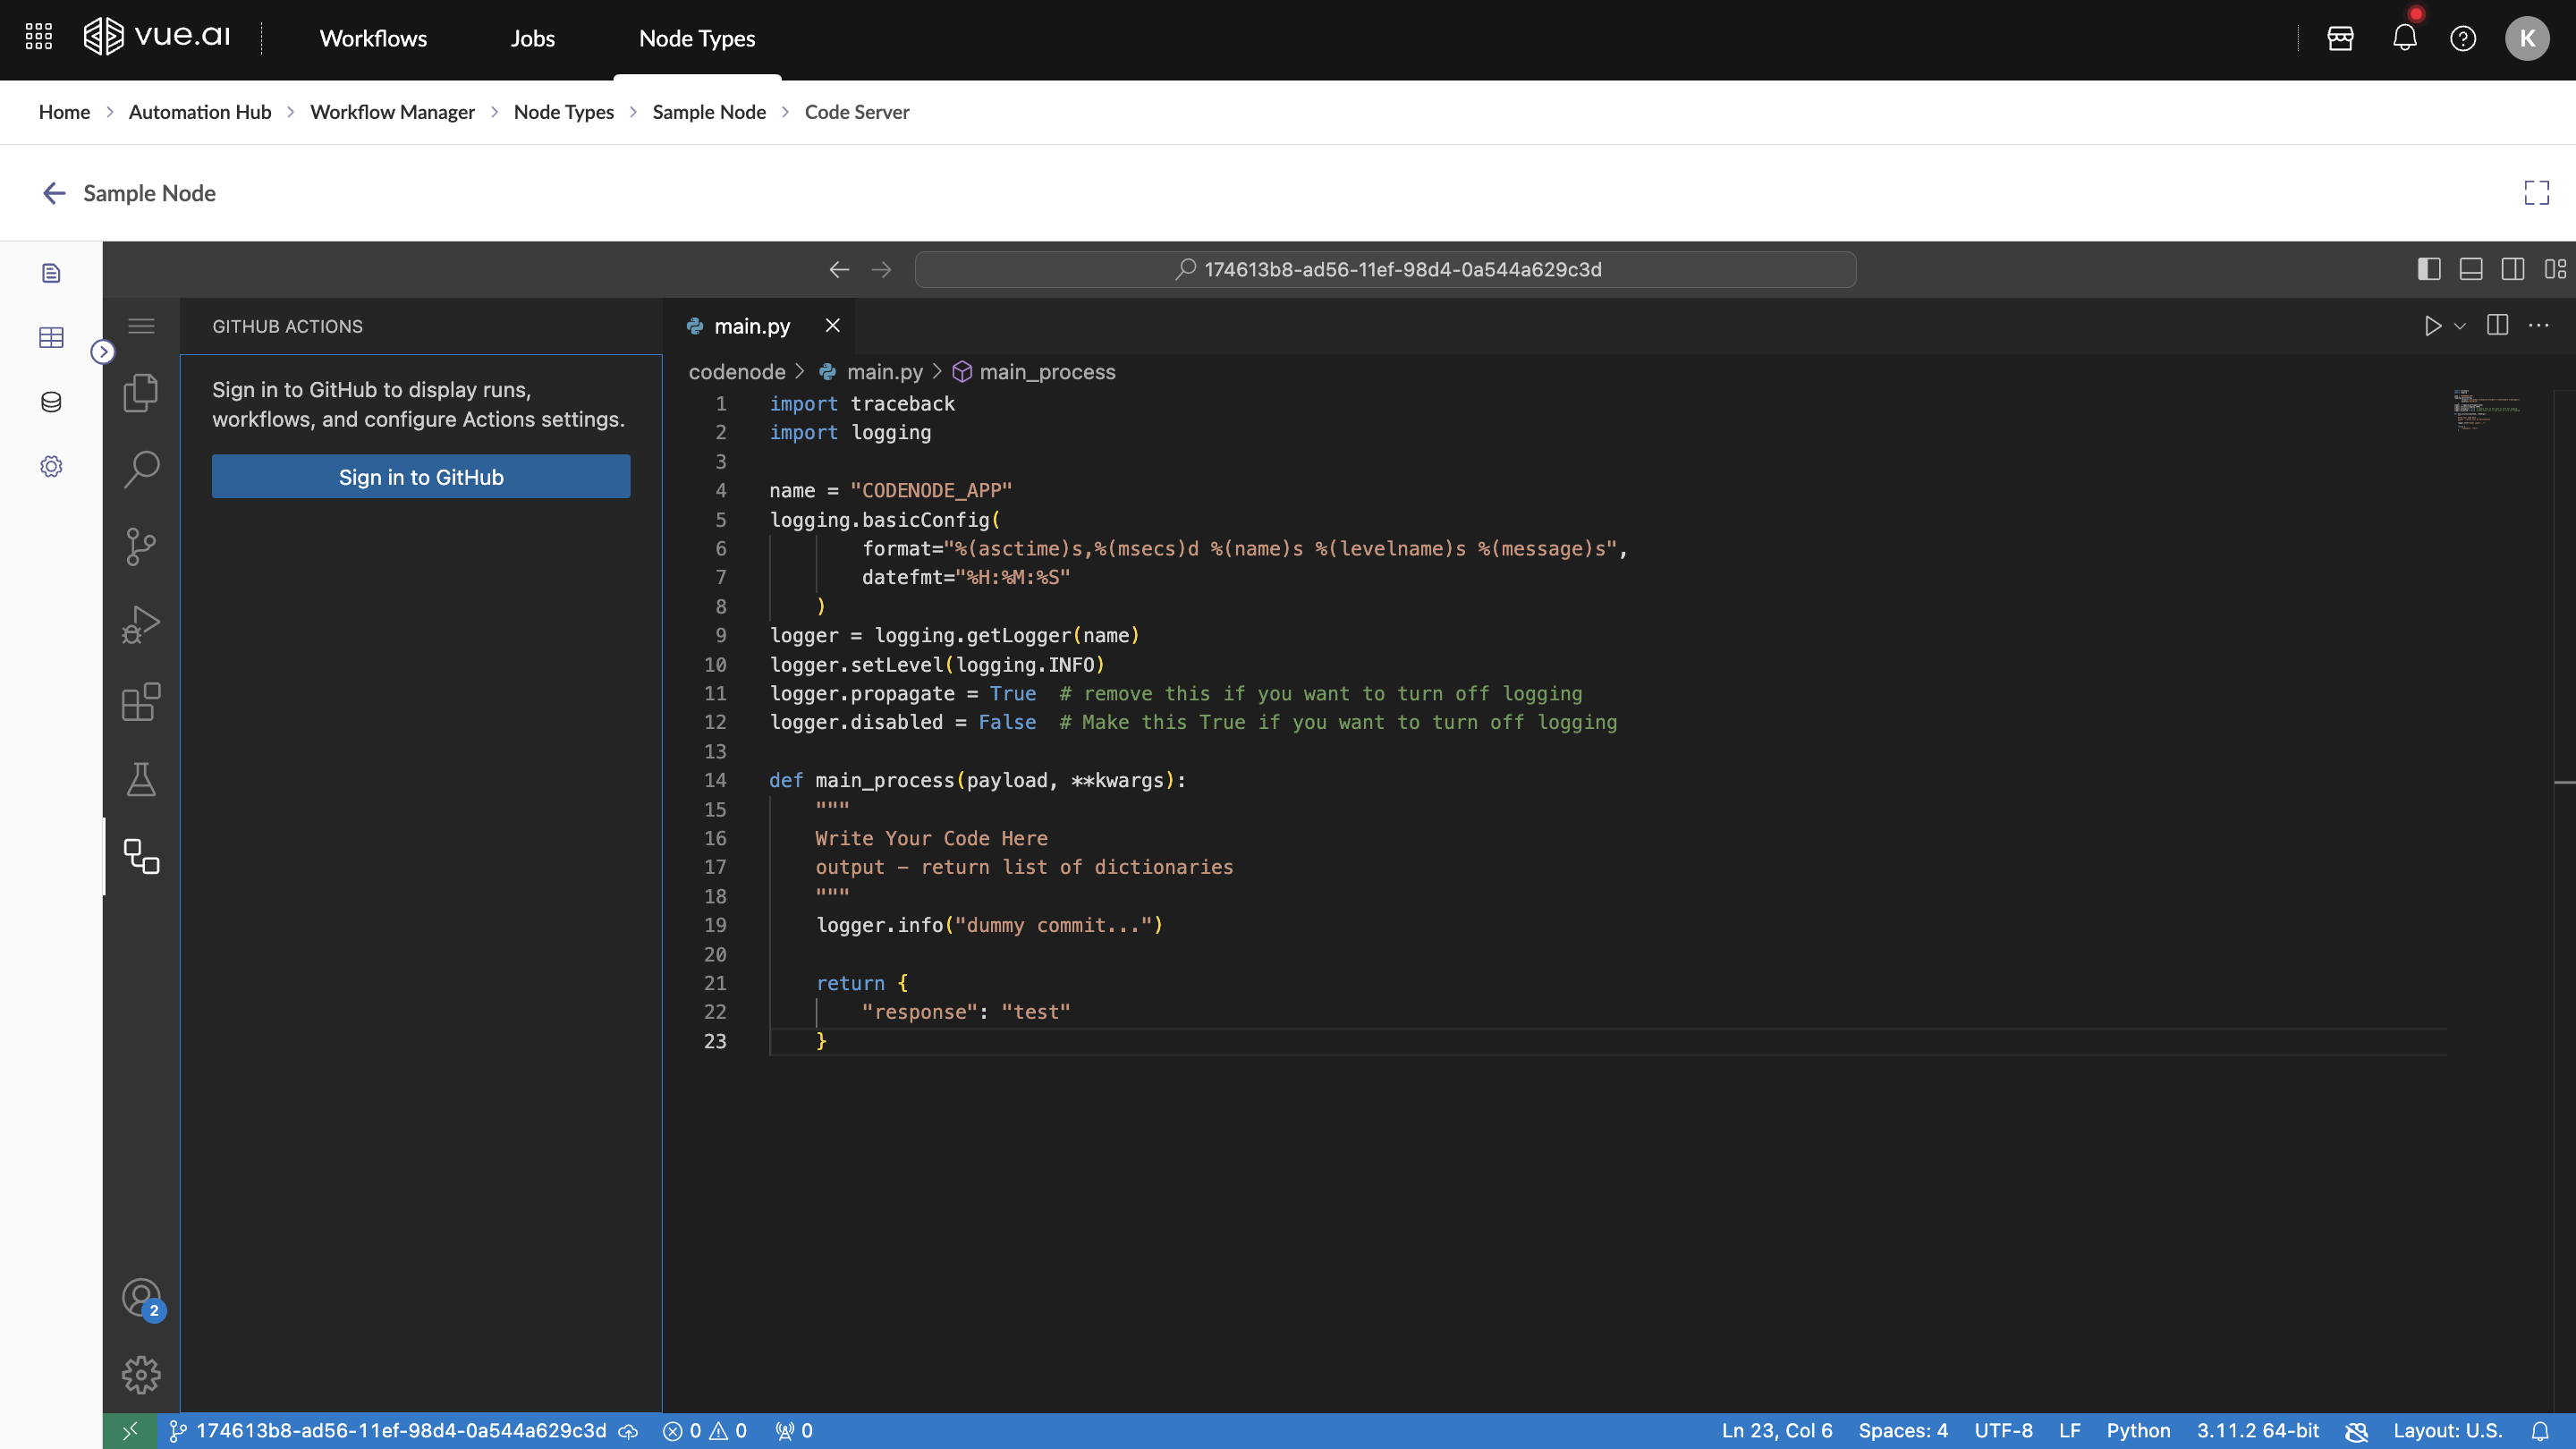
- Access GitHub Actions: Open GitHub Actions Tab and log in to GitHub account
- Track Build Progress: View detailed logs and troubleshoot errors
- Apply Changes: Navigate to Workflow section to update workflows after successful builds
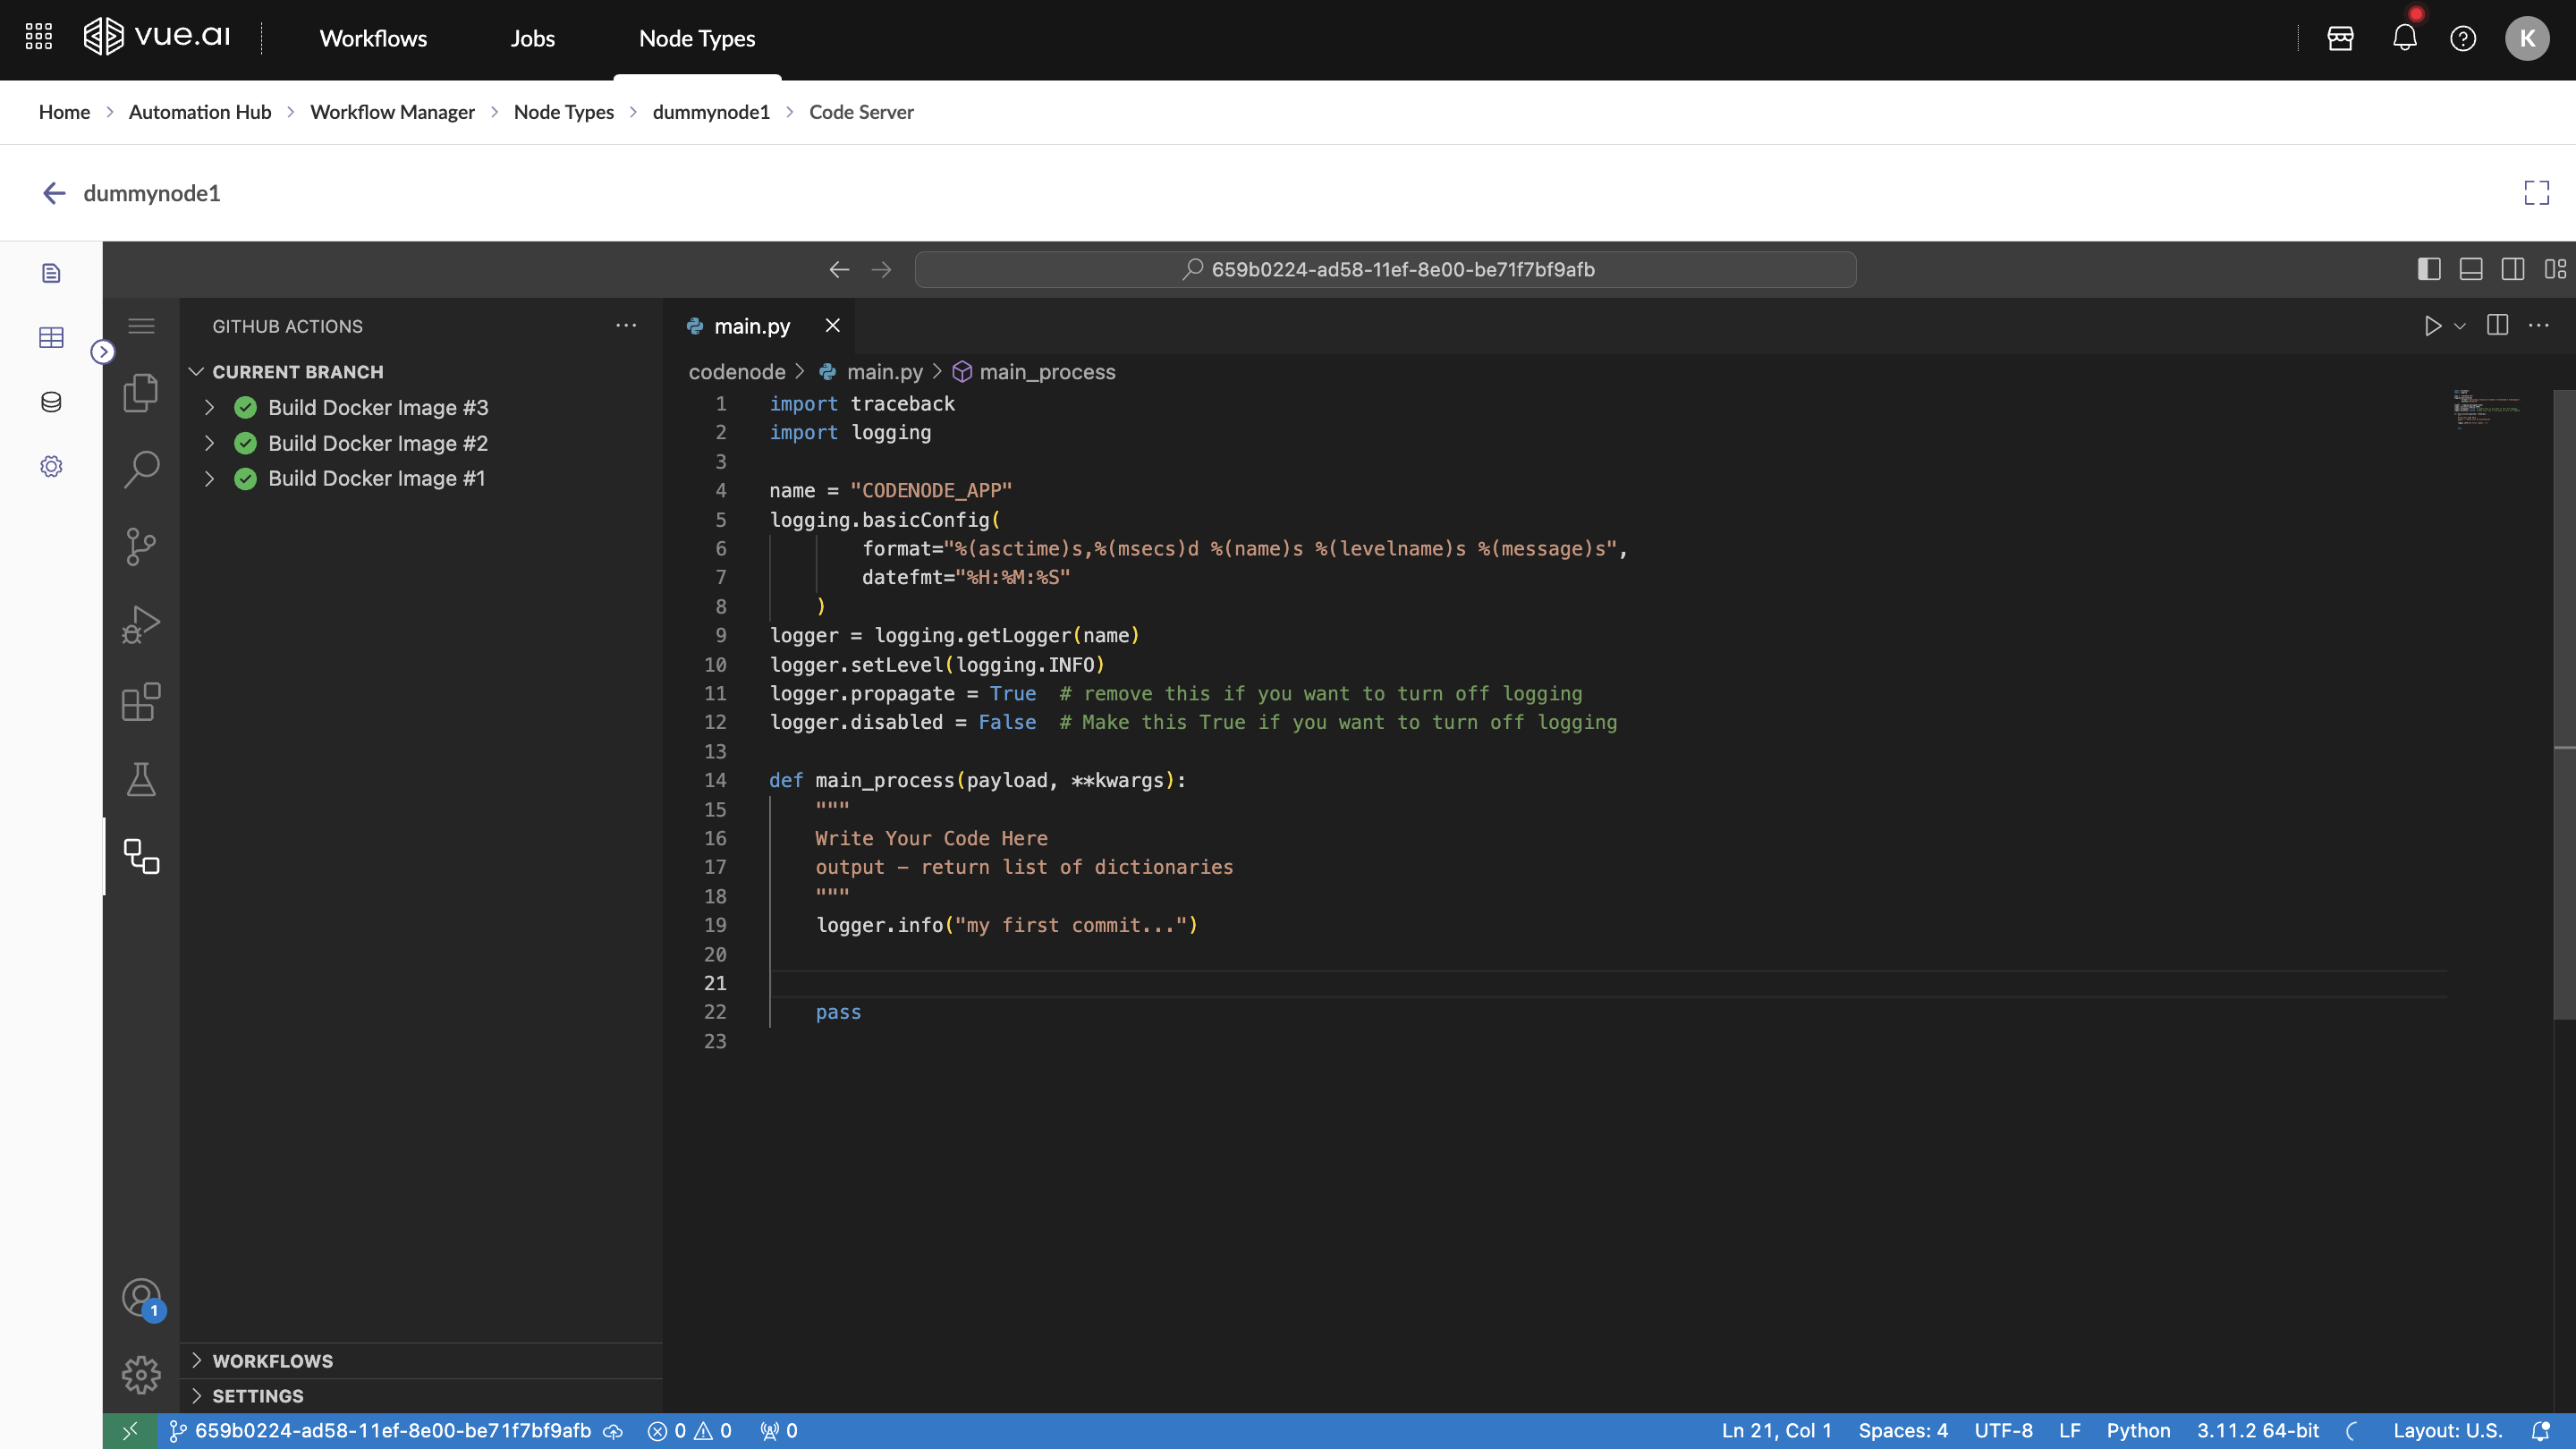
Developer Hub
Equip data scientists and engineers with cutting-edge notebooks and MLOps solutions.
- Streamline development workflows for scalable and production-ready applications
- Equip developers with tools for advanced data science and machine learning operations
Notebooks
Interactive and powerful tools for writing, executing, and visualizing code. Widely used in data science, machine learning, and scientific computing for combining code, text, and visualizations in a single environment.
Overview
This guide assists users in creating and managing notebooks efficiently, writing and executing code within notebook cells.
Prerequisites
- Access to Vue.ai Platform Developer Hub → Notebooks
- Understanding of Jupyter notebook concepts
Navigation Path
Navigate to Home/Landing Page → Developer Hub → Notebooks
If the page is not visible, navigate to File → Hub Control Panel and click Stop my server.
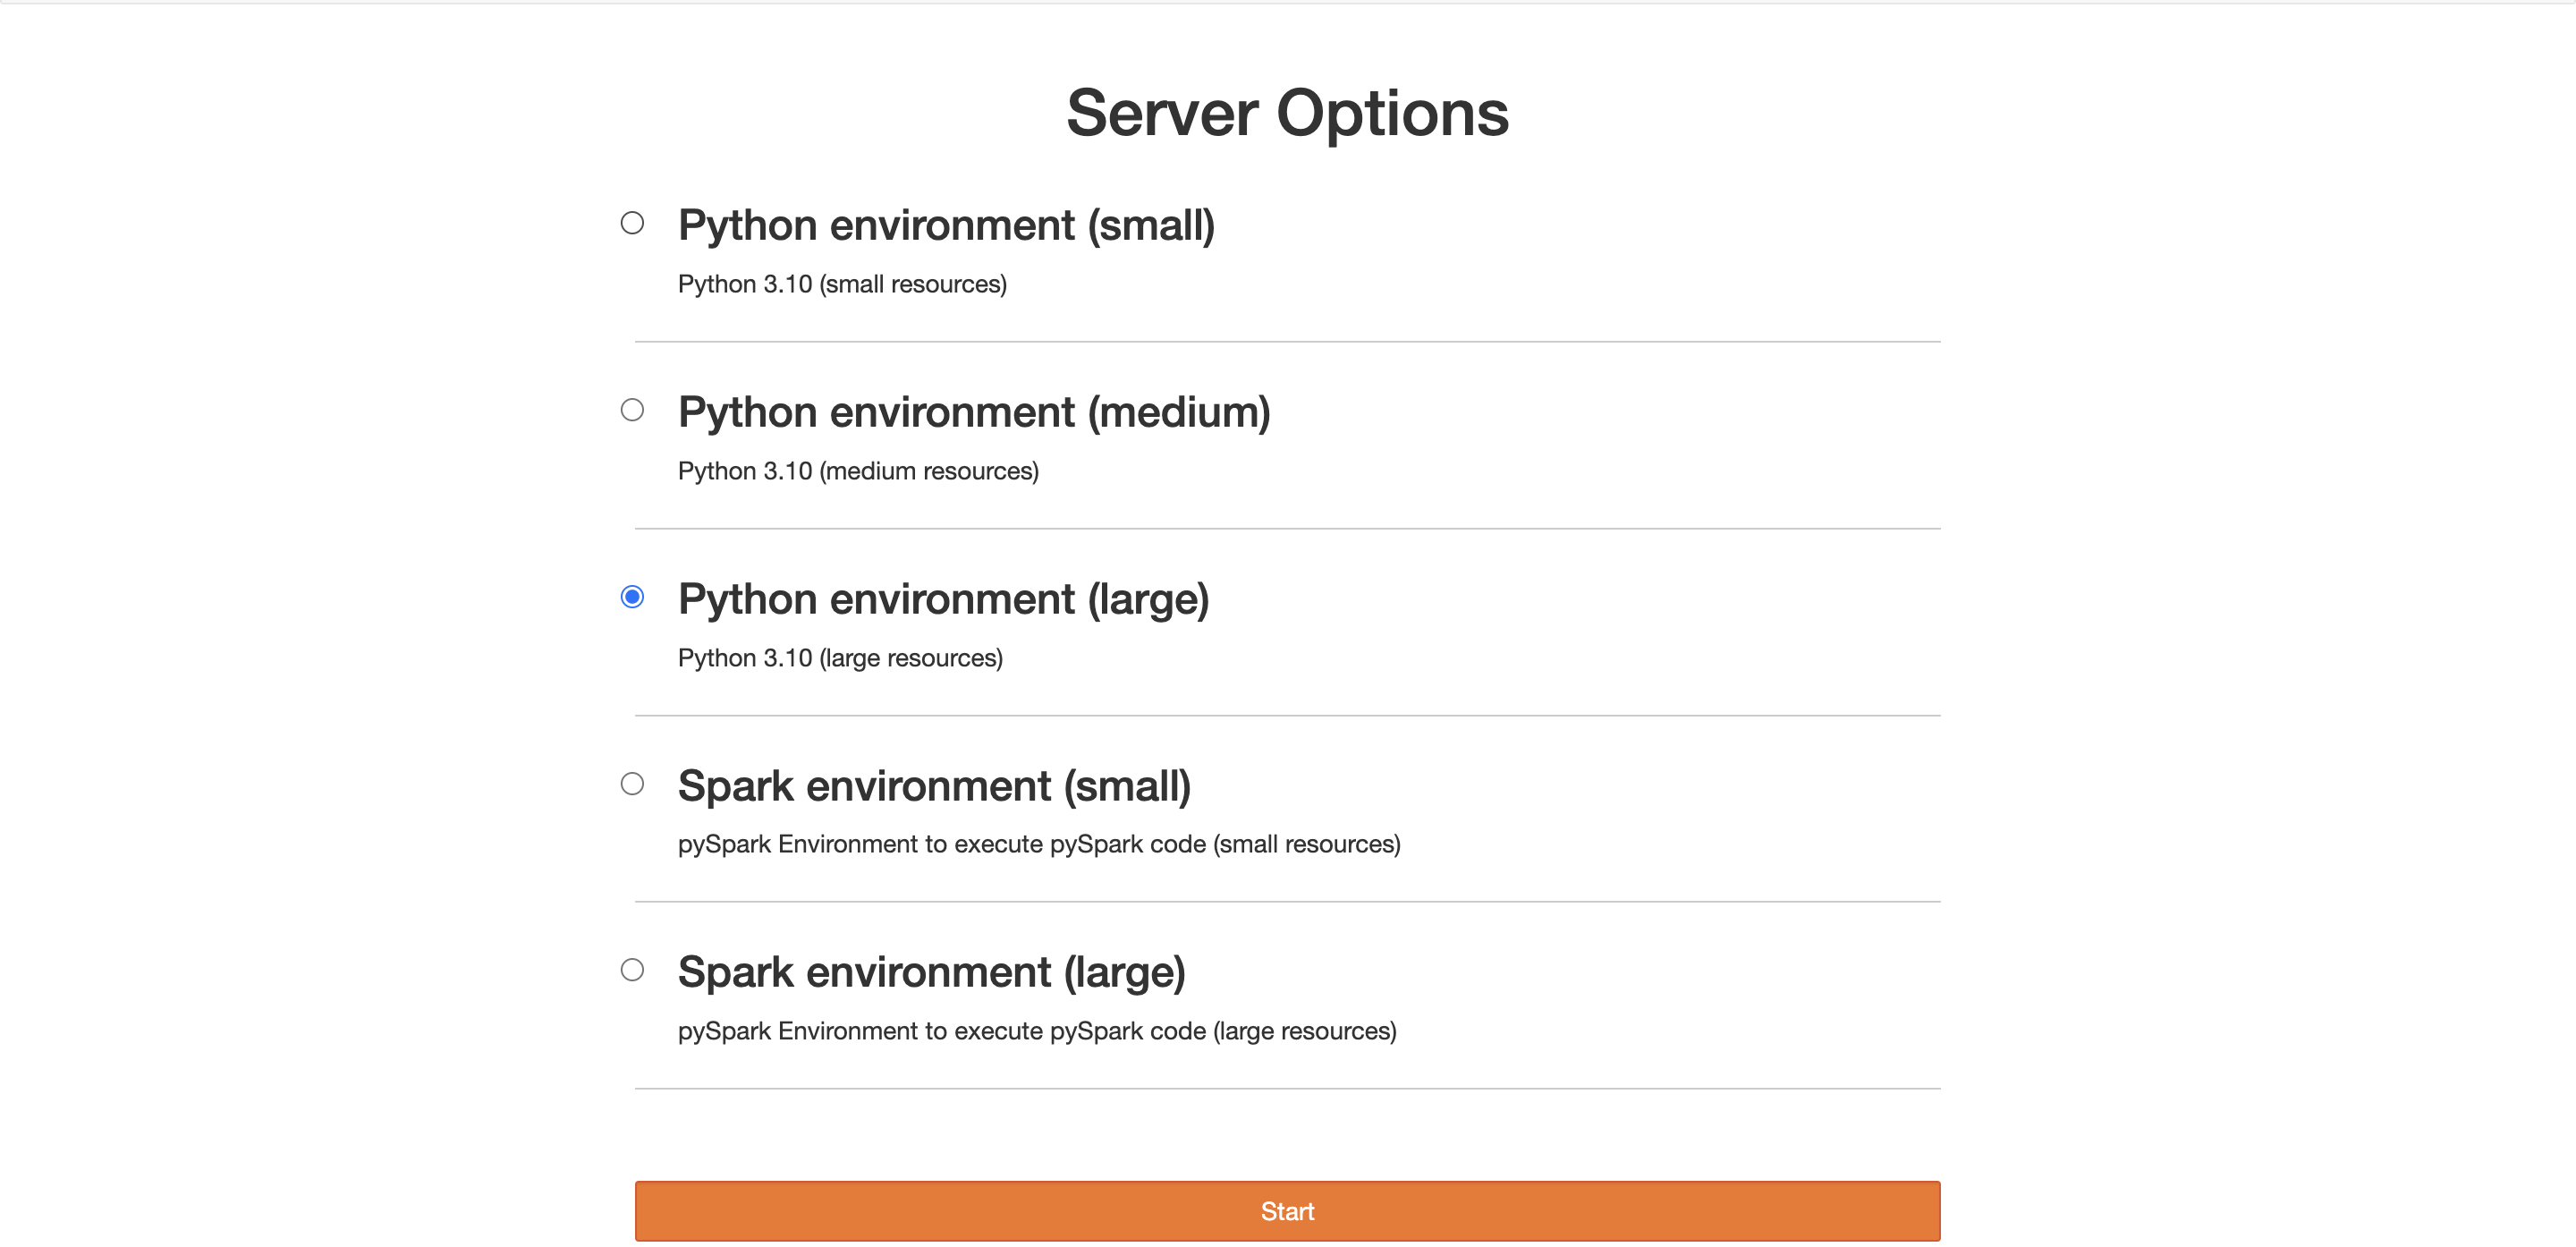
- Select the required environment depending on needs (Python / Spark) and click "Start"
- This will start setting up the selected environment and redirect once ready
Notebook Interface
Left Sidebar
- File Browser: Displays directory structure where Notebook is running
- Running Terminals and Kernels: Shows open files, running kernels, and terminals
- Table of Contents: Automatically generated from markdown cells, with linked sections
- Extension Manager: JupyterLab extensions for customizing themes, file viewers, editors, and renderers
Launcher Workspace
- Notebooks: Click Python 3 (ipykernel) icon to create new interactive Python notebook
- Console: Click Python 3 (ipykernel) icon to open interactive Python shell
- Other: Terminal, Text Files, Markdown, Python File
Menu Bar

- File: Manage notebooks and files (create, save, export, close)
- Edit: Perform actions like undo, redo, cut, copy, paste, find/replace
- View: Customize appearance (toggle line numbers, cell toolbar)
- Run: Execute code cells in notebook or console
- Kernel: Manage execution environment, restart or shut down
- Tabs: Manage open tabs or notebooks in workspace
- Settings: Customize notebook behavior and theme
Step-by-Step Instructions
Creating a New Notebook
Click the Python 3 (ipykernel) button in the Notebook section from the Launcher.
The new notebook opens in a new tab with default name Untitled.ipynb. Rename by clicking the current name at top and entering new name.
Upload a Notebook or File
- Click Upload icon in Left Sidebar File Browser
- Choose file to upload and click Open
- Upload existing notebooks or datasets for use in notebooks
- Selected file will be added to workspace
Creating & Using Datasets via Vue.ai SDK
The DatasetClient of Vue.ai SDK allows users to seamlessly create, list, edit, and delete datasets within notebooks.
For more information, visit Vue.ai Datasets and Data Service SDK - Datasets.
Switching between Environments
Notebooks support multiple execution environments based on workload requirements:
- Python environments: Small, Medium, and Large configurations for standard computations
- Spark environments: Small and Large configurations for distributed processing
Switching with Hub Control Panel
- Navigate to File → Hub Control Panel and click Stop My Server

- Once server is stopped, Start My Server button appears - click to select new environment

- Select environment based on requirements and click Start

Switching using LogOut
- Navigate to File → LogOut and click Stop My Server

- Click Login to select new environment - opens Server Options page
- Select environment and click Start
Additional Information
- Command mode: Used to execute code. Press esc key to enter command mode
- Editor mode: Used to write/edit code. Click on any cell to enter Editor mode
To save notebook in various formats, go to File → Save and Export Notebook As and choose from HTML (.html), LaTeX (.tex), Markdown (.md), PDF (.pdf), Executable python Script (.py).
MLOps
The MLOps SDK integrates with MLflow to facilitate creation of experiments, logging of multiple models, and comparison of different models using the MLflow UI.
Overview
This guide assists in understanding how to use the MLOps SDK to create experiments, log models, and compare different models in MLflow with a breast cancer classification problem example.
Prerequisites
- Access to the MLOps SDK
- MLflow server running and accessible
- Dataset for breast cancer classification

Using the MLOps SDK
Importing MLOpsClient
import pprint
from vue_pre_sdk.client import MLOpsClient
Initializing MLOpsClient
client = MLOpsClient(
    base_url="your_base_url",
    access_token="your_access_token",
    api_key="your_api_key",
    account_id="your_account_id"
)
Create an Experiment
create_experiment_payload = {
   "experiment_name": "Breast-Cancer-Experiment",
   "experiment_description": "Experiment to predict the breast cancer for a given patient",
   "tags": ['classification'],
}

created_experiment = client.experiments.create(create_experiment_payload)
pprint(created_experiment)
Train and Log Models
Multiple models (Logistic Regression, Random Forest, SVC) are trained and logged using the create_model API.
Preprocessing
import pandas as pd
import cloudpickle
import base64
import io
from sklearn.datasets import load_breast_cancer
from sklearn.model_selection import train_test_split
from sklearn.impute import SimpleImputer
from sklearn.ensemble import RandomForestClassifier
from sklearn.linear_model import LogisticRegression
from sklearn.svm import SVC
from sklearn.pipeline import Pipeline
from sklearn.preprocessing import OrdinalEncoder
import matplotlib.pyplot as plt
from sklearn.metrics import accuracy_score, precision_score, recall_score, f1_score

data = load_breast_cancer()
df = pd.DataFrame(data.data, columns=data.feature_names)
df['target'] = data.target

X_train, X_val, y_train, y_val = train_test_split(df.drop('target', axis=1), df['target'], test_size=0.2, random_state=42)
pipeline = Pipeline([
   ('imputer', SimpleImputer(strategy='mean')),
   ('encoder', OrdinalEncoder(handle_unknown='use_encoded_value', unknown_value=-1))
])

X_train_processed = pipeline.fit_transform(X_train)
X_val_processed = pipeline.transform(X_val)

Metrics Calculation and Model Serialization
def calculate_metrics(model, X_train_processed, X_val_processed, y_train, y_val):
   y_train_pred = model.predict(X_train_processed)
   y_val_pred = model.predict(X_val_processed)

   train_accuracy = accuracy_score(y_train, y_train_pred)
   train_precision = precision_score(y_train, y_train_pred)
   train_recall = recall_score(y_train, y_train_pred)
   train_f1 = f1_score(y_train, y_train_pred)
   val_accuracy = accuracy_score(y_val, y_val_pred)
   val_precision = precision_score(y_val, y_val_pred)
   val_recall = recall_score(y_val, y_val_pred)
   val_f1 = f1_score(y_val, y_val_pred)

   metrics_dict = {
      "training_metrics": {
            "accuracy": train_accuracy,
            "precision": train_precision,
            "recall": train_recall,
            "f1-score": train_f1
      },
      "validation_metrics": {
            "accuracy": val_accuracy,
            "precision": val_precision,
            "recall": val_recall,
            "f1-score": val_f1
      }
   }
   return metrics_dict

def serialize_object(model):
   model_bytes = cloudpickle.dumps(model)
   model_base64 = base64.b64encode(model_bytes).decode('utf-8')
   return model_base64
Model 1 - Logistic Regression
model = LogisticRegression()
model.fit(X_train_processed, y_train)
metrics_dict = calculate_metrics(model, X_train_processed, X_val_processed, y_train, y_val)
serialized_model = serialize_object(model)
serialized_pipeline = serialize_object(pipeline)

create_model_payload = {
   "model_name": "LogisticRegression",
   "model_description": "Logistic Regression model to predict breast cancer",
   "tags": ['Classifier', 'sklearn'],

   "experiment_name": "Breast-Cancer-Experiment",
   "task": "Classification",
   "is_automl": False,

   "model_parameters": {
      "model_architecture": "LogisticRegression",
      "library": "scikit-learn",
      "library_version": "1.5.0",
      "model_args": dict(model.get_params())
   },
   "metrics": metrics_dict,
   "artifact_config": {
      "model_object": serialized_model,
      "data_preprocessing_pipeline": [{"step_name": "pipeline", "preproc_object": serialized_pipeline}]
   },
   'model_interpretability': {
      'feature_scores': {
            'visual_representation_object': "",
            'tabular_representation_object': ""
      }
   }
}

created_model = client.models.create(create_model_payload)
Model 2 - Random Forest & Model 3 - SVC follow similar patterns with their respective configurations
Retrieve a Specific Model
model_id = "<model-id>"
retrieved_model = client.models.get(model_id)
pprint(retrieved_model)
Compare Model Performance
MLflow comparison feature is used to evaluate model metrics and determine the best model.
Load Model and Do Inference
model = client.models.get("<model-id>")
import joblib
X_val = <input-data>

SERVICE_PROVIDER = "<SERVICE_PROVIDER>"
REGION = "<REGION>"

artifact_path = model['data']['artifact_config']['model_path']
MLOPS_BUCKET_NAME = artifact_path.split('/')[2]
model_path = '/'.join(artifact_path.split('/')[3:])

storage = PolyCloudStorageSupport(SERVICE_PROVIDER, REGION, MLOPS_BUCKET_NAME)
model_bytes = storage.read_file_from_cloud(model_path)

ml_model = joblib.load(model_bytes)
prediction = ml_model.predict(x)
Delete Models
model_id = "<model-id>"
response = client.models.delete(model_id)
pprint(response)

MLOps v2 User Guide
Overview
This guide helps you learn how to use the MLOps SDK to manage experiments and models, interact with MLflow UI, and explore various logging features with different ML frameworks.
Prerequisites
- Access to the MLOps SDK
- MLflow server running and accessible

Using the MLOps SDK
Initializing MLOpsClient
import pprint
from vue_pre_sdk.client import MLOpsClient

client = MLOpsClient(
    base_url="your_base_url",
    access_token="your_access_token",
    api_key="your_api_key",
    account_id="your_account_id",
    version="v2"
)
1. Create Experiment
create_experiment_payload = {
   "experiment_name": "Breast-Cancer-Experiment",
   "experiment_description": "Experiment to predict the breast cancer for a given patient",
   "tags": ['classification'],
}

created_experiment = client.experimentsv2.create(create_experiment_payload)
pprint(created_experiment)
2. Create Model with Extensive Logging The flow includes:
- Load data, preprocess, split into train/validation sets, train model
- Encode model, image, and figure
- Log model, params, metrics, text, dictionary, image, figure, table, artifacts
- Create model and compare in MLflow UI
Data Loading and Preprocessing
data = load_breast_cancer()
df = pd.DataFrame(data.data, columns=data.feature_names)
df['target'] = data.target

X_train, X_val, y_train, y_val = train_test_split(df.drop('target', axis=1), df['target'], test_size=0.2, random_state=42)
pipeline = Pipeline([
    ('imputer', SimpleImputer(strategy='mean')),
    ('encoder', OrdinalEncoder(handle_unknown='use_encoded_value', unknown_value=-1))
])

X_train_processed = pipeline.fit_transform(X_train)
X_val_processed = pipeline.transform(X_val)

Only the following models can be encoded:
- Sklearn
- XGBoost
- Lightgbm
- Statsmodels
Model Training - Logistic Regression
lr_model = LogisticRegression()
lr_model.fit(X_train_processed, y_train)
encoded_lr_model = client.models.encode_model(lr_model)
metrics = calculate_metrics(lr_model, X_train_processed, X_val_processed, y_train, y_val)
Logging Capabilities
Log Model
loggers = {
    "model": {
        "model_library": "sklearn",
        "encoded_model": encoded_lr_model
    }
}

loggers = {
    "model": {
        "model_library": "sklearn",
        "model_path": "s3://bucket-name/path/to/model"
    }
}
The path can start with s3://, gs://, or abfs:// depending on the cloud provider.
Log Params
loggers = {
    "params": lr_model.params()
}
Log Metrics
loggers = {
    "metrics": metrics
}
Log Text
text = "This is a logistic regression model. It predicts breast cancer."
loggers = {
    "text": [
        {
            "file_name": "notes.txt",
            "text_value": text
        }
    ]
}
Log Dictionary
dictionary = {
    "model_name": "Logistic Regression",
    "model_library": "sklearn",
    "library_version": "1.24.3",
}
loggers = {
    "dictionary": [
        {
            "file_name": "model_dict.json",
            "dict_value": dictionary
        }
    ]
}
Log Image
from PIL import Image
image_path = "<image-path>"
image_object = Image.open(image_path)
encoded_image = client.models.encode_image(image_object, "PNG")

loggers = {
    "image": [
        {
            "file_name": "image.png",
            "encoded_image": encoded_image
        }
    ]
}
Log Figure
import matplotlib.pyplot as plt
import numpy as np
x = np.linspace(0, 10, 100)
y = np.sin(x)

fig, ax = plt.subplots()
ax.plot(x, y, label="Sine Wave")

encoded_figure = client.models.encode_figure(fig)

loggers = {
    "figure": [
        {
            "file_name": "model_dict.txt",
            "encoded_figure": encoded_figure
        }
    ]
}
Log Table
table = {
    "Features": ["BP", "Haemoglobin", "Sugar level"],
    "Importance": [0.1, 0.2, 0.3]
}
loggers = {
    "table": [
        {
            "file_name": "feature_importance.json",
            "table_value": table
        }
    ]
}
Log Artifacts
files = ["s3://bucket-name/path/to/file1", "s3://bucket-name/path/to/file2"]
folders = ["s3://bucket-name/path/to/folder1", "s3://bucket-name/path/to/folder2"]
loggers = {
    "artifact": {
        "files": files,
        "folders": folders
    }
}
Create Model
create_model_payload = {
    "model_name": "Logistic Regression",
    "model_description": "Logistic Regression model to predict breast cancer",
    "tags": ['Classifier', 'sklearn'],
    "experiment_name": "Breast-Cancer-Experiment",
    "task": "Classification",
    "loggers": loggers
}
create_model_response = client.models.create(create_model_payload)
pprint(create_model_response)
Multiple Models Comparison
Examples with Different ML Libraries
Lightgbm Model
import lightgbm as lgb
train_data = lgb.Dataset(X_train_processed, label=y_train)
params = {"objective": "multiclass", "num_class": 3}
model_lgb = lgb.train(params, train_data)

encoded_lgb_model = client.models.encode_model(model_lgb)
cloud_path = client.models.save_model_to_cloud(model=model_lgb, model_library="lightgbm", model_name="lightgbm_model")
Statsmodels
import statsmodels.api as sm

X_train_sm = sm.add_constant(X_train_processed)
model_sm = sm.MNLogit(y_train, X_train_sm).fit()
encoded_sm_model = client.models.encode_model(model_sm)
cloud_path = client.models.save_model_to_cloud(model=model_sm, model_library="statsmodels", model_name="statsmodels")
XGBoost Model
import xgboost as xgb

model_xgb = xgb.XGBClassifier(use_label_encoder=False, eval_metric="mlogloss")
model_xgb.fit(X_train_processed, y_train)
Tensorflow Model
from tensorflow import keras
(x_train, y_train), (x_test, y_test) = keras.datasets.mnist.load_data()
x_train, x_test = x_train / 255.0, x_test / 255.0

tf_model = keras.Sequential([
    keras.layers.Flatten(input_shape=(28, 28)),
    keras.layers.Dense(128, activation='relu'),
    keras.layers.Dense(10, activation='softmax')
])

tf_model.compile(optimizer='adam', loss='sparse_categorical_crossentropy', metrics=['accuracy'])
tf_model.fit(x_train, y_train, epochs=5, validation_data=(x_test, y_test))

cloud_path = client.models.save_model_to_cloud(model=tf_model, model_library="tensorflow", model_name="tensorflow_model")
Pytorch Model
import torch
import torch.nn as nn
import torch.optim as optim

class SimpleNN(nn.Module):
    def __init__(self, input_size, hidden_size, output_size):
        super(SimpleNN, self).__init__()
        self.fc1 = nn.Linear(input_size, hidden_size)
        self.relu = nn.ReLU()
        self.fc2 = nn.Linear(hidden_size, output_size)

    def forward(self, x):
        x = self.fc1(x)
        x = self.relu(x)
        x = self.fc2(x)
        return x

torch_model = SimpleNN(10, 20, 2)
cloud_path = client.models.save_model_to_cloud(model=torch_model, model_library="pytorch", model_name="pytorch_model")
Autologging Functionality Example showing autologging-like functionality to log models and metrics at each step:
for epoch in range(5):
    metrics["training_metrics"].append({
        "loss": loss.item(),
        "accuracy": accuracy
    })
    updated_model = client.models.update(model_id, {
        "loggers": {"metrics": metrics}
    })
Customer Hub
The Customer Hub empowers users to build customer profiles, configure personalized recommendations, manage digital campaigns, and optimize performance through experiments.
- Segmentation: Native industry-agnostic audiences for immediate personalization, custom visitor 360 profiles with custom audience capabilities, hyper-tuning audience parameters for refined visitor segmentation, and auto visitor segmentation
- Personalization: Industry-best out-of-the-box recommendation models, fine-tune dynamic personalized recommendation models to meet business needs, curation & bundling enhanced with personalized models for maximum gains, automated campaign management system for personalized content delivery, and dynamic experimentation capabilities for continuous recommendation optimization
- Performance Analytics: Analyze campaign performance with built-in analytics and build custom reports
Audiences
The Audience Manager enables businesses to create, manage, and analyze audience segments. It helps in understanding customer behavior and optimizing content targeting by segmenting the audience based on specific criteria.
Overview
Users can work with both preset audience segments and custom-built audiences, gaining insights into:
- Audience Size and Growth Trends: Monitor how your audience is expanding over time
- Engagement and Conversion Performance: Evaluate how well different segments are engaging with your content
- Comparative Analysis of Different Audience Segments: Compare performance across various audience groups
With Audience Builder
- Segment Visitors and Customers: Group based on shared characteristics, behaviors, and preferences
- Create Customized Audience Groups: Align with business goals, such as personalized recommendations
- Analyze Audience Engagement Levels: Enhance customer experience through detailed insights
With Audience Parameters
- Access Comprehensive Parameters: Define visitor/user attributes such as demographics, interests, and affinities
- Leverage Parameters for Targeting: Create precise and targeted custom audience segments
Audience Hub allows you to create custom audiences, access preset audiences, and view their related metrics & overlap information.
Key Features
- Create Custom Audiences: Design tailored audiences based on user segments and behaviors
- Preset Audiences: Access pre-built audiences that provide insights and help with targeting
- Custom Audience Metrics: View detailed metrics for custom and preset audiences
- Key Benefits: Optimize audience targeting, improve user engagement, and drive marketing strategies
Audience Performance Tracking
- Audience Performance Tracking: Monitor the performance of various audiences using detailed metrics
- Overlap Information: Understand the relationship between audiences and how they intersect
- Data-Driven Insights: Leverage audience data to refine marketing strategies and optimize campaigns
Latest Activities
- Track Changes: View the latest activities from you and your colleagues within Audience Hub
- Edit Activity: Click the 'Edit' icon to access and modify any activity
- Keep Track: Stay updated with the ongoing changes and updates to audience configurations
Audience Listing
The Audience Manager allows users to view, manage, and upload audiences within the system. You can search, filter, and sort audiences in a table format, with options for uploading custom audiences, checking performance data, and exploring audience overlap information.
Prerequisites
- Access to Audience Hub → Audience Manager → Audience Listing
Navigation Path Navigate to Audience Hub → Audience Manager → Audience Listing
Step-by-Step Instructions
Search for an Audience
- In the Audience Manager, use the search bar to search for audiences by name or recent keywords
- The table will display results based on your search criteria
Sort Columns
- Hover over a column header to find the sort icon

- Click the sort icon to toggle between ascending and descending alphabetical order
- If multiple columns have sorting applied, the last applied sort will take precedence
Filter Columns
- Hover over a column header to find the filter icon

- Click the filter icon to open a dropdown menu where you can multi-select filter values
- You can also search for specific filter values within the dropdown
- The table will update to reflect the filtered results
Upload a Custom Audience
- Navigate to the Audience Hub → Audience Manager
- Click on the 'Upload Audience' button
- Download the .csv template and populate it with the necessary data (optional)
- Drag and drop your .csv file or browse and select the file to upload
- Enter a name and description for your audience
- Click on 'Upload'
- The uploaded audience will appear in the Audience listing table
Performance Metrics In the Audience listing table, you will find performance metrics next to each audience name:
| Metrics | Description |
|---|---|
| Conversion Rate | Number of orders placed per visit |
| Revenue Per Visitor | Total revenue generated per visit |
| AOV | Average revenue generated per order |
| Unique Visitors | Number of unique visitors |
| Last Run Date | Date when the audience was last updated |
Checking Overlap Information
- In the Audience listing table, click on the 'Overlap' icon next to the audience name
- View the overlapping details for the selected audience compared to all other available audiences
Export an Audience
- In the Audience listing table, click on the export icon next to the desired audience
- Export the audience data as a CSV file for further use
Audience Builder
Audience Builder allows you to segment your visitors into different audiences based on your business goals. It helps you define custom audiences by identifying visitors who share similar characteristics.
Prerequisites
- Familiarity with the platform's Audience Manager and basic setup for defining events
Navigation Path Navigate to App Drawer → Audience Manager → Audience Builder or Audience Manager → Audience Builder on the navigation bar
Step-by-Step Instructions
Step 1: Create a New Audience
- On the Audience Listing Screen, click Create Audience
- Choose Build via Form to define an audience using conditions
- Alternatively, choose Upload via CSV to create an audience based on visitor IDs from a CSV file
Step 2: Define Audience Details
General Settings
- Audience Name: Give your audience a unique name
- Description: Add a brief description of the audience
- Duration Settings:
- Refresh Frequency: Options are 'Once every 4 hours', 'Once every 6 hours', 'Once every 8 hours', 'Once every 12 hours', or 'Once a day'
- Lookback Period: Options include 'Last 1 day', 'Last 7 days', 'Last 30 days', 'Last 60 days', 'Last 90 days', or 'Last 180 days'
Define Audience Criteria
- Condition Groups: You can define criteria using Parameters, such as demographics, interests, or behaviors
- A Condition Group contains rules with conditions (e.g., 'Brand Equals Nike', 'Country Equals India')
- A Sequence Group allows defining sequential behaviors (e.g., 'User added to cart, then bought within 2 days')
Step 3: Create the Audience Once the criteria are defined, click Create to finalize the audience.
It may take 20-30 minutes to create the audience. You can save your progress by clicking Continue Later.
Example: Creating a Simple Audience
- Audience: Male iPhone users
- Group 1: Gender = Male
- Group 2: iPhone User = Yes
Example: Creating an Audience with Sequence
- Audience: Users who added shoes to cart on Tatacliq and bought them within 1 day
- Group 1 (Add to Cart Event): Event = Add to Cart, Product = Shoes
- Group 2 (Buy Event): Event = Buy, Product = Shoes, Followed by = 1 day
Step 4: Upload Audience via CSV
- Click the down arrow next to Create Audience
- Select Upload via CSV
- Provide a name, description, and upload the CSV file
The maximum file size for the CSV is 50 MB, and user IDs must be anonymous.
Audience Metrics and Information After creating the audience, you can view metrics and performance insights, such as:
- Number of Sessions
- Revenue Generated
- Average Order Value
- Conversion Rates
Glossary
| Term | Definition |
|---|---|
| Parameter | A dimension or field that describes a visitor/user, such as gender, number of visits, or category |
| Condition Group | A group of conditions used to define an audience based on specific parameters and values |
| Sequence Group | A series of events that occur in sequence, defining specific user behavior over time |
| Logical Operator | Used to combine conditions: 'AND' (both conditions must be true), 'OR' (either condition must be true) |
| Boolean Operator | Operators like 'Equals', 'Greater than', 'Less than' used for defining conditions in rules |
| Time Operator | Specifies time-based conditions such as 'Within', 'After', or 'None' to define event relationships |
Audience Presets
Preset Audience computation is done once every 24 hours at the time specified by you.
Audience Segments
| Audience Segment | Description | Lookback | Supported Industries |
|---|---|---|---|
| New visitors | Customers who are visiting your site for the first time | lifetime | Yes, for all Industries |
| Customers with only 1 order | Customers who have made only one order in their lifetime on the site | lifetime | Yes, for all Industries |
| Repeat visitors with no cart additions or purchases | Customers who have repeatedly visited your site but never made any cart additions or purchases | lifetime | Only for Retail |
| Cart Abandoners | Customers who have added a product to cart in the last 30 days but not made a purchase | 30 days | Yes, for all Industries |
| Repeat Buyers | Customers who have made more than 1 purchase in their lifetime on the site | lifetime | Yes, for all Industries |
| High Spenders | Customers who spend more than an average spender in the last 3 months | 90 days | Yes with data constraints |
| Full Price purchasers | All products purchased at full price in the last 3 months | 90 days | Yes with data constraints |
| Discount Purchasers | All products purchased at discounted price in the last 3 months | 90 days | Yes with data constraints |
| Bulk Purchasers | Customers/Dealers/Wholesale purchasers who make bulk purchases in the last 3 months | 90 days | Yes with data constraints |
| Browsers without Vue.ai engagement | Customers who view products without clicking on recommendations in the last 3 months | 90 days | Yes, for all industries |
| Browsers without any Vue.ai exposure | Customers who view products without viewing any recommendations in the last 3 months | 90 days | Yes, for all Industries |
| Purchasers without any Vue.ai engagement | Customers who have made purchases without any clicks on Vue.ai modules in the last 3 months | 90 days | Yes, for all Industries |
| Purchasers without any Vue.ai exposure | Customers who have made purchases without exposure Vue.ai modules in the last 3 months | 90 days | Yes, for all Industries |
| Desktops Visitors | Users who have visited the site from Desktop | 90 days | Yes, for all Industries |
| Mobile Visitors | Users who have visited the site from Mobile | 90 days | Yes, for all Industries |
Digital Experience Manager
The Digital Experience Manager (DXM) allows businesses to create, personalize, and manage user experiences across different digital touchpoints. It helps in delivering tailored content and optimizing customer journeys.
Overview
With DXM, users can:
- Create and Deploy Personalized Experiences: Improve customer engagement with tailored content
- Perform Multivariate Testing (A/B Testing): Determine the most effective content variations
- Configure and Manage Recommendation Strategies: Deliver dynamic, relevant content
- Track Real-Time Performance Metrics: Assess user behavior, conversion rates, and engagement levels
Key Features
Metrics
- View metrics for each feature in DXM Hub
- Navigate to the Metrics feature via the Metrics Card by clicking on the 'Go to' CTA
Support Documents and FAQs
- Access support documentation, the FAQ, and an inspiration library related to DXM Hub
Latest Activities
- View a list of the 50 latest changes made by you and your colleagues across DXM Hub
- Click the Edit icon on any activity to be redirected to the detailed screen of that activity
Strategy
- View details about the latest three created or modified strategies
- You can navigate to the strategy listing screen by clicking on the "View All" CTA
Experiences
- View details about the latest three created or modified experiences
- You can navigate to the experience listing screen by clicking on the "View All" CTA
Pages
- View details about the latest three created or modified pages
- You can navigate to the page listing screen by clicking on the "View All" CTA
Experiments
- View a list of the 50 latest changes made by you and your colleagues across DXM Hub
- Click the Edit icon on any activity to be redirected to the detailed screen of that activity
Strategies
With Strategies
Users can:
- Select a Model for Personalized Content Recommendations: Choose the best model for your needs
- Configure Model Parameters and Define Business Rules: Tailor recommendations to business objectives
- Set Up Events to Trigger Tailored Recommendations: Automate content delivery based on user actions
Creating a Strategy
Creating a strategy is the foundational step in crafting a personalized user experience. This process involves tailoring model parameters to meet your needs and customizing content recommendations based on user behavior, business rules, and various other configurations.
Navigation Path Navigate to Strategy → Strategy Listing → Create Strategy
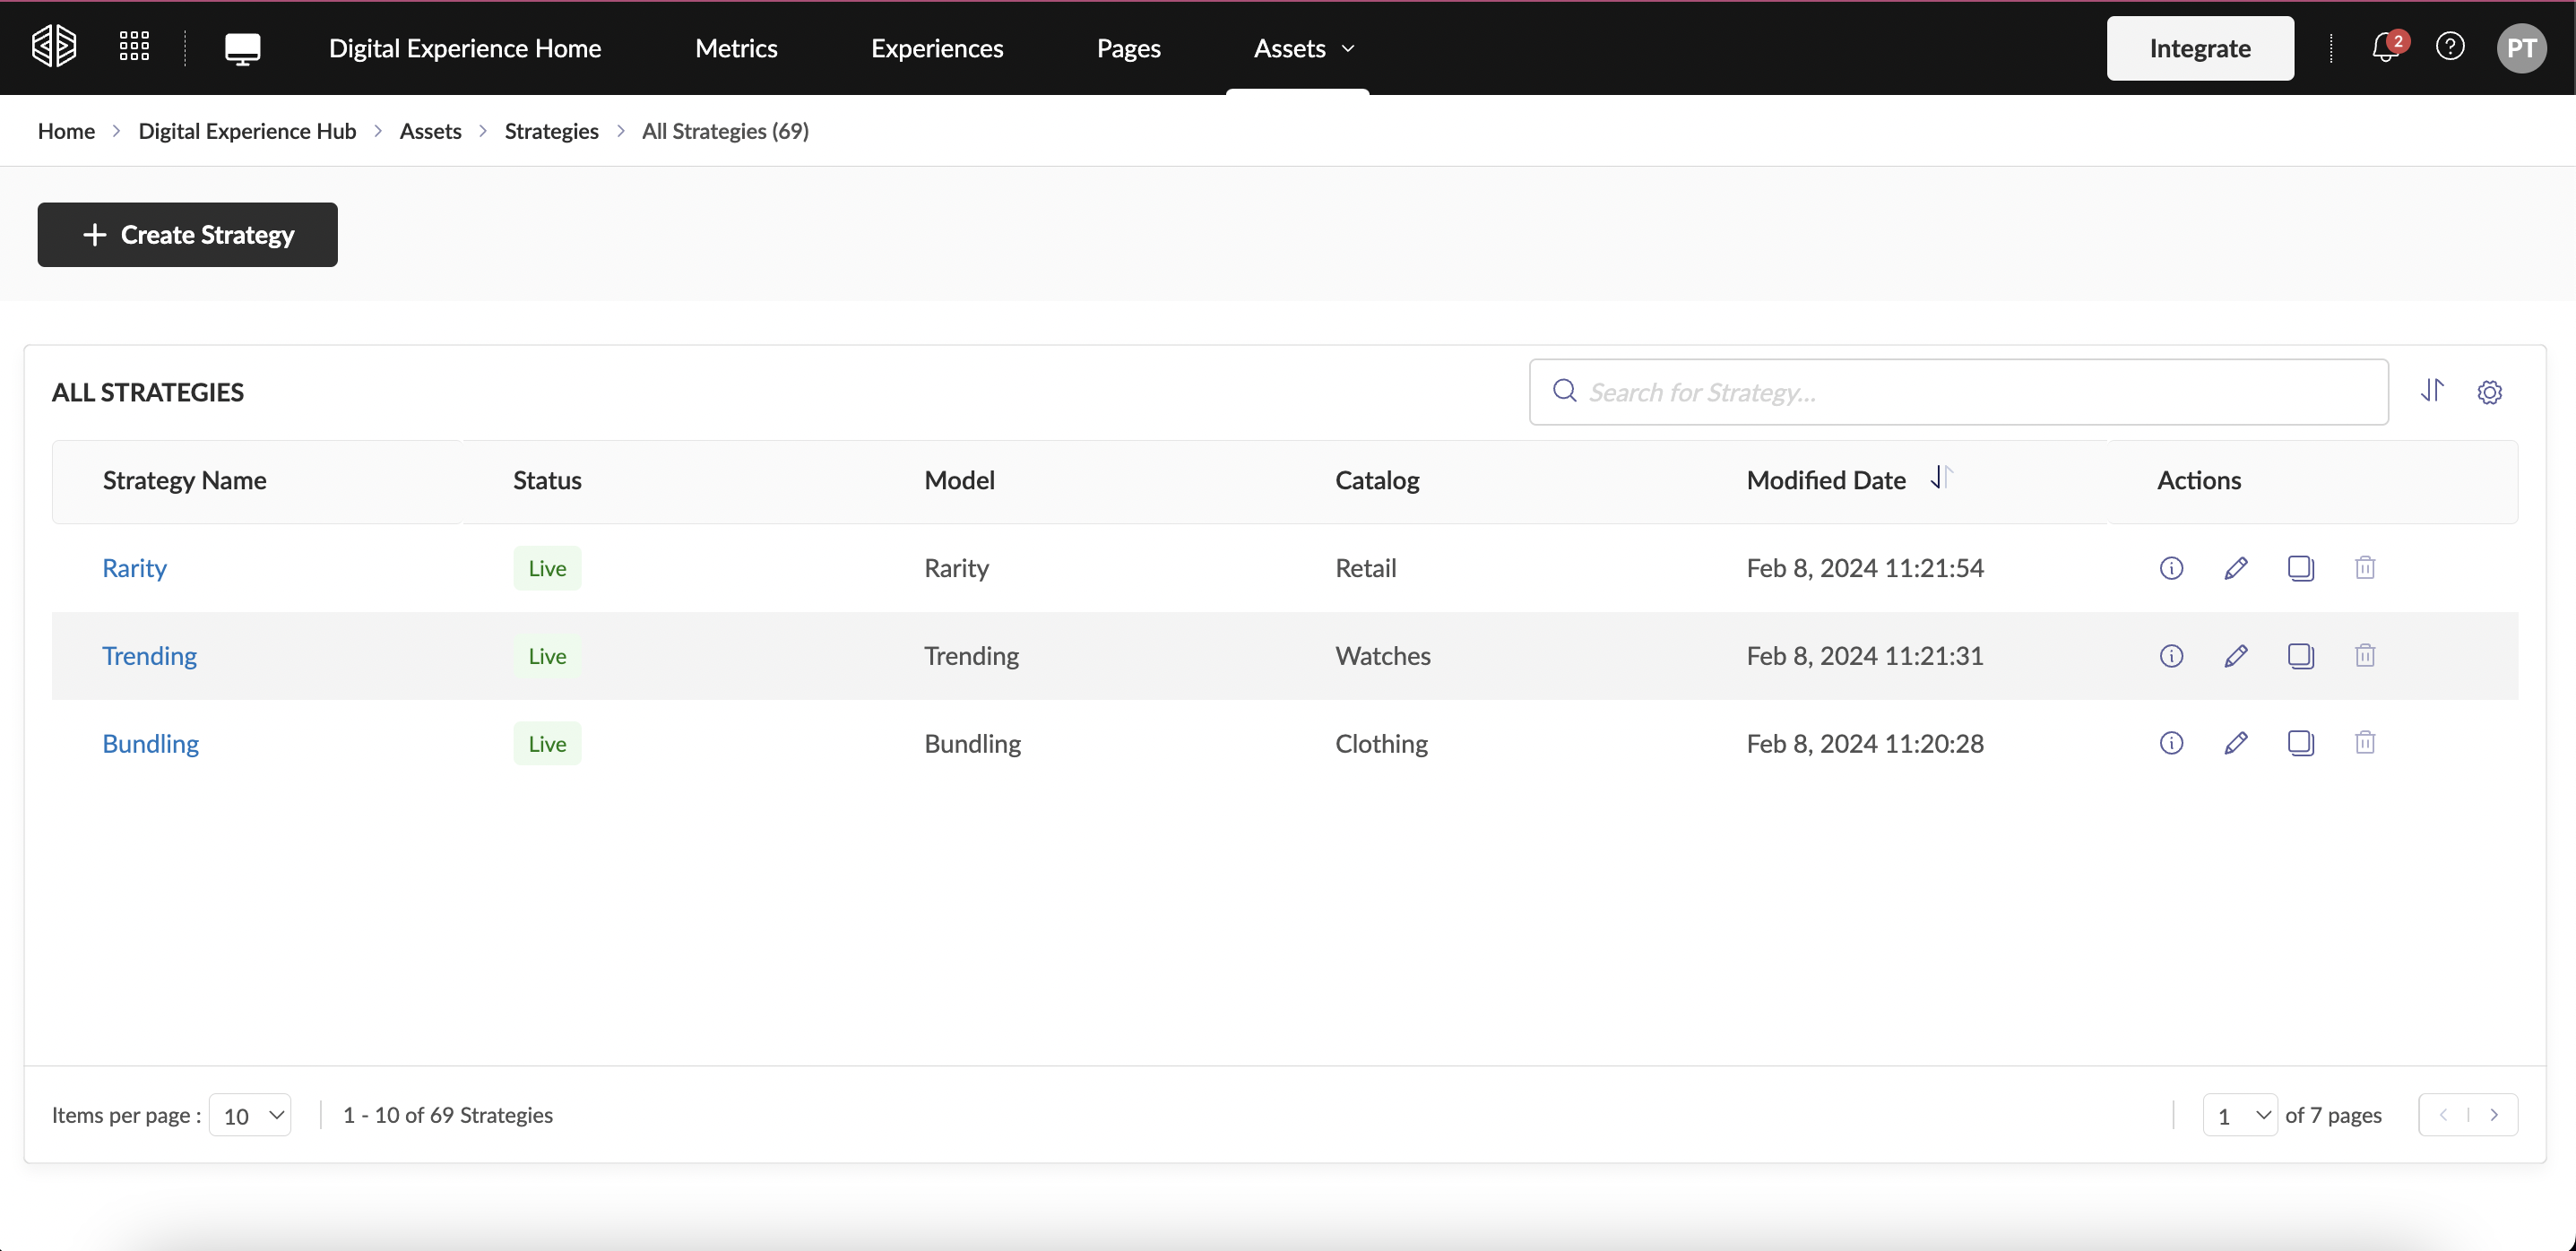
Step 1: Create a New Strategy Click the Create Strategy button to begin the configuration process. You will be prompted to:
- Enter a unique name for the strategy
- Select the catalog that will be used to serve recommendations
- Choose a model: Depending on the model selected, you will be presented with relevant parameters to configure
Step 2: Configure Model Parameters You can configure model parameters based on the catalog you select. These include:
- Content Attributes: Select attributes such as brand, color, or pattern, and assign a priority score to indicate their importance
- Indexed Fields: Content attributes available during catalog onboarding in Content Hub will be used for these configurations
Step 3: Configure Events Events allow you to personalize recommendations based on user actions:
- Add to Cart: Display products added to the customer's cart in the last X days
- Add to Wishlist: Show products added to the wishlist in the last X days
- Pageview: Recommend products viewed by the customer in the last X days
- Buy: Display products purchased by the customer in the last X days
Choose a Look Back Period (Daily, Weekly, Monthly, etc.) and assign priority scores to these events.

Step 4: Apply Business Rules (Optional) Business rules allow you to filter the recommendation output based on defined conditions:
- Filtering Conditions: Select content attributes to apply conditions like "Brand is Gucci" or "Price greater than $200"
- Apply To: Specify which content attributes on the source content page the filter should apply to
Example:
- Filtering Conditions: Brand is Gucci
- Apply To: Price greater than $200 and Category is 'bags'
These rules ensure that recommendations align with your business needs.
Step 5: Save and Create the Strategy Once the strategy is configured, click Create to save it. The strategy will be listed on the strategy table and available for use.
If you want to save your progress and continue later, click Save & Exit, and the strategy will be saved in draft state.

Tips for Strategy Configuration:
- Segment & Boosting Content Attributes: Use content attributes to segment and boost relevant content for recommendations
- Attribute Deduplication: Ensure uniqueness by deduplicating content based on specific attributes
- 1:1 Personalization: Enable this for personalized recommendations based on individual user affinities
Templates
With Templates
Users can:
- Design and Structure Layouts for Recommendation Widgets: Customize how recommendations appear
- Customize Widget Appearance on the Platform: Ensure visual consistency with your brand
Template Management
Template enables you to build layouts which will be used for rendering recommendation widgets on your platform. For example, you can set up a recommendation on your home page with a carousel template that allows customers to scroll through a collection of products.
Navigation Path Navigate to Vue menu bar → Digital Experience Hub → Templates
Template Listing Screen The Template Listing screen provides you with the list of templates created in your account. From the listing screen, you can request creation of a new template, view details about each template configuration, preview, and delete a template.
Search Templates
- You can search for created Templates using the Template name via the search bar or use one of the suggested/recently searched keywords
- The search results will populate in the table
Sort Columns
- Hover over the column header to find the sort icon next to each column
- Click the sort icon to sort the column alphabetically in either ascending or descending order
- If sorting is applied to multiple columns, the column for which sorting was applied last will take precedence
Filter Columns
- Hover over the column header to find the filter icon next to each column
- Click the filter icon to open up a dropdown from which you can multi-select the values to be filtered
- You can also search for a filter value within the dropdown
- The table will be populated with the filtered results
Delete Template
- From the Template listing table, next to each Template name, click on the 'Delete' icon under actions
- Clicking Delete will prompt you with an overlay modal which lists all the entities (strategies and modules) linked to this template
- From here, you can access any entity's config screen and make necessary changes before deleting the template
- Deleting the template will unlink it from all linked features and permanently delete the template and its content from the system
Viewing Template Details
- From the Template listing table, next to each Template name, click on the 'Info' icon under actions
- Template configuration details will open in an overlay modal
- From here, you can also access all the entities linked (Strategy & Module) to this template and navigate to them
Request Creation of a New Template
- Navigate to Digital Experience Manager (DXM) via Vue Menu Bar and click on 'Assets' → 'Template'
- Click on 'Request New'
- Fill out the necessary details in the form. We will get back to you with your template within 7 to 14 business days
- Provide the following details:
- Template type (Carousel, Carousel with Tabs, Grid, Dressing Room, Product Cards for email)
- Number of tiles
- Styling
- Attributes
Modules
With Modules
Users can:
- Combine Strategies and Templates to Deliver Personalized Content: Integrate various elements for a cohesive experience
- Deploy Modules Across Multiple Platforms: Use Embed Code, API, and Email for distribution
Module Management
Module enables you to (i) combine a strategy/combination of strategies/contents with a template, (ii) configure the number of results to be shown, (iii) link strategy(s)/content(s) to specific times on the template.
Navigation Path Navigate to Vue menu bar → Digital Experience Manager → Module
Module Listing Screen The Module Listing screen provides you with the list of modules created in your account. From the listing screen you can request creation of a new module, view details about each module configuration, Preview and Delete a module.
Viewing a Module config
- From the Module listing table, next to each Module name, click on the 'Info' icon under actions
- Module configuration details will open in an overlay modal
- From here, you can also access all the entities linked (Strategy, Template, Experience) to this Module and navigate to them
Search Modules
- You can search for the created Modules using the Module name via search bar or use one of the suggested/recently searched keywords
- You can find the search results populated in the table
Sort Columns
- Hover over the column header to find the sort icon next to each column
- Click the Sort icon to sort the column alphabetically either in ascending or descending order
- If the sort is applied to multiple columns, the column for which sort was applied last will take precedence
Filter Columns
- Hover over the column header to find the filter icon next to each column
- Click the filter icon to open up a dropdown from which you can multi-select the values to be filtered
- You can also search for a filter value within the dropdown
- The table will be populated with the filtered results
Delete Module
- From the Module listing table, next to each module name, click on the 'Delete' icon under actions
- Clicking Delete will prompt the user with an overlay modal which lists all the entities (Experiences) this Module is linked with
- From here, you can access any entity config screen, make necessary changes before deleting the module
- Deleting the module will unlink it from all the linked features and permanently delete it & the content from our system
Request creation of a New Module
- Navigate to Digital Experience Manager (DXM) via Vue Menu Bar and click on 'Assets' > Module
- Click on 'Request New'
- In the form provided please fill out the necessary details. And we will get back to you with your Module within 7 to 14 business days
- Details to be provided:
- Module Type: Embed Code, API, Email
- Template
- Strategy(s)
- Min & Max number of items
Pages
With Pages
Users can:
- Configure Key Website Pages: Set up home pages, product listings, and cart pages for different platforms
- Define Placements on the Website: Control where recommendations are displayed
Page Management
Pages on a website, such as the home page, product listing page, product detail page, and cart page, can be configured for use in different experiences. These pages can be customized based on the user's needs, offering flexibility in content display and interaction.
Prerequisites
- Ensure that you have access to the Digital Experience Manager (DXM) via the Vue menu bar to manage your Pages
Navigation Path Navigate to DXM → Pages
Search Pages You can search for the created Pages using the page name via the search bar or use one of the suggested/recently searched keywords. The search results will be populated in the table.
Sort and Filter Pages
- Sort Columns: Hover over the column header to find the sort icon next to each column. Click the icon to sort the column alphabetically in either ascending or descending order
- Filter Columns: Hover over the column header to find the filter icon. Click it to open a dropdown and select multiple filter values. You can also search for a specific filter value within the dropdown
Delete Pages
- From the Pages listing table, click the Delete icon next to the page name
- Deleting the page will unlink it from all the linked experiences and permanently delete it from the system
View Page Details
- From the Pages listing table, click the 'Info' icon next to the page name
- The page configuration details will open in an overlay modal, where you can also navigate to linked entities and preview the page on supported device types
Request New Page Creation
- Navigate to the DXM via the Vue menu bar and click on 'Assets' → 'Page'
- Click 'Request New' and fill out the form with necessary details. You will receive your page within 7 to 14 business days
Types of Supported Pages
| Page Type | Description |
|---|---|
| All | Used for overlay placement |
| Home Page | Main website page |
| Category Page | Category overview page |
| Brand Page | Brand overview page |
| Product Listing Page (PLP) | Category-based product listing page |
| Product Details Page (PDP) | Description of a specific product in view |
| Cart | Consists of all added-to-cart products |
| Checkout | Proceed to purchase, add address and payment details |
| Order Confirmation | Order confirmed page with order ID and other details |
| Dressing Room | Virtual dressing room page |
| Account | Users' personal page |
| Wishlist | Products added to wishlist page |
| Search & Listing | Lists all Pages created in your account |
| Orders | Users' order history |
| Other Pages - Custom Pages | Customized pages apart from the mentioned types |
Experiences
With Experiences
Users can:
- Define Customer Touchpoints Across the Website: Map out where users interact with your content
- Configure Personalized Recommendations and A/B Test Variations: Experiment with different setups
- Publish and Experiment with Different Modules: Test across multiple placements
- Set Targeting Conditions: Control audience visibility based on behavior
Experience Creation
An experience is a customer touchpoint—the point of contact or interaction that a customer has with your assets throughout the customer journey. These touchpoints can be pages on the website/app, a marketing email, an ad, ratings, purchasing an item or subscribing to a service.
Experience enables you to configure personalized recommendations on any touchpoint and A/B test different variations to find the best suited one for each customer.
Navigation Path Navigate to Vue Home Page → Digital Experience Manager (DXM) → Experience or hover over the DXM on the navigation bar and click on Experience.
Creating an Experience To create an Experience, click on the 'Create Experience' CTA on the Experience Listing Screen. You will be brought to the Experience Configurations where you can select the touchpoint you want to configure an Experience on with options to target and test.
Experience Details:
- Click the 'Create Experience' CTA on the Experience Listing Screen
- Give your Experience a unique name
You can save your Experience config anytime by clicking on "Continue Later" CTA & clicking on "Save & Exit". The Experience is displayed on the listing screen in a draft state. (Partially filled details are not saved).
Select a Page
In this section, you can choose the Touchpoint on which you want to set up an Experience. A touchpoint can be any point of contact or interaction your customer shares with your assets.
- Select the Page Type you want to place the modules on
- Click the 'Pages' dropdown to view and select the Page you want to place the modules on
- By clicking the 'Preview' Icon, you can preview each Page to help select the relevant Page
Once the Experience is published, it is not possible to change the Pagetype & Page.
Experience Settings:
Targeting Conditions Optionally, you can configure Targeting Conditions, which enables you to decide:
- Who? - which visitor(s) should see the experience (Ex: Audience, Traffic source and more)
- Where? - on which specific page/screen should the experience be shown (Ex: Attributes from your Catalog like Brand, Category, etc.)
- When? - render the experience only during specified date & time (Ex: Date, Day or Time)
When no Targeting Conditions are configured, the Experience is shown to All Visitors on your platform, all the time & on all pages/screens.
Targeting Conditions:
| Target Based On | Targeting Condition | Description |
|---|---|---|
| Who | Audience | Target a group of defined users who should see the Experience. You will be able to select from a list of predefined Audiences or any created Audiences. Ex: New Visitors |
| Device Type | Target an Experience to users based on the Device or Platform they are using. Ex: Mobile User | |
| User(s) | Target a list of custom users which you can add directly via Visitor ID or or MAD ID | |
| Traffic source | Target an Experience based on where users have landed on your platform from. Ex: From a Search Engine | |
| Country | Target an Experience to users from a specific Country. Ex: Australia | |
| Where | Attributes | Target an Experience based on any Attribute marked as 'Facet' during Catalog Onboarding. Ex: Brand |
| When | Date | Target an Experience to be displayed within a particular Date Range. Ex: A sale period |
| Day | Target an Experience to be displayed on particular Day(s). Ex: Weekends | |
| Time of Day | Target an Experience to be displayed between a particular Time of Day. Ex: 8 AM to 8 PM |
Set Experience Priority
When there are multiple Experiences configured & published simultaneously on the same page, Priority helps Vue determine which Experience should take precedence. This typically is required when multiple experiences of the same page have the targeting conditions which lead to one visitor being part of the target for more than one experience.
- To set priority, reorder the Live Experience based on your preferences within the 'Set Experience Priority' accordion
The Experience at the top of the list has the highest priority, with the order of priority decreasing from top to bottom. Any newly created Experience or Experience being created is by default placed at the top of the Priority List.
Only the Experiences with status that are not draft & archive are shown in the Priority List.
Link Module to Placement
Add modules to any placement on the page. Using the 'Link Module' CTA you can select which modules you want to link to the experience, where it should be displayed on the selected page and how it should behave.
- Select the Platform you want to link your modules to
- If you have already linked modules to a platform you can also easily import modules already set up on one platform to another Platform using the 'Import From' CTA & select a platform to import from
- Click 'Link Module' CTA on the placement where you wish to link your module(s)
- Select module(s) from the module listing and click 'Done'. The selected module is now linked & listed within the placement
- Click on 'x' icon to unlink a module from the placement
- Click on the 'Preview' icon to preview the selected module, placement & the page
- Note: You can also click on 'Manage Module' icon to link more Module(s) or unlink already linked Module(s)
A precondition for this is that the pages need to be setup with predefined placements where modules can be placed. This can be done from the Page setup section. If there is no module linked to any placement, there will be nothing rendered on those placements.
Placement Behavior In this section, you can define how you would like the module(s) to behave on your site.
- Settings - by clicking the 'Settings' icon on each placement, you can configure:
- Trigger - to define when the module(s) within the placement first appear on the page Eg: On page load, on exit intent and more
- Frequency - to define how often the module(s) within the placement should render on your site Eg: Once per page view, Once per user and more
- Button Behavior - to define how the module should appear on the page on click of the recommendation button Eg: Inline and overlay
- Button Style - you can to select the style of the button from the Vue Button Styles library or select any custom buttons shared
- Enable/Disable - by checking or unchecking the 'Enable' checkbox, you can control whether or not the linked entities within a Placement are displayed on the front end of your platform
- Import From - If you have already linked modules to a platform you can also easily import modules already set up on one platform to another Platform
Placement Behaviors:
| Behavior | Options | Description |
|---|---|---|
| Trigger | On Page load | To display as soon as page loads |
| Frequency | Once per page view | To render on each page view |
| Button Behavior (only for Button Placements) | Inline | To open the module in an inline |
| Button Style (only for Button Placements) | Button Style Library | Select the style of the button from the Vue Button Styles library or any custom buttons shared |
Business Rules If you would like to add Business Rules, you can click the 'Business Rules' icon in the Actions column of any linked module. A business rule acts as a filter to narrow down results based on a business goal or condition.
- To add new/manage existing business rule, click the 'Business Rules' icon in the Actions column of any linked module
- You can name the rule
- If you have more than one catalog, select the catalog to apply the business rule
- You can choose any attributes to apply as a filter
Attributes provided for business rules are the fields that are "Indexed" during catalog configuration.
Attributes can be any metadata. For example, Brand, Category, Price etc
- You can click on 'And' to add another condition to a rule
- For a contextual rule, you can apply a filter with the value option 'Same as Source'. For example, if you have set up a business rule as Brand is 'Same as Source', recommendations will be filtered based on the brand of each Source Content
- Optionally, you can choose how the Business Rule is applied with 'Apply to'. Select the condition for when you want the Business Rule to filter results:
- 'All' - All the conditions should satisfy for this Business Rule to Apply
- 'Any' - Business Rule can apply as long as any one of the conditions are satisfied
Experiments Experiments enable you to allocate user traffic, test performance based on a business goal or metric & measure the results to determine each touchpoint's winning Experience. There are two types of experiments:
- Within placement: This is used to test between multiple modules within a single placement. Typically used when the layout of the website / app is fixed and the question is around which module will work best
- Between placements: This is used to test modules placed across different placements. Typically used when the question is around where on the page would be the best to place the module
Within a Placement You can configure a multivariate Experiment between two or modules + control to measure and determine the best performing module.
- Click 'Link Module/Manage Module' on the placement to link module(s) and perform the Experiment
- Select one or more Modules from the Module listing. Note: When multiple modules are selected 'Control' is automatically linked to the placement. Alternatively you can also link one module + control to configure an A/B test
- Click 'Done'. The selected module(s) + control are now linked & listed within the placement
- Click on the 'Settings' icon on the placement header to configure the Experiment name, goal, metric & confidence score
Between Placements After you have linked modules to more than one placement on the page, you can run an Experiment between the Placement(s) + Control to determine the best performing combination of module and placement.
Live Preview
To view the modules on your platform, you can use the Live Preview feature. It enables you to view all your linked modules on the selected page of your site, directly from the Experiences section of the tool.
- To preview the selected page, click on the 'Live Preview' CTA
- You will see your live preview with the option to toggle between desktop and mobile platforms
- You can also choose to view configured placements on the page by enabling the toggle 'Display Placements'
- View all your linked modules on the page
- If more than one module is linked to a placement, you will be able to select the module you wish to preview by clicking on the dropdown above the placement
Publish Experiences Once you have set up the desired recommendation modules and/or A/B test, you can publish the experience:
- Click the 'Publish' CTA at the top of the right corner of the screen. Once you publish an Experience, it will be labelled as 'Live' on the Experience Listing Page
- After publishing an Experience, it should be available to view on the relevant touchpoint on your platform!
Visitors will be able to see the experience on your platform if they meet the configured experience priority and targeting conditions.
You can 'Unpublish' any live Experience from the Experience listing page by clicking the 'Unpublish' icon found under the actions column on the Experience Listing page
Glossary:
| Term | Definition |
|---|---|
| Experience | An Experience is any touchpoint on your website where you have added one or more recommendations and/or set up an Experiment |
| Module | A Module is a combination of one or more recommendation Strategies with an optional Template |
| Placement | A Placement a configured position/location on your platform page/screen where you would like the linked Module(s) to render |
| Business Rule | A Business Rule is filter that can be applied on recommendations based on a business goal or use case |
| Experiment | An Experiment is a test run based on a business goal and metric to measure and determine a winning Experience. A test can be run between modules, placements and/or a control group. |
| Control | Visitors who are shown this variation (Control) do not see any modules. They see your default platform. |
| Left Navigation Bar | The Left Navigation Bar enables you to view and navigate between the 2 steps of Experience Settings, Page and Target Conditions and Placement Settings |
| Continue Later CTA | The Continue Later CTA allows you to save or discard changes made to the Experiment Settings and to return to the Experience Listing Page. |
Metrics
With Metrics
Users can:
- Access Detailed Data on Business Impact: Measure feature performance and experimentation results
- Visualize Data in Multiple Formats: Use flexible filtering options to analyze trends
- Analyze Trends and Measure Effectiveness: Evaluate the success of different experiences over time
Metrics Overview
Metrics provide you with exhaustive data ranging from business impact to performance to experiment data across all the features configured by you in DXM. You will be able to visualize data in different formats, and slice & view data using various filters for any date range.
Navigation Path
- Choose Metrics from the top navigation bar
- Alternatively, click on the app drawer → 'Digital Experience Manager' → 'Metrics'
You can view and navigate through the following metrics:
- Vue Impact Metrics
- Performance Metrics
- Experiment Metrics
Vue Impact Metrics
To understand the impact of Vue on your business, we provide a host of impact metrics. These metrics help you gain valuable insights into the incremental revenue and improved user engagement that Vue is driving for your website.
- Within the Metrics screen, click on 'Vue Impact' on the left navigation panel
- By default, the metrics shown are for the last 7 days
- To change the time period, click on the date selector and choose the desired date range
- To query & filter metrics by different parameters, click on the 'Advanced Filter' CTA
- The following key metrics are displayed by default:
- Assisted Revenue (visit)
- Direct Revenue (7 days)
- Click-Through Rate
- Direct Cart Additions (7 days)
- Direct Product Purchases (7 days)
- User Engagement Rate
You can use the 'Manage' icon to access the list of all available metrics and add/remove metrics to display.
Performance Metrics
Performance metrics enable you to view the performance of your customer experience at different levels of granularity: experiences, modules, and strategies.
- Choose Metrics from the top navigation bar
- Select 'Performance' on the left navigation panel
- Click on the drop-down and select the time period to be used for calculating the metrics. The default time period is the last 7 days
- Switch between the following sub-tabs for detailed information:
| Filter | Description |
|---|---|
| Page | Performance data aggregated at the Page level |
| Experience | Performance data for different experiences published by you |
| Module | Performance data for different modules configured |
| Strategy | Performance data for different strategies configured |
| Facet | Performance data for different strategies configured |
Experiment Metrics
Experiment metrics enable you to view the data of all the experiments configured in one place. You can also control your experiments from here.
- Choose Metrics from the top navigation bar
- Select 'Experiment' on the left navigation panel
- Click on the drop-down and select the time period to be used for calculating the metrics. The default time period is the last 7 days
- In the All Experiments table:
- Click on the 'Pause/Play' icon to update the state of the experiment
- Click on the 'info' icon to view details about each experiment
Experiment Details
- View the details about a variation with the experiment, the status of each variation, Experiment Metric, Uplift & Confidence Score
- Click on the 'Pause/Play' icon to update the state of the experiment
- Click on the 'Export' CTA to download the metrics screen as a CSV or PDF
- Click on the 'Gear' CTA, select the Metrics you want to access, and click on 'Done'
- Click on the 'Advanced Filters' CTA, configure the query to filter & click on 'Done'
- Filtered data will be displayed
Glossary
| Field | Description |
|---|---|
| Export Metrics | Click on the 'Export' CTA to download the metrics displayed as a CSV or PDF |
| Manage Metrics | Click on the 'Gear' CTA, select the Metrics you want to access, and click on 'Done' |
| Advanced Filters | Click on the 'Advanced Filters' CTA, configure the query to filter & click on 'Done'. Filtered data will be displayed |
| Search | Search for any Metrics using any feature name |
| Filters | Hover over any column header where you'd like to apply filters |
| Sort | Hover over any column header where you'd like to apply sorting |
Metrics Description
| Field | Description |
|---|---|
| Unique Visitors | The total number of unique visitors to your website over a selected time period |
| Product Views | The total number of times products were viewed over a selected time period |
| Product Purchased | The total number of products purchased over a selected time period |
| Total Revenue | The total revenue from sales over a period of time |
| Incremental Revenue through Vue | Revenue resulting from the uplift in conversion rate and average order value in journeys powered by Vue |
| Assisted Revenue (visit) | Revenue from the sale of any product in a visit with at least 1 click on Vue modules |
| Direct Revenue (visit) | Revenue from the sale of products clicked and purchased in the same session, recommended by Vue |
| Direct Cart additions (visit) | The total number of products clicked and added to the cart in the same session, recommended by Vue |
| Direct Products Purchases (visit) | The total number of products clicked and purchased in the same session, recommended by Vue |
| Direct Revenue (7 days) | Revenue from the sale of products clicked and purchased within 7 days, recommended by Vue |
| Click-Through Rate (CTR) | The number of clicks on Vue recommendations divided by the number of times the module is viewed |
| Average Order Value (AOV) | Average amount spent each time a customer places an order on your website |
| Average Order Size | Average number of items sold in a single purchase |
| User Engagement Rate | Percentage of unique visitors that click at least once on your recommendation |
| Cart Abandonment Rate | Percentage of customers who add items to their shopping cart but abandon the cart and end the session before completing the purchase |
| Average Revenue per User (ARPU) | Average revenue each user brings, calculated by dividing total revenue by unique users |
| Revenue per Visit (RPV) | Total revenue generated in each visit, calculated by dividing total revenue by the total number of visits |
| Conversion Rate | Percentage of orders placed divided by the total number of unique visits |
| Product Views per Visit | Average number of product pages viewed per visit, calculated as a ratio of product views to unique visits |
| Opens | Number of Vue recommendation emails opened by customers |
| Click to Open Rate (CTOR) | Ratio of clicks to opens for Vue recommendation emails |
Accounts
Welcome to Vue's Account Settings! This guide will help you understand the basics of managing your account settings and configurations.
Account Settings provides a centralized location to manage your:
- User Profile: Update your personal information and preferences
- Team Management: Add and manage team members and their roles
Quick Start Guide
Accessing Account Settings
To access your account settings:
- Log in to your Vue account
- Click on your profile icon in the top-right corner
- Select "Account Settings" from the dropdown menu
Managing Your Profile
In the Profile section, you can:
- Update your name and contact information
- Change your password
- Set your notification preferences
- Configure your timezone and language settings
Organization Settings
The Organization section allows you to:
- Update organization details
- Manage billing information
- Configure organization-wide preferences
- Set up custom branding
Team Management
Under Team Management, you can:
- Invite new team members
- Assign roles and permissions
- Manage access levels
- Review team activity
Account Settings Overview
Managing and reviewing large quantities of data can be challenging for individuals or small teams. Our user management features are designed to help you efficiently manage your teams and distribute the workload.
Navigation
To access your account settings from any screen, click on the User Profile icon located at the top right corner of your screen. Then, click on 'Account Settings' to view your account details and permissions.
User Profile
In the User Profile tab, you can view your basic account information. For any edits to be made including changing your account password you need to contact admin of the account.
Roles and Permissions
Admin Users
Admin users can access the User Roles tab to create roles, assign permissions, and manage account access across their team:
- Click on 'Manage User Roles' from the side navigation of your Account Settings.
- Here, you will see existing roles or have the option to create new ones.
- To create a new role, click the '+ New Role' button. Provide a Name and/or Description for your new role, then assign access permissions per entity as required. Click "Save" when you're ready to return to the listing.
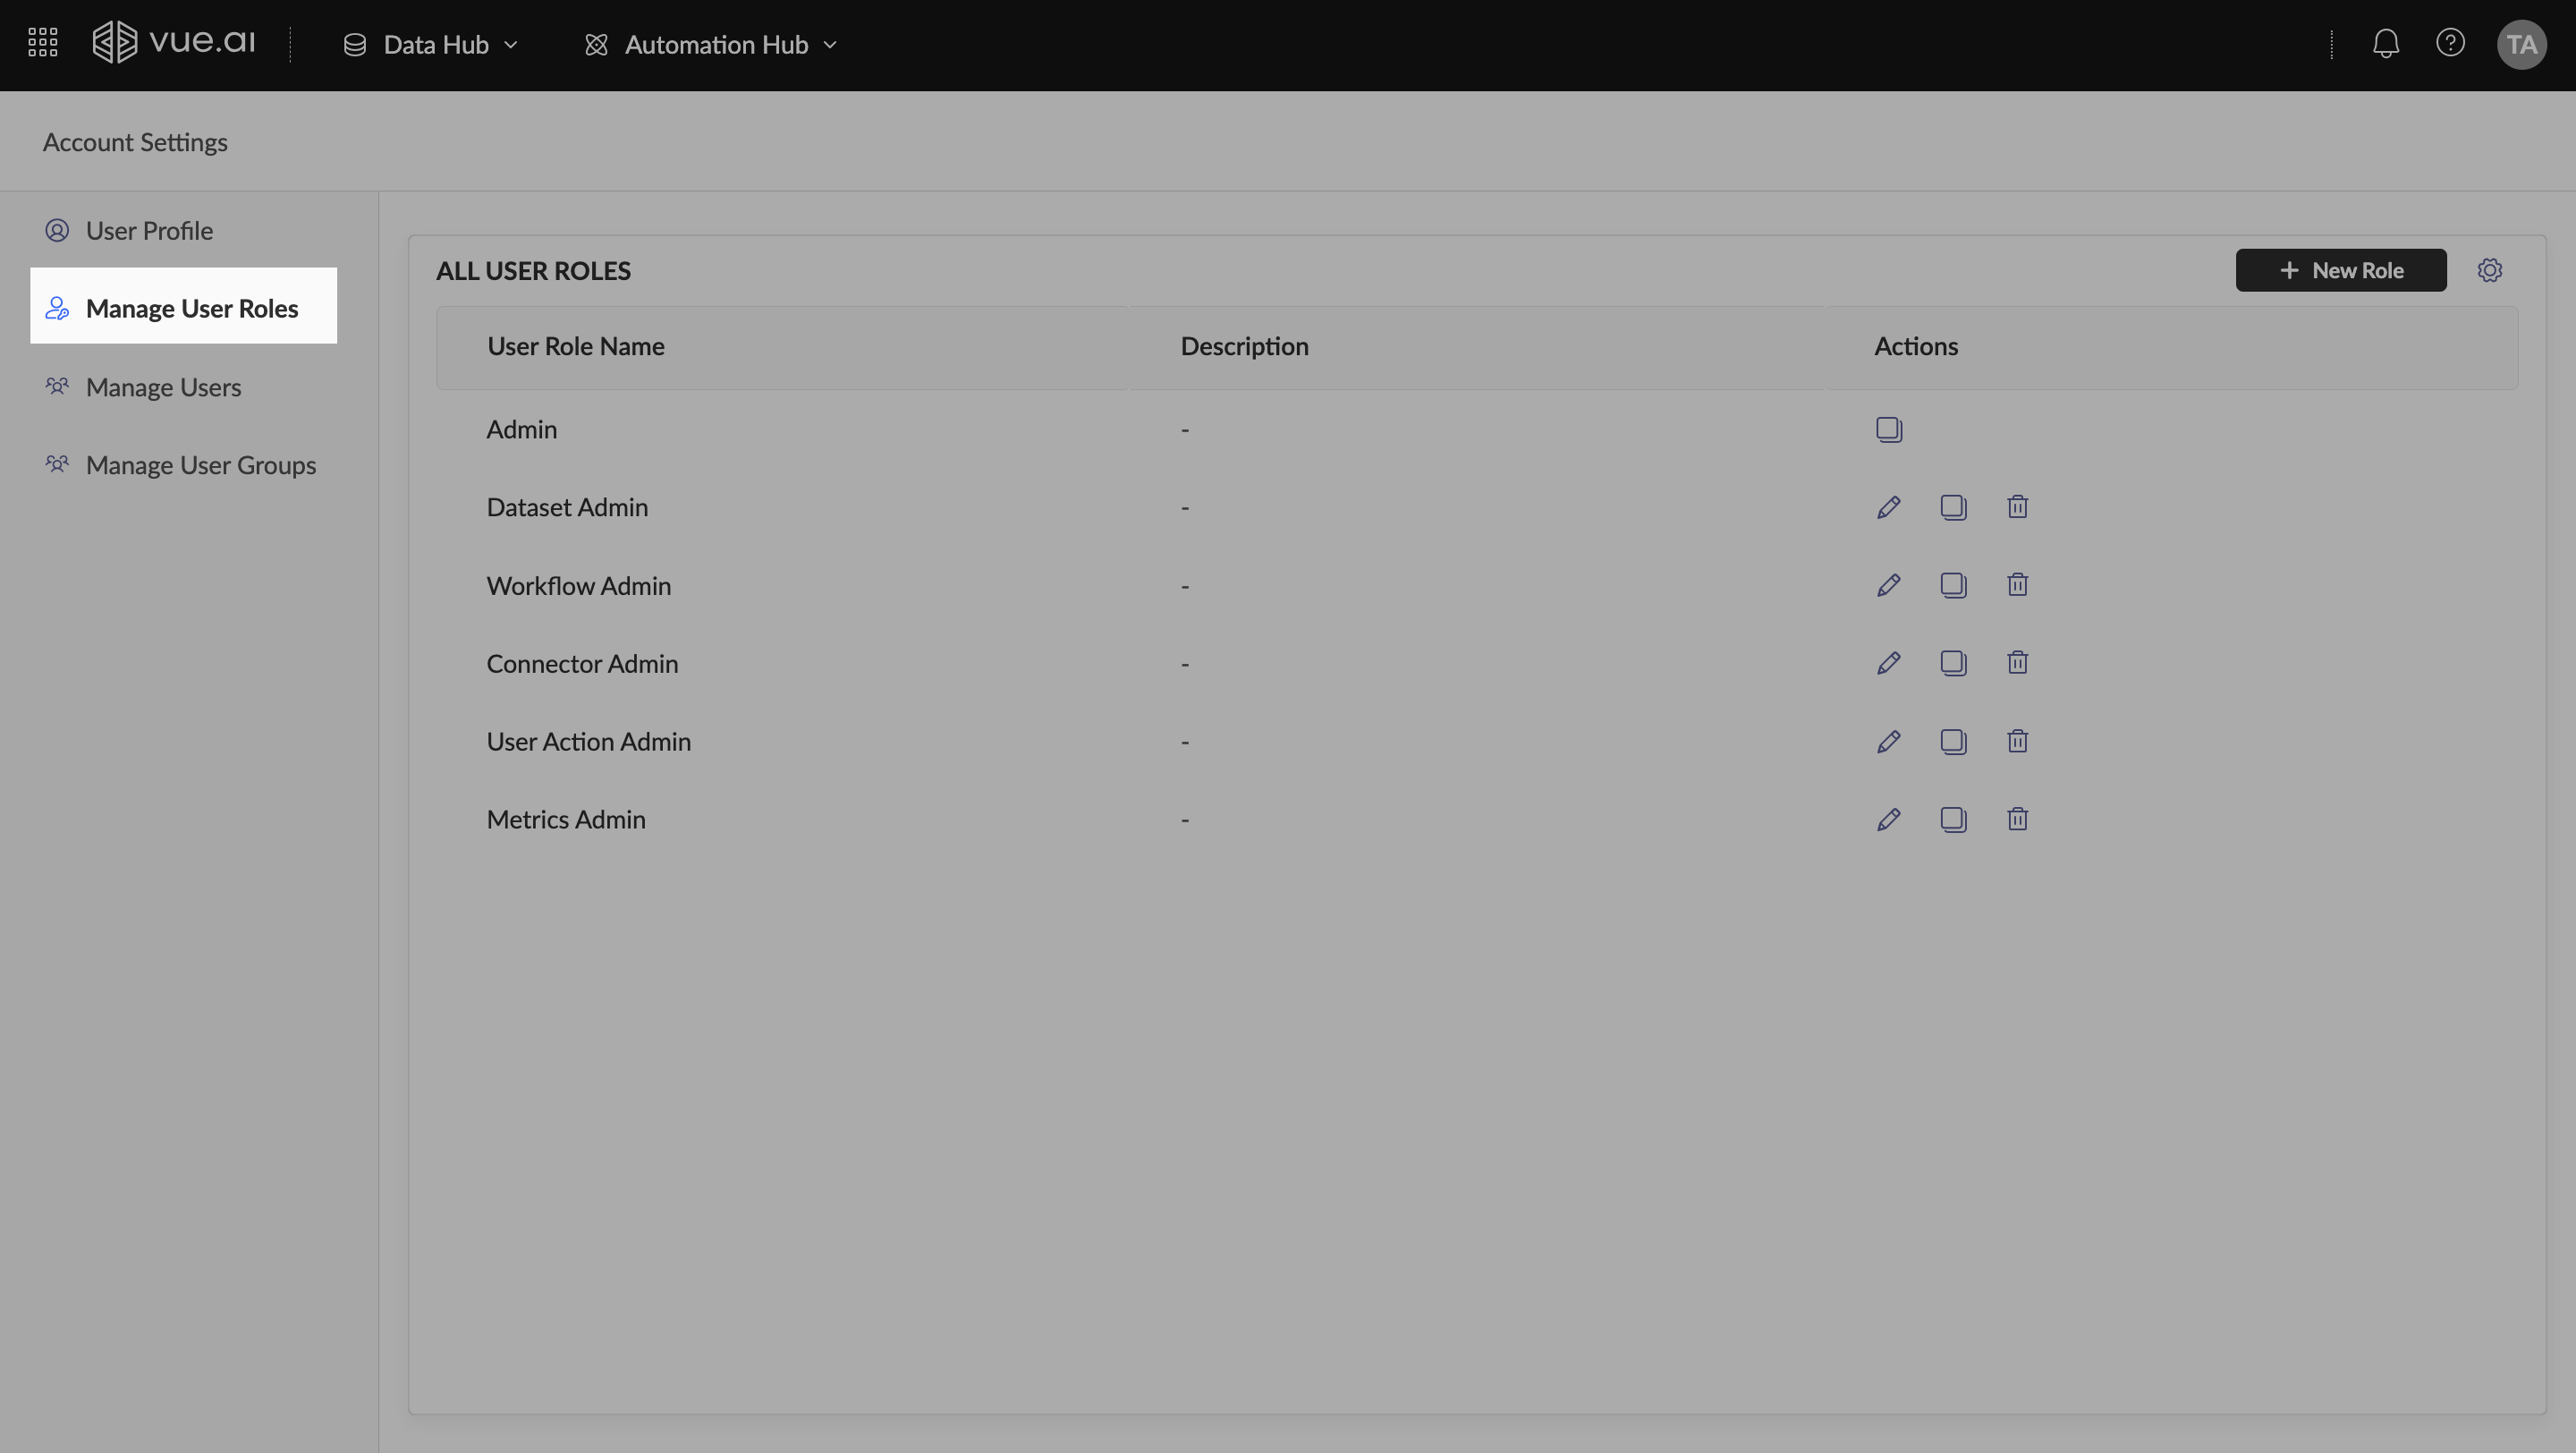
- To edit, duplicate, or delete existing roles, use the icons provided under the Actions column listed with each created role on the listing.
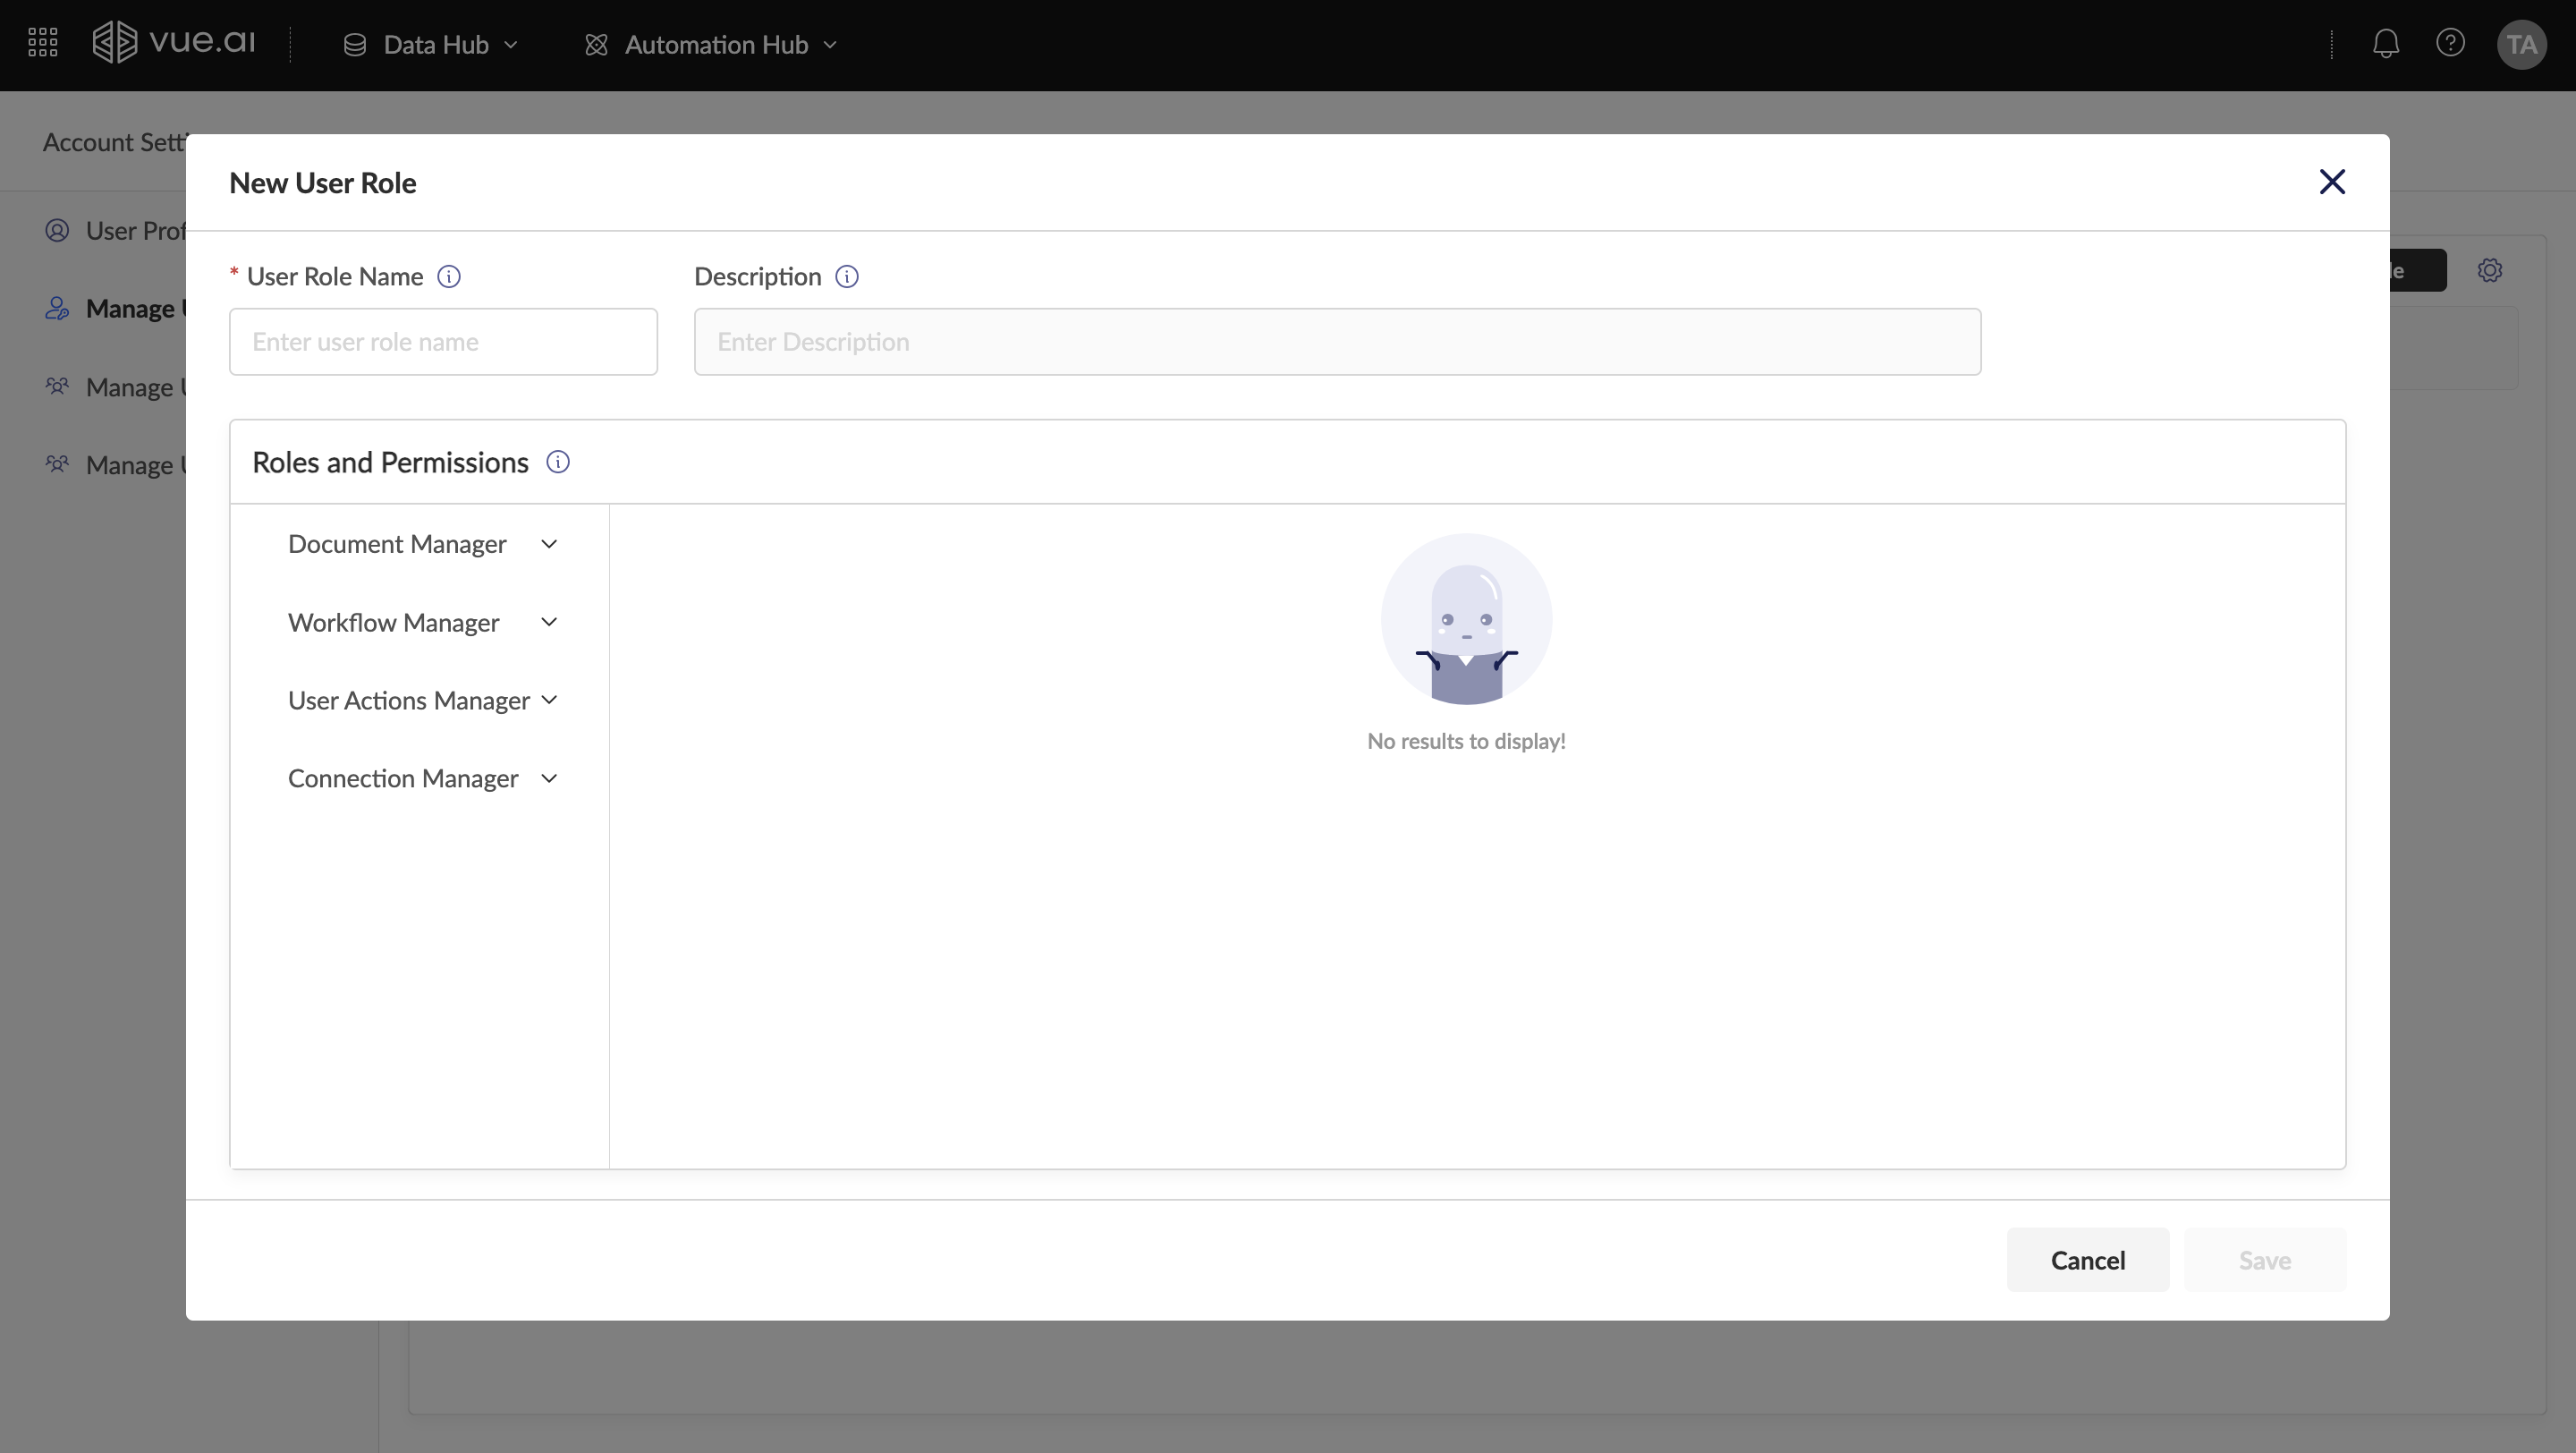
Users & User Groups
Admin users can manage Users and User Groups from the respective tabs within their Account Settings:
- To navigate, click on the 'Manage Users' or 'Manage User Groups' tab using the side navigation of your Account Settings.
To create a new User, click the '+ New User' button on the Manage Users tab. Enter relevant information such as Name & Credentials, assign access roles & permissions, and click "Create" when you're ready.
To create a new User Group, click the '+ New User Group' button on the Manage User Groups tab. Enter a Group Name, select the Users to include in this group, assign access roles and permissions, and click "Create" when you're ready.
You will be able to manage and edit User configurations from the Manage Users listing.
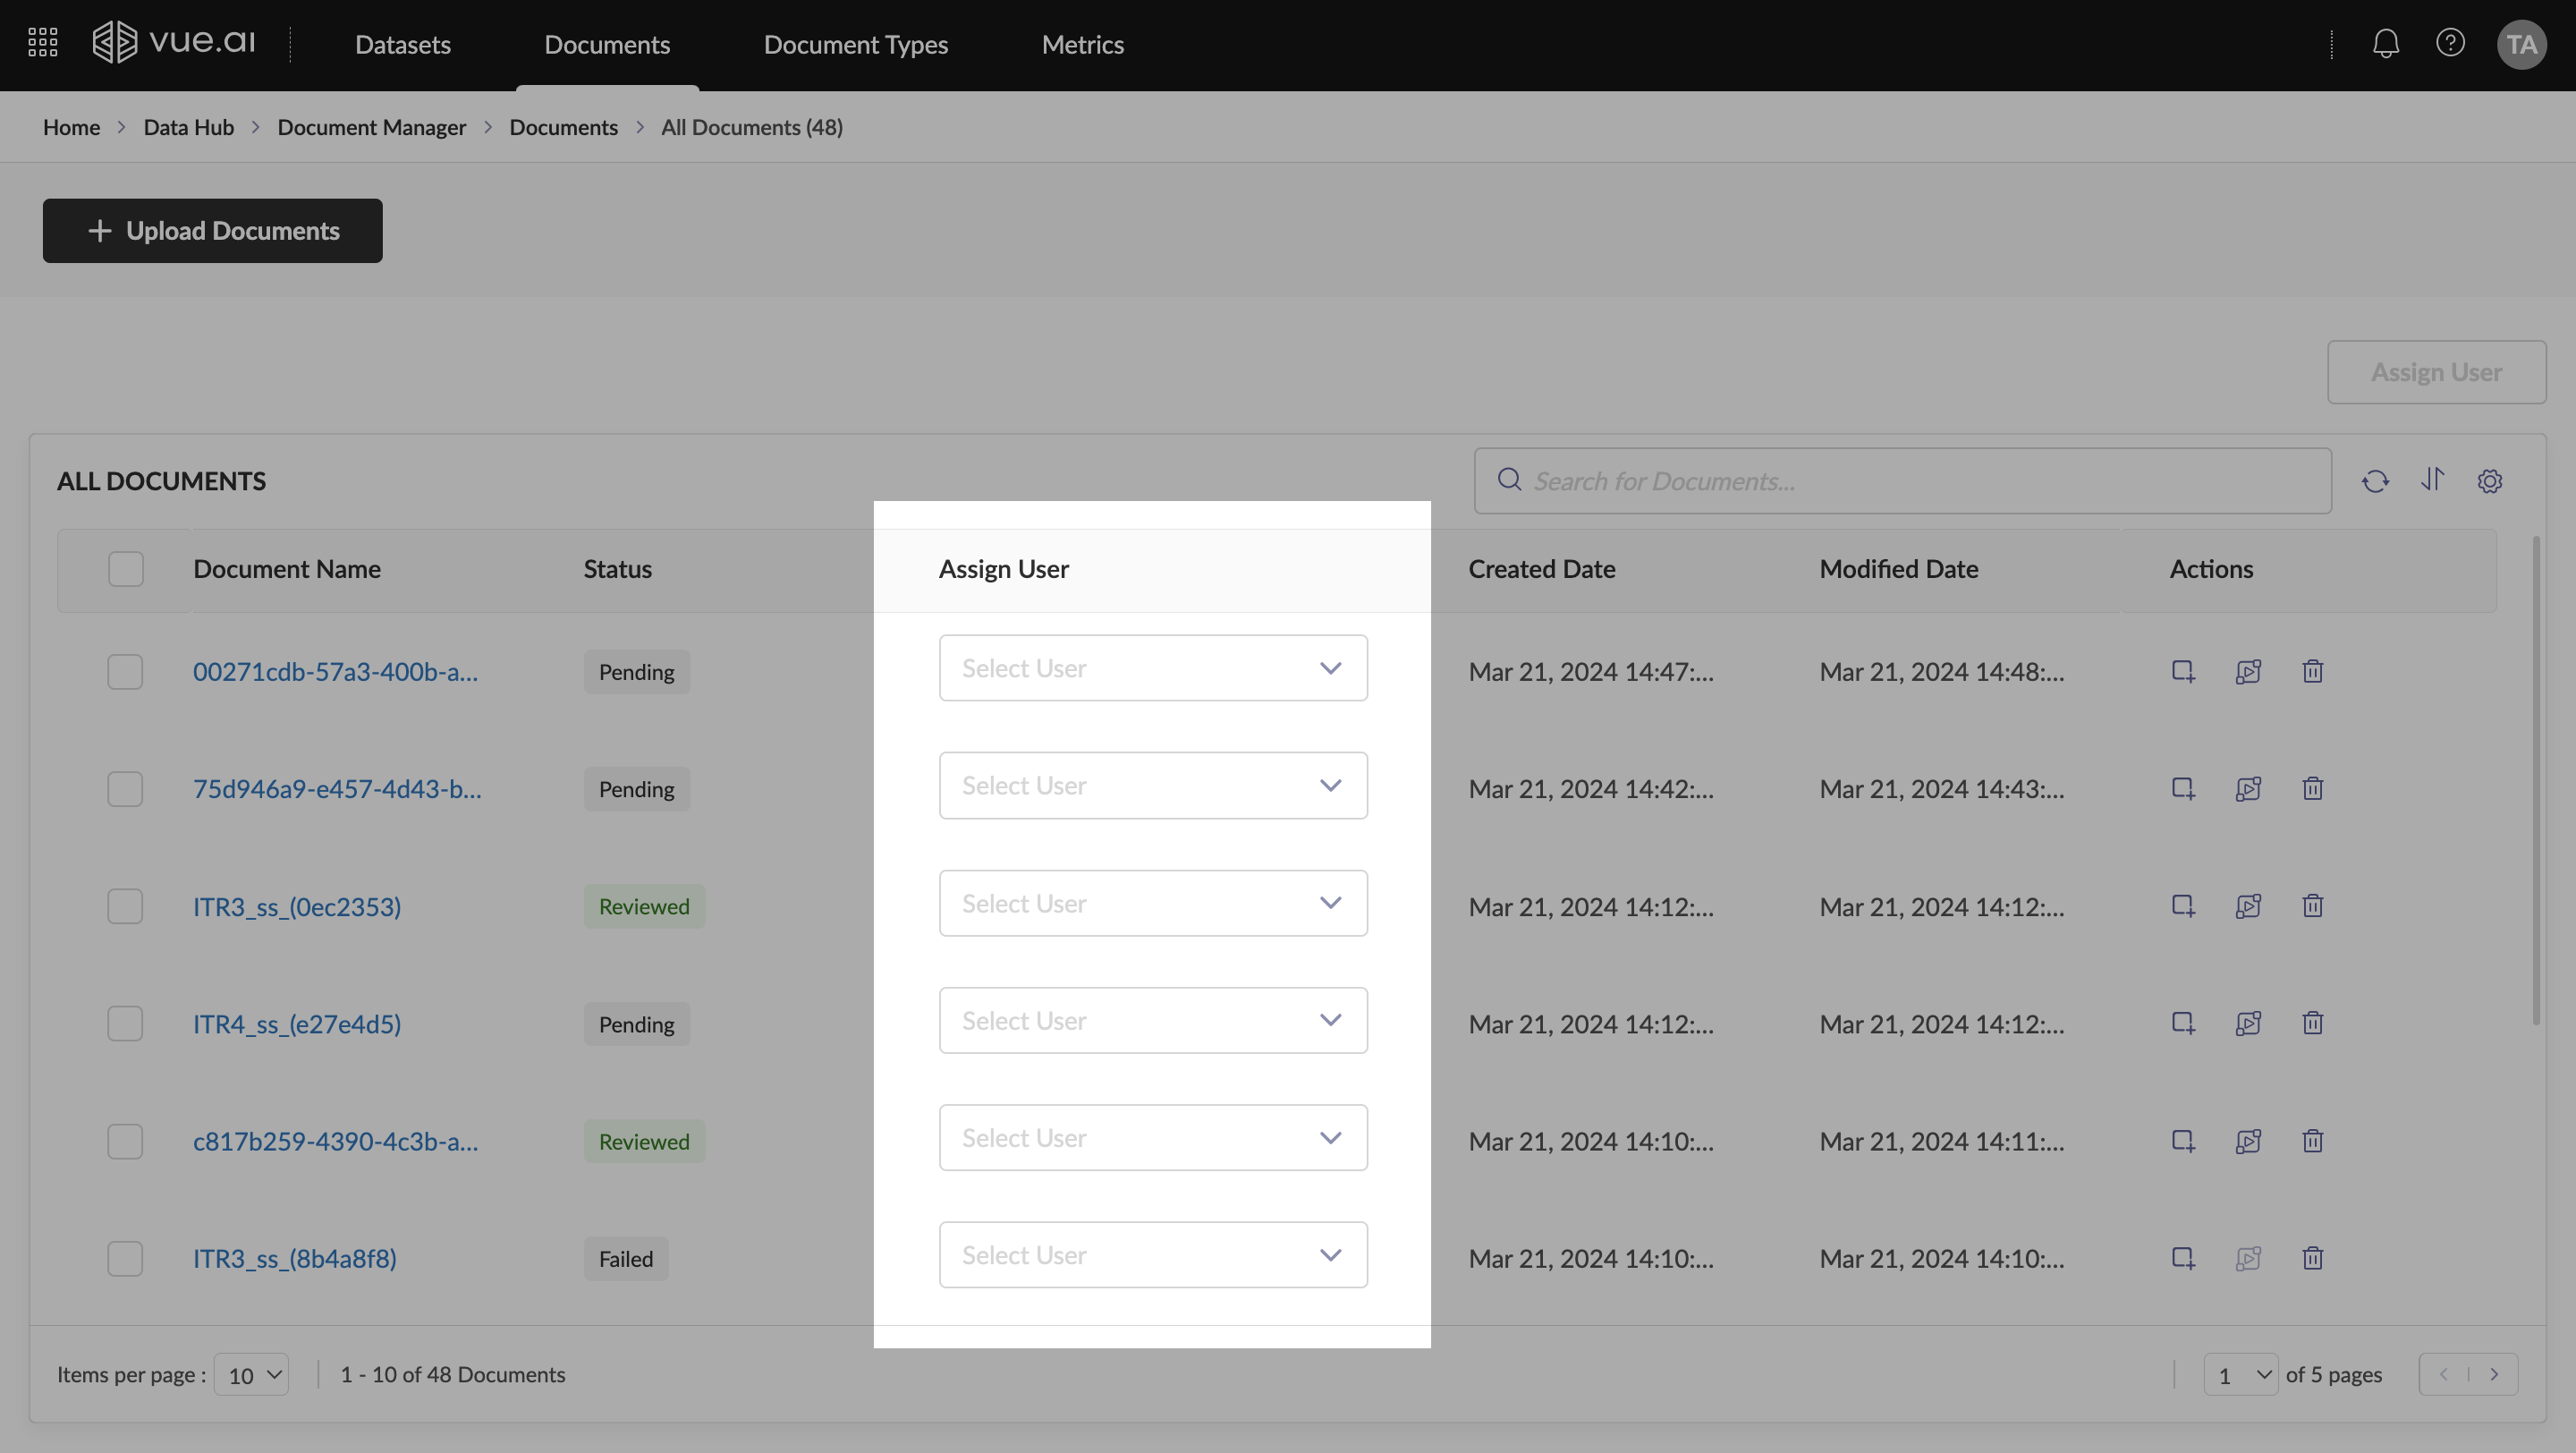
Assignment
Admin users can assign entities to other users and/or user groups as follows:
- Navigate to the Entity Listing, where you will see an 'Assign User' column.
- To assign users at a row level, use the dropdown to select User(s) and/or User Groups.
- To bulk assign entities, multi-select the required entities and use the 'Assign Users' button above the listing to select User(s) and/or User Groups.
- Non-admin users will only be able to view the entities assigned to them on the relevant listings.
Managing API Keys
Welcome to the Creating and Managing API Keys guide. This guide will assist users in understanding the purpose and use of API Keys and learning the process of creating and managing API Keys.
Who is this guide for? This guide is designed for users who need to integrate their applications or services with the platform's APIs.
Ensure that the necessary permissions for generating API Keys are granted before starting.
Overview
This guide covers the following topics:
- Navigating to the API Keys section.
- Creating an API Key.
- Managing an API Key.
- Best practices for securing API Keys.
Prerequisites Before starting, ensure the following requirements are met:
- Necessary permissions to generate API Keys are granted.
- Understanding of the role-based access control system in the platform.
- A secure location to store the API Key is available, as it will not be retrievable later.
Step-by-Step Instructions
Navigating to API Keys Section
Follow these steps to navigate to the API Keys section:
- Click on the Profile Icon
- Go to Account Settings
- Click on API Keys
Creating an API Key
To create an API Key:
- Click on +New Key
- Provide a unique name and description for the key
- Select the role(s) for which the API Key needs to be created
- Click on Create
- The API Key will be generated immediately.
- It should be copied and saved in a secure location, as it will not be available later.
Managing an API Key
To manage an API Key:
- Identify the Key to be managed from the API Key listing table
- Click on the Edit (pencil) icon
- Update the User Roles as required
- Click on Save
Troubleshooting
Common Issues and Solutions
Problem 1: Unable to find the API Key after creation Cause: API Keys are only visible once during creation. Solution:
- Generate a new key if the previous one is lost.
Problem 2: Access is denied when using the API Key Cause: The assigned user role does not have the necessary permissions. Solution:
- Ensure that the assigned user role has the necessary permissions.
Additional Information
- Revoking an API Key will disable access immediately.
- For enhanced security, consider rotating API Keys periodically.
- API Keys should be stored securely and not shared publicly.
FAQ
What are API Keys?
API Keys provide a way to authenticate and access platform features programmatically via APIs.
Can an API Key be retrieved after creation?
No, API Keys are displayed only once. If lost, a new one needs to be generated.
What happens if an API Key is deleted?
The API Key will be permanently revoked, and any services using it will lose access.
Summary
- This guide provided instructions on navigating to the API Key section, creating and managing API Keys, and best practices for secure storage.
- It is imperative to handle API Keys securely to prevent unauthorized access.
Managing Secrets
Welcome to the Creating and Managing Secrets Guide! This guide will assist in understanding the functionality and benefits of the Secrets Manager and learning how to create, manage, and use secrets effectively.
Who is this guide designed for? This guide is intended for users who need to manage sensitive data within the system.
Ensure access to the Secrets Manager section in Account Settings is available before starting.
Overview
The Secrets Manager allows users to:
- Store credentials and other sensitive information in a centralized location.
- Use stored secrets in various parts of the system, such as Custom Code Nodes.
- Manage secrets by adding, updating, or deleting key-value pairs.
Prerequisites Before beginning, ensure that:
- Access to the Secrets Manager section in Account Settings is available.
- The necessary permissions to create and manage secrets are granted.
- Familiarity with Custom Code Nodes is present, although it's not mandatory.
Step-by-Step Instructions
Navigation
To navigate to the Secrets Manager section:
- Click on the Profile Icon.
- Select Account Settings.
- Choose Secrets Manager.
Creating a Secret
To create a new secret:
- Click on +New Key.
- Provide a unique Secret name.
- Click on Add Item to add a Key-Value Pair.
- Under Keyname, input the access name.
- Under Keyvalue, input the access secret.
- Repeat steps 3 to 5 to add more Key-Value Pairs to the Secret, if necessary.
- Click on Create to finish creating the Secret.
Managing a Secret
To manage a secret:
- From the Secrets listing table, locate the Secret to be managed.
- Click on the Edit (pencil) icon.
- Update the Key-Value Pair as required.
- Click on Save to apply changes.
Using a Secret
To use a secret in a Custom Code Node:
- Create a Custom Code Node.
- While building a Custom Code Node, use the following snippet of code:
from meta.global_constants import get_secrets_data
secret_json = get_secrets_data(f'{client_id}-{your-secret-name}')
Replace <your-secret-name> with the actual name of the Secret to be accessed.
Now, any user in the organization (with relevant permissions) can use Secrets securely and efficiently.
Troubleshooting
Common Issues and Solutions
Problem 1: Unable to Access Secrets Manager Cause: Lack of necessary permissions. Solution:
- Verify that the necessary permissions are granted.
- Contact the administrator if access is restricted.
Problem 2: Secret Not Found Cause: Incorrect Secret name while retrieving it in the Custom Code Node. Solution:
- Double-check the Secret name.
Problem 3: Incorrect Key-Value Pair Cause: Incorrect credentials stored and retrieved. Solution:
- Verify that the correct credentials have been stored and retrieved.
Problem 4: Changes Not Saved Cause: Page not refreshed. Solution:
- Refresh the page and confirm if the updated Key-Value Pair is reflected.
Additional Information
- Secrets are encrypted and stored securely.
- Only users with the necessary permissions can create, modify, or access secrets.
- Secrets can be used in different workflows, including automation and API authentication.
FAQ
Can multiple Key-Value Pairs be stored in a single Secret?
Yes, multiple Key-Value Pairs can be stored in one Secret.
Who can access stored Secrets?
Only users with the appropriate permissions can access stored Secrets.
Can a Secret be deleted?
Currently, this guide does not cover deleting Secrets. Refer to the Secrets Manager documentation for details.
Summary
- The Secrets Manager enables secure storage, management, and retrieval of sensitive data.
- This guide covered:
- Navigation to Secrets Manager
- Steps to create and manage a Secret
- Usage of Secrets in a Custom Code Node
- Troubleshooting common issues
By following these steps, sensitive information within the system can be securely managed.
Login to Vue!
Welcome to Vue! You're on the verge of exploring something amazing. The first step, however, is to log in.
Login Methods
Logging into the Vue App can be done through:
- Email Credentials
- SSO (Supported providers: Google and Okta)
Let's delve into each method for a clear understanding of how to access your Vue AI suite.
Email-based Access
Login
If you already have Vue login credentials:
- Navigate to the Login screen.
- Enter your registered email address and password.
- Click 'Sign In' to access your Vue AI suite.
Forgot Password
If you've forgotten your password:
- Click the 'Forgot Password' button on the Login screen.
- Enter your registered email address and click 'Send Reset Password Link'.
- Check your email for a link to reset your password.
Request Access
If you're new to Vue and don't have credentials:
- Click the 'Contact Us' button to request a demo and access credentials to the Vue AI suite.
SSO-based Access
Activate Account
To activate your SSO login:
- Have your company admin add your name and email through the '+ New User' form within Account Settings.
- Look for a Welcome email in your inbox with an authentication link.
- Click the link to activate your account for a seamless sign-in experience.
Sign in
For signing in with activated SSO credentials:
- Click on your SSO provider's logo.
- Enter your credentials.
- You're now logged into Vue!
This guide aims to make your login process as smooth as possible, ensuring you get to your AI suite with ease.
Microsoft Entra ID Configuration
Azure
Navigate to Microsoft Registered App section. Under Microsoft Entra ID, open App Registration.
Select new registration.
The Created Application will contain client id, client secret which will be used in following steps.
Under optional claims, add the necessary fields like email. (for a field to work, azure users should have the respective details present in their account)
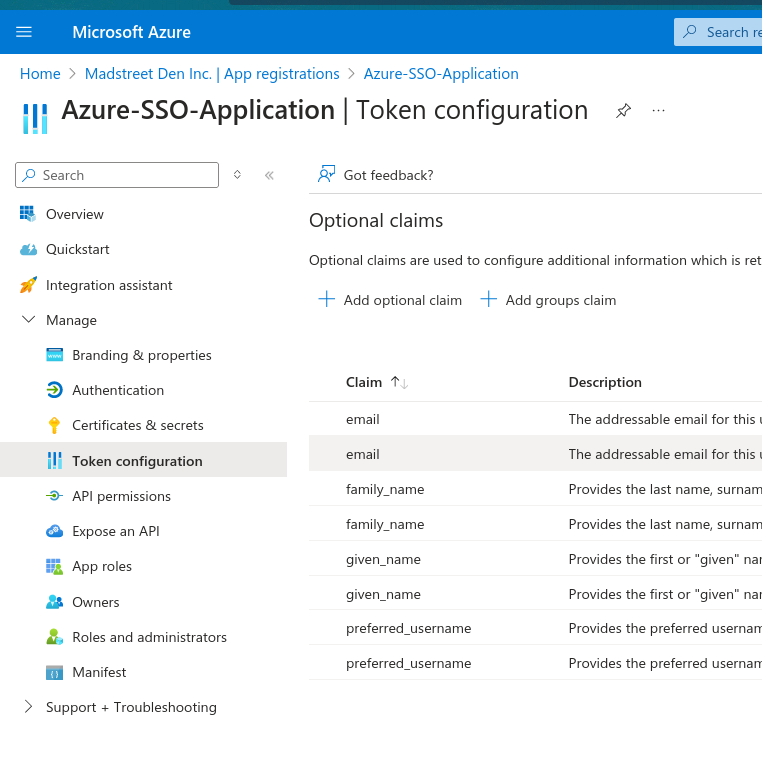
Go to Authentication and fill in the redirect URL.
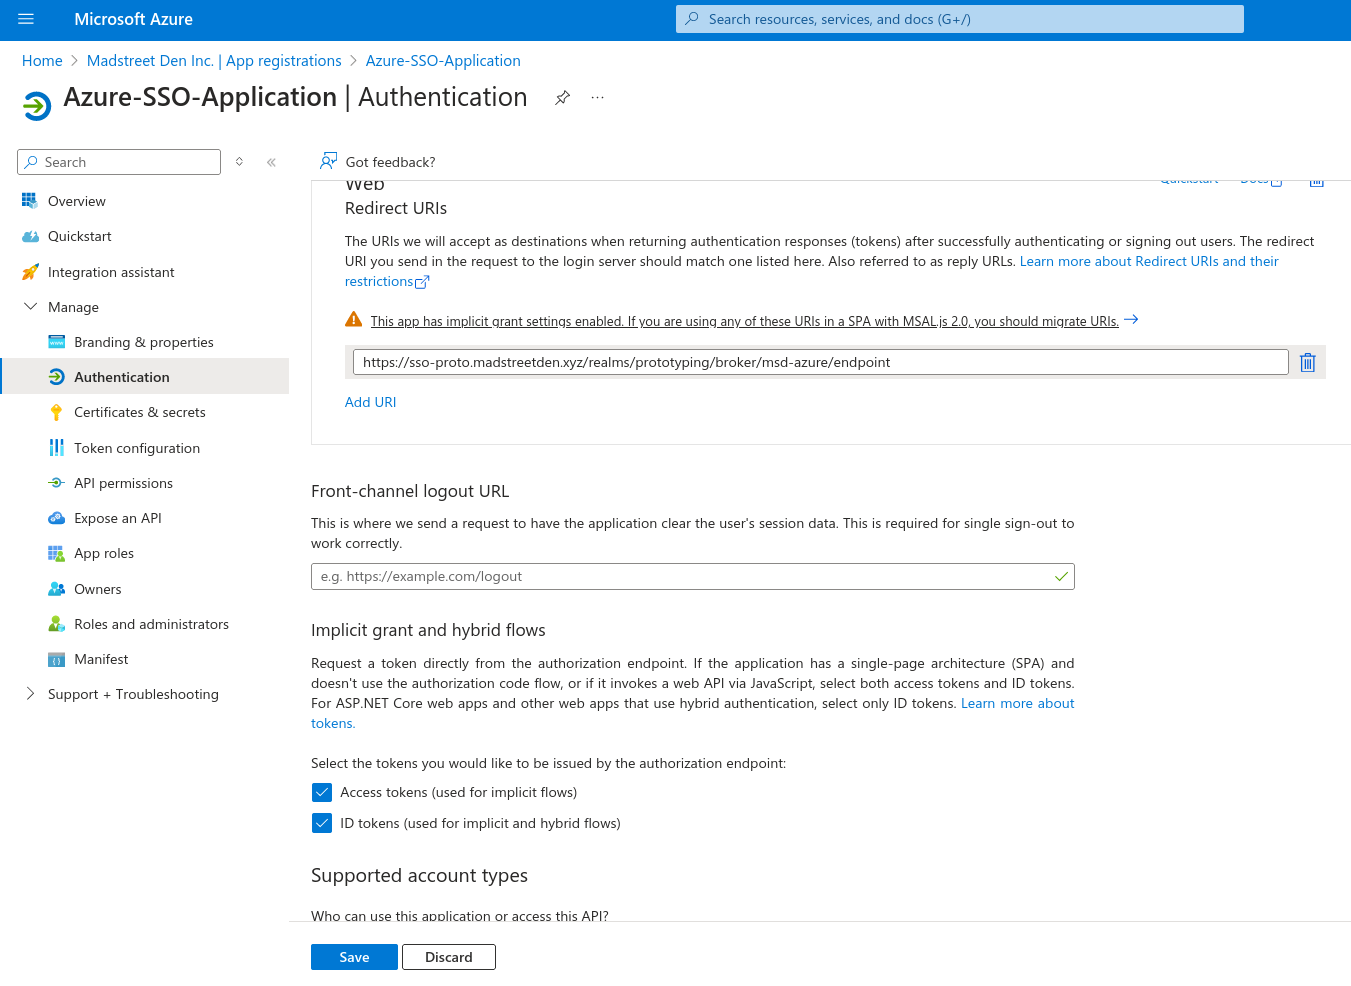
Google Cloud Platform
To use Google SSO to login to the Vue Platform, you would need to do the following:
- In your Google Cloud Console, navigate to the APIs & Services section within your Google Cloud Service.
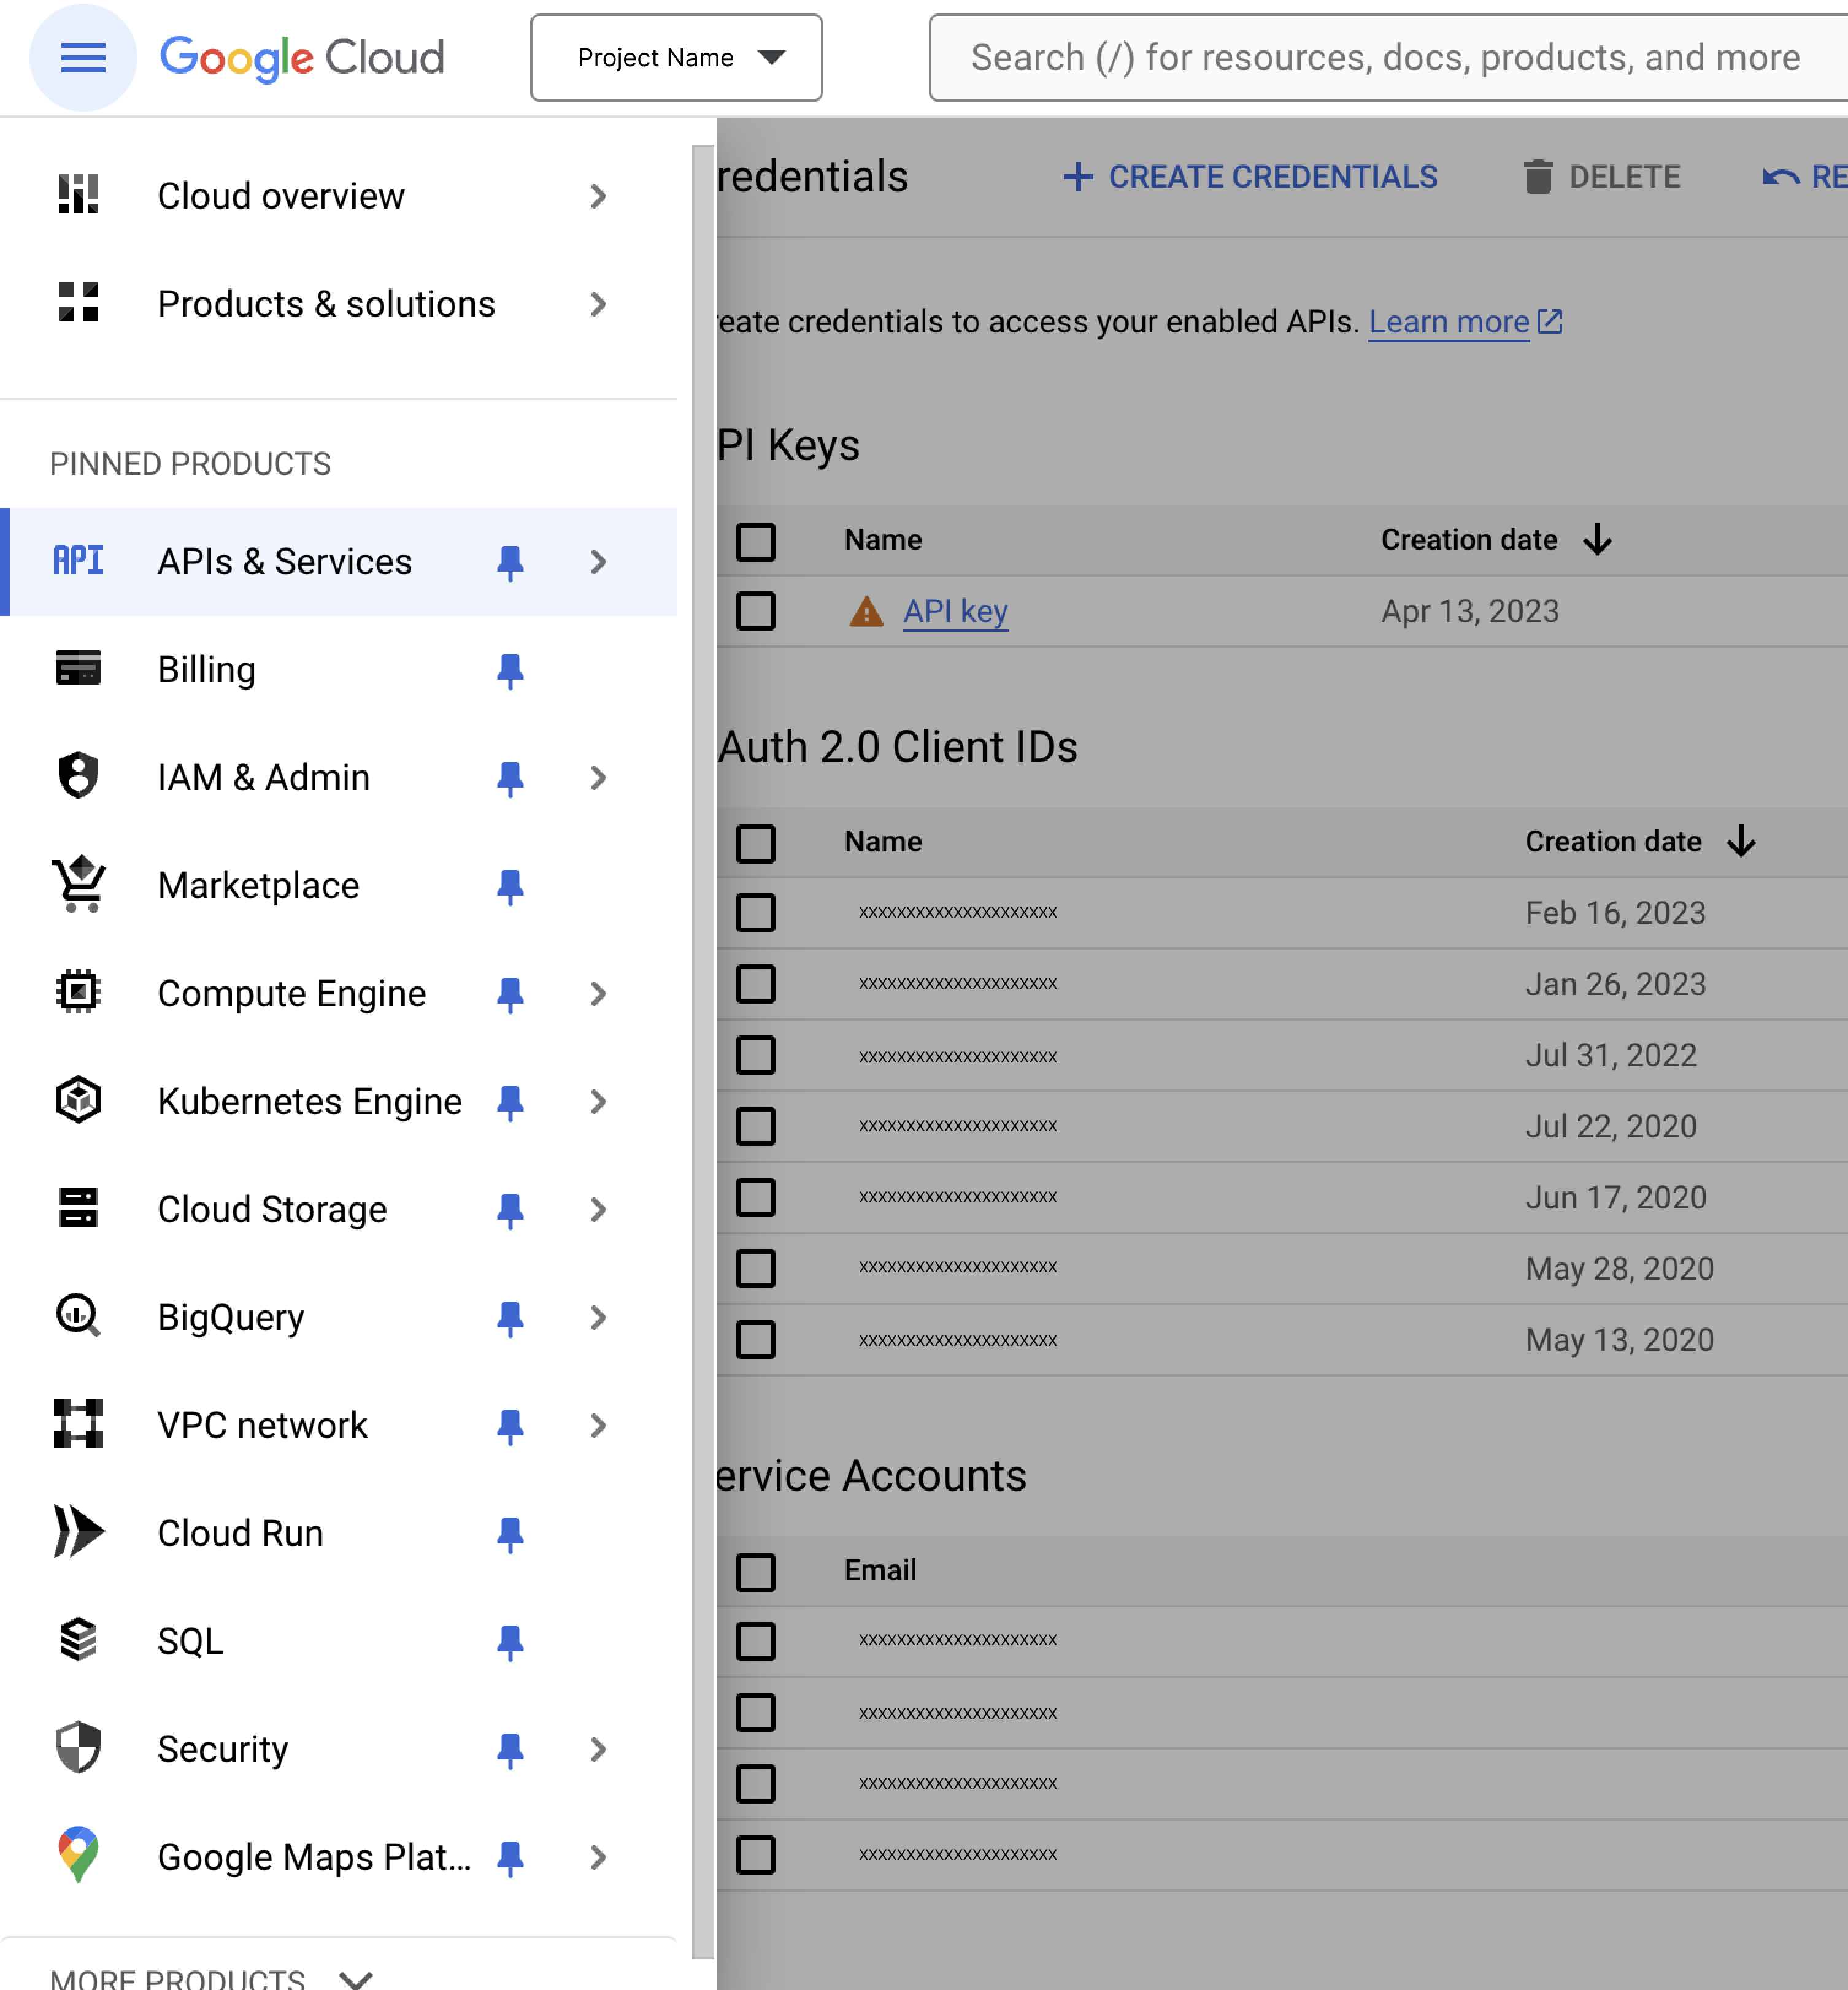
- Next, select Credentials.
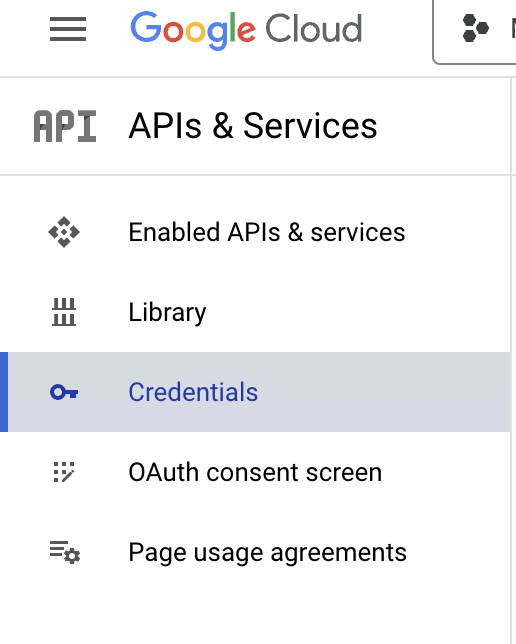
- Create an OAuth Client ID credentials and choose Application type as Web application.
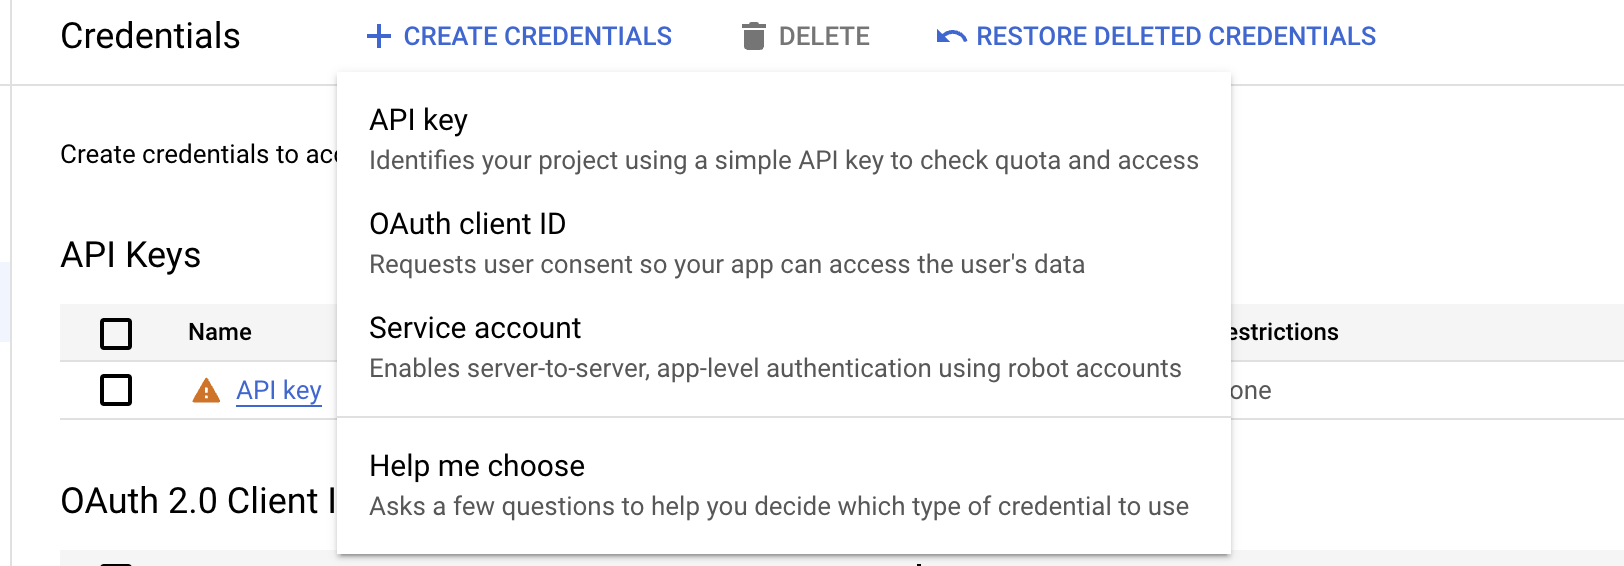
- Send the Client ID, Client Secret from the created Application to us at Vue.
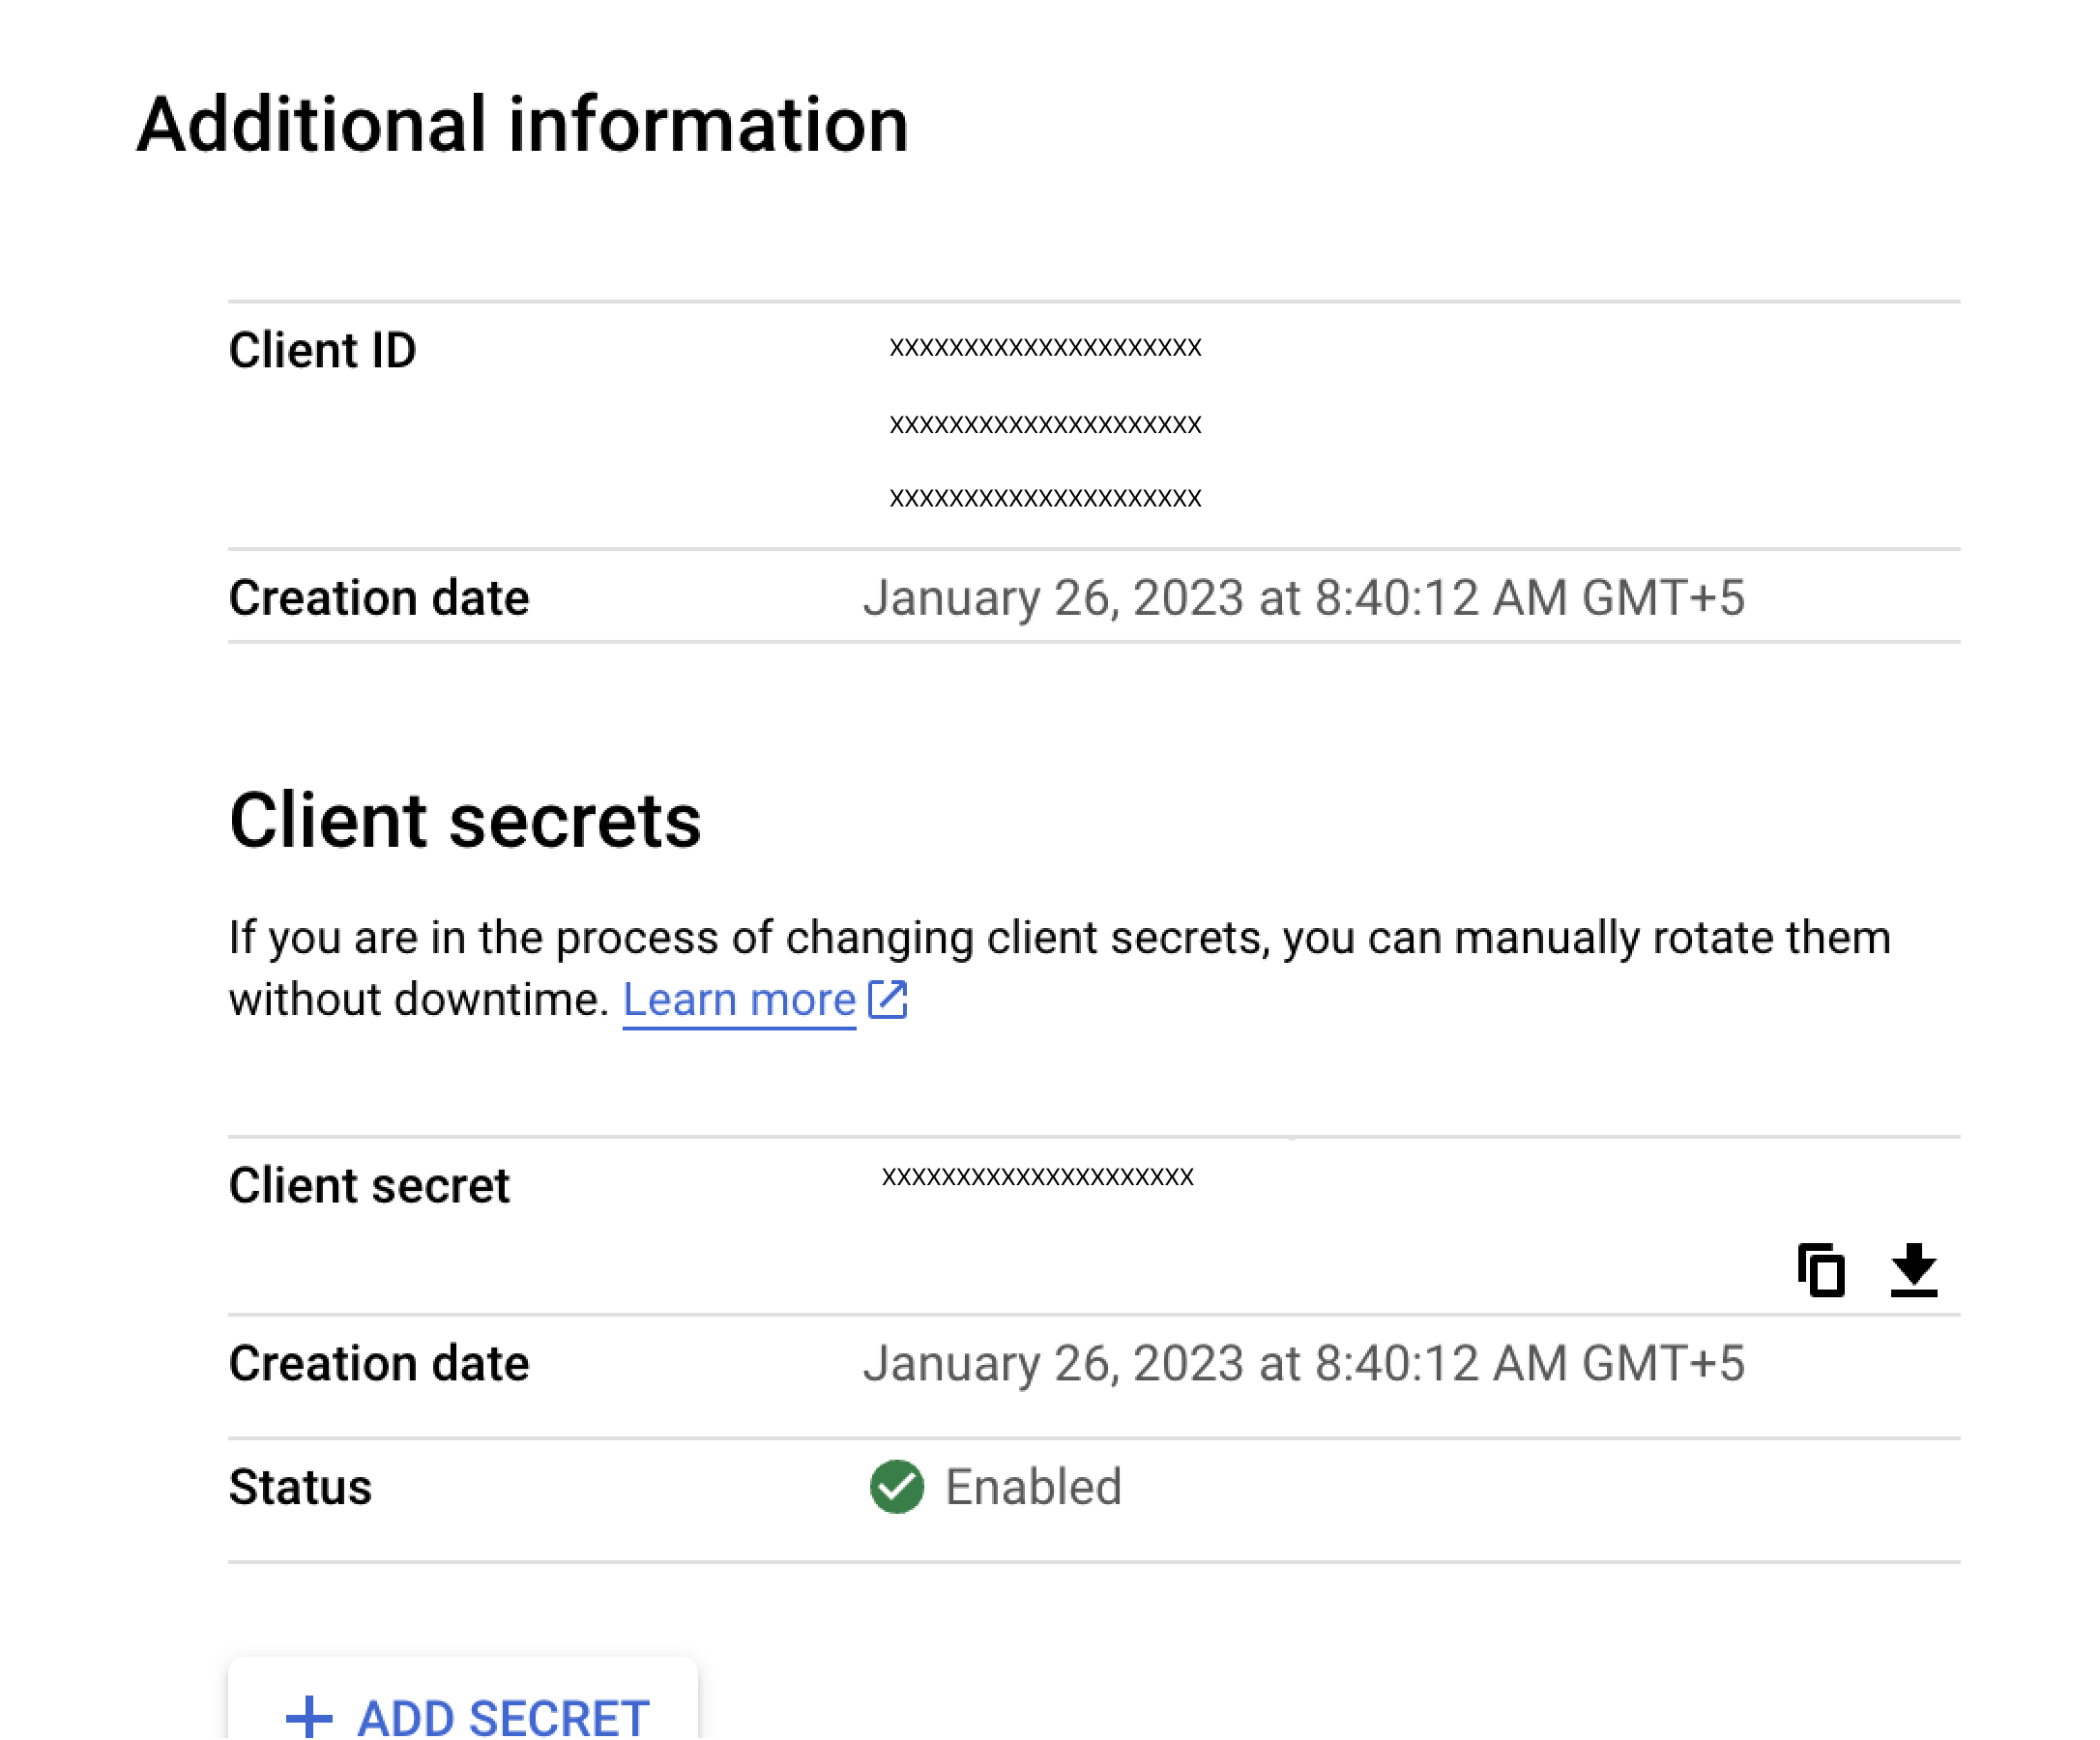
- We will generate a Redirect URI which needs to be added to Authorized redirect URI's in your application.

- Once the above steps are completed, you can use Google SSO to login to the Vue Platform.
Okta Configuration
Setting up Okta OIDC application
Head to your Okta project.
Under Okta Project, navigate to Applications
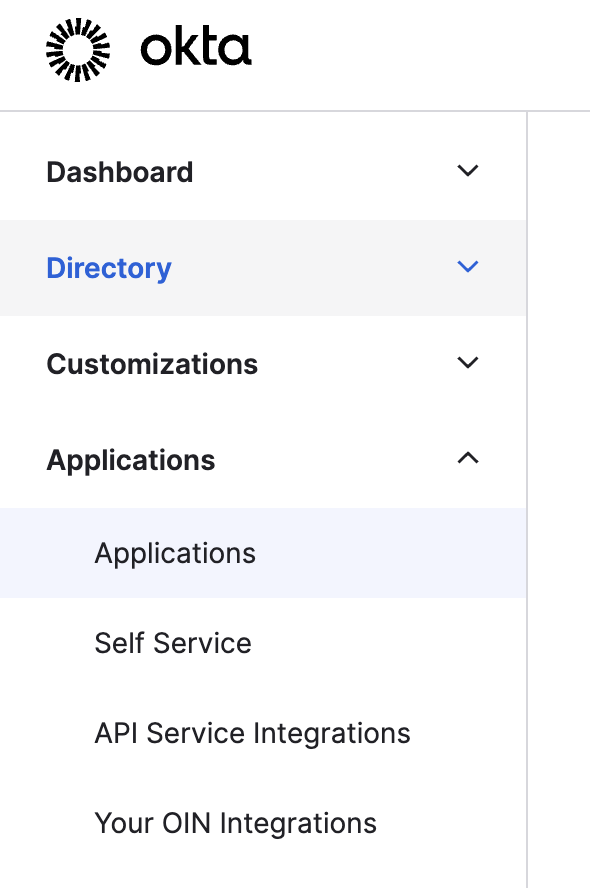
- Create a new application and select the following configurations:
- Sign-in method: OIDC - OpenID Connect
- Application type: Web Application
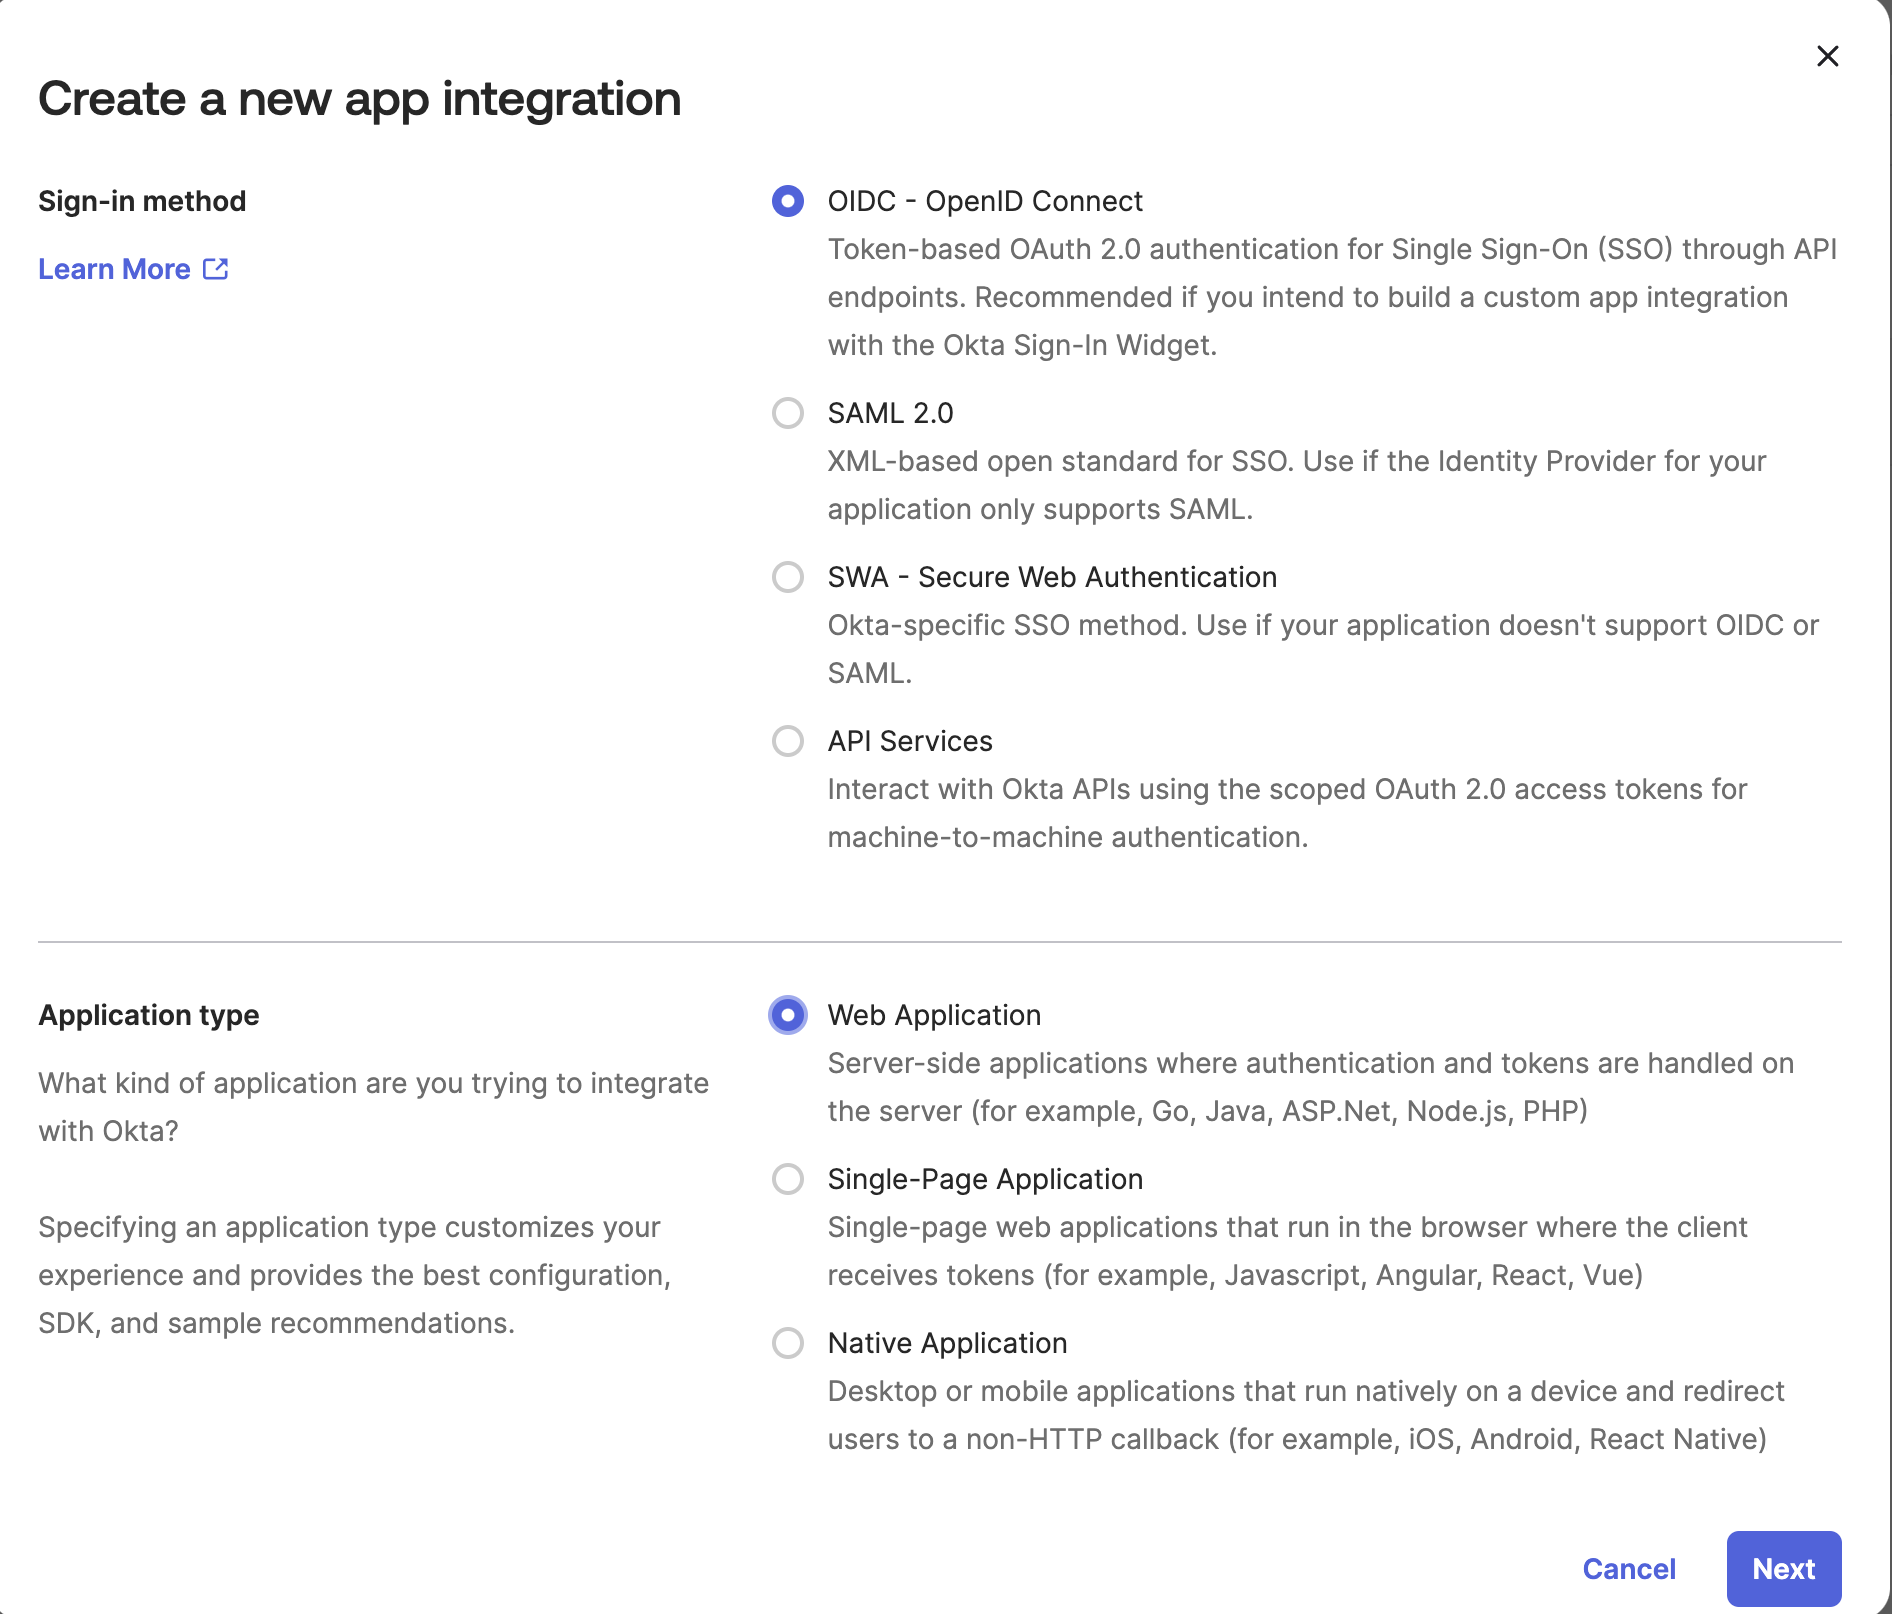
- Provide a name for the Application and select the options in Grant Type as illustrated in the below screenshot
- Under Controlled access, select 'Allow everyone in your organization to access' option and Enable immediate access.
- The Application will contain client id, client secret, copy both client ID and client secret key.
- Paste the Client ID, secret key into Vue's SSO configuration screen and click on Confirm.
- Copy & Paste the generated Redirect URI's in Okta's Sign-in redirect URIs section

And that's it. Okta OIDC SSO integration is enabled for your account.